An upwards breakout was expected, but has come a day or so earlier than expected in yesterday’s analysis.
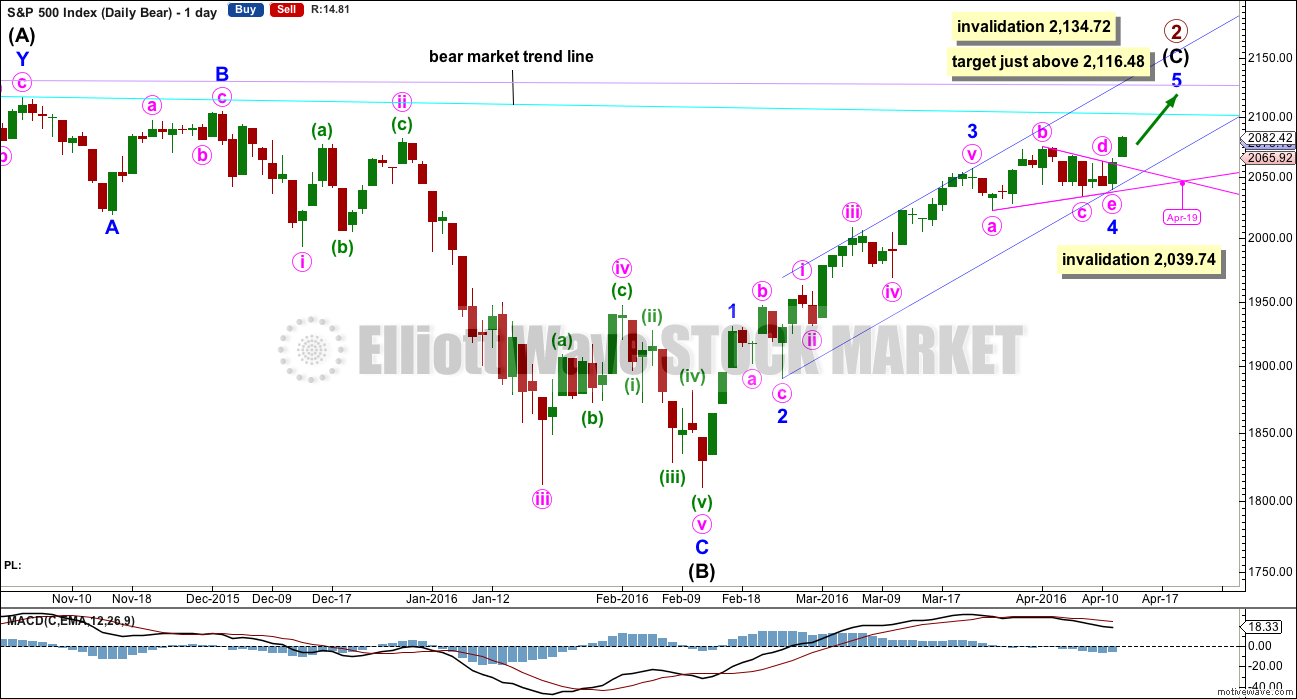
Summary: This is still a bear market rally until proven otherwise. A final fifth wave up is required to complete the structure. A new high reasonably above 2,075.07 would confirm a fifth wave is underway, with a target just above 2,116.48. It may end in just four more sessions on 19th April, 2016. The upwards trend is very weak.
To see last published monthly charts click here.
To see how each of the bull and bear wave counts fit within a larger time frame see the Grand Supercycle Analysis.
To see detail of the bull market from 2009 to the all time high on weekly charts, click here.
New updates to this analysis are in bold.
BEAR ELLIOTT WAVE COUNT
WEEKLY CHART
This bear wave count fits better than the bull with the even larger picture, super cycle analysis found here. It is also well supported by regular technical analysis at the monthly chart level.
Importantly, there is no lower invalidation point for this wave count. That means there is no lower limit to this bear market.
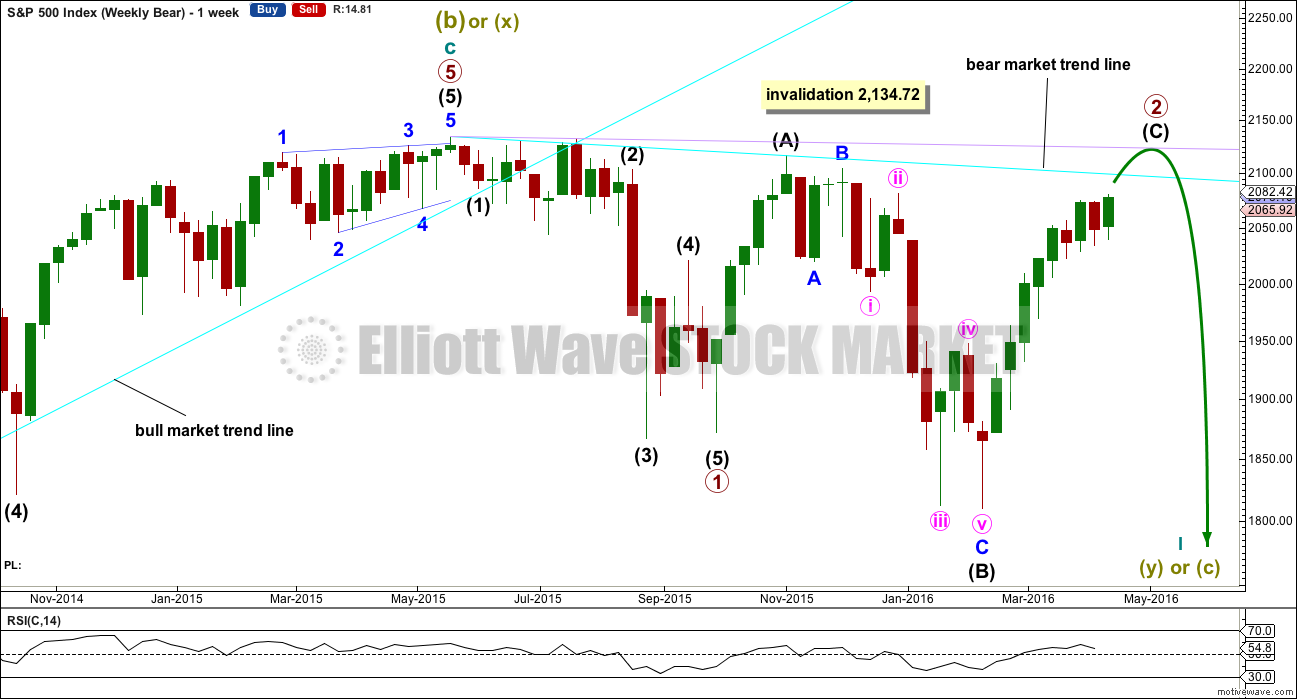
Primary wave 1 may be complete and may have lasted 19 weeks, two short of a Fibonacci 21. So far primary wave 2 is in its 27th week. It looks unlikely to continue for another 7 weeks to total a Fibonacci 34, so it may end in about one to two weeks time. This would still give reasonable proportion between primary waves 1 and 2. Corrections (particularly more time consuming flat corrections) do have a tendency to be longer lasting than impulses.
Primary wave 2 may be unfolding as an expanded or running flat. Within primary wave 2, intermediate wave (A) was a deep zigzag (which will also subdivide as a double zigzag). Intermediate wave (B) fits perfectly as a zigzag and is a 1.21 length of intermediate wave (A). This is within the normal range for a B wave of a flat of 1 to 1.38.
Intermediate wave (C) is likely to make at least a slight new high above the end of intermediate wave (A) at 2,116.48 to avoid a truncation and a very rare running flat. However, price may find very strong resistance at the final bear market trend line. This line may hold price down and it may not be able to avoid a truncation. A rare running flat may occur before a very strong third wave down.
If price moves above 2,116.48, then the new alternate bear wave count would be invalidated. At that stage, if there is no new alternate for the bear, then this would be the only bear wave count.
Primary wave 2 may not move beyond the start of primary wave 1 above 2,134.72.
DAILY CHART
Intermediate wave (A) fits as a single or double zigzag.
Intermediate wave (B) fits perfectly as a zigzag. There is no Fibonacci ratio between minor waves A and C.
Intermediate wave (C) must subdivide as a five wave structure. It is unfolding as an impulse.
Intermediate wave (C) does not have to move above the end of intermediate wave (A) at 2,116.48, but it is likely to do so to avoid a truncation. If it is truncated and primary wave 2 is a rare running flat, then the truncation is not likely to be very large. As soon as price is very close to 2,116.48 this wave count looks at the possibility of a trend change.
The next wave down for this wave count would be a strong third wave at primary wave degree.
Minor wave 4 is now over as a running contracting triangle. Extend the triangle trend lines out. The point in time at which they cross over sometimes sees a trend change; sometimes this is where the fifth wave to follow a fourth wave triangle ends. This point in time is now the 19th of April which would see overall upwards movement continue for a further four sessions. This looks about right.
The target is for intermediate wave (C) to end just above the end of intermediate wave (A) at 2,116.48, so that a truncation is avoided.
Redraw the channel about the impulse of intermediate wave (C) using Elliott’s second technique: draw the first trend line from the ends of the second to fourth waves at minor degree, then place a parallel copy on the end of minor wave 3. Minor wave 5 may end midway within the channel. When this channel is breached by downwards movement, that will be the earliest indication of a possible end to primary wave 2.
Because expanded flats do not fit nicely within trend channels, a channel about their C waves may be used to indicate when the expanded flat is over. After a breach of the lower edge of the channel, if price then exhibits a typical throwback to the trend line, then it may offer a perfect opportunity to join primary wave 3 down. This does not always happen, so if it does in this case take the opportunity.
Within minor wave 5 no second wave correction may move beyond the start of its first wave below 2,039.74.
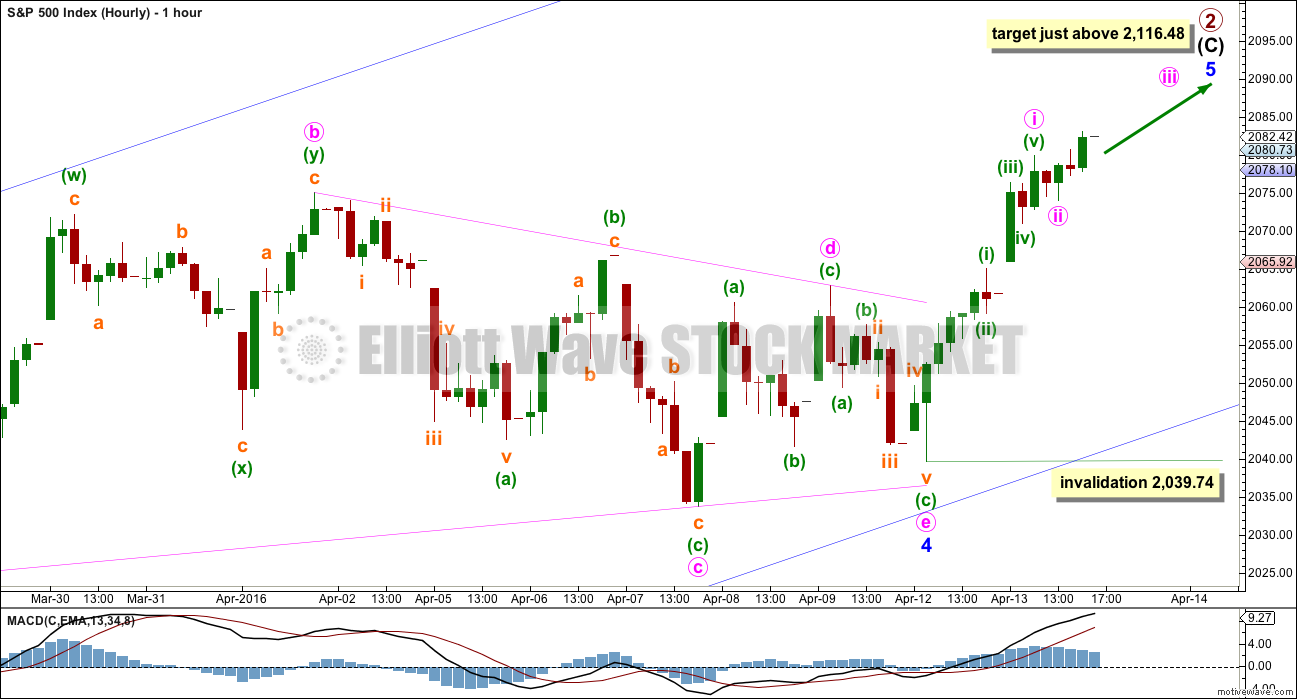
HOURLY CHART
The upwards movement out of the triangle was weak, but it is now too high to be a part of a barrier triangle. The B-D trend line would not be essentially flat. Upwards movement must be minor wave 5. Minor wave 4 was over.
Minor wave 5 is expected to be shorter in length than minor wave 1 but longer in duration. Minor wave 1 lasted only three days. Minor wave 5 is expected to last a Fibonacci five days in total, so far it has lasted one (counting only today as the first daily candlestick).
If minor wave 5 is to look somewhat similar to minor wave 1 and neither of them to be extensions, then the subdivisions within it may look the same. Within minor wave 1, the corrections for minute waves ii and iv were brief and shallow; they did not show up on the daily chart. If minor wave 5 has a similar look, then minute waves i and ii may now be over. Minute wave iii may have just begun at the end of Wednesday’s session.
If this expectation is wrong, then the labelling within minor wave 5 may be wrong. Minute wave i may not be over and minute wave ii may be deeper and longer lasting. It may not move below the start of minute wave i at 2,039.74.
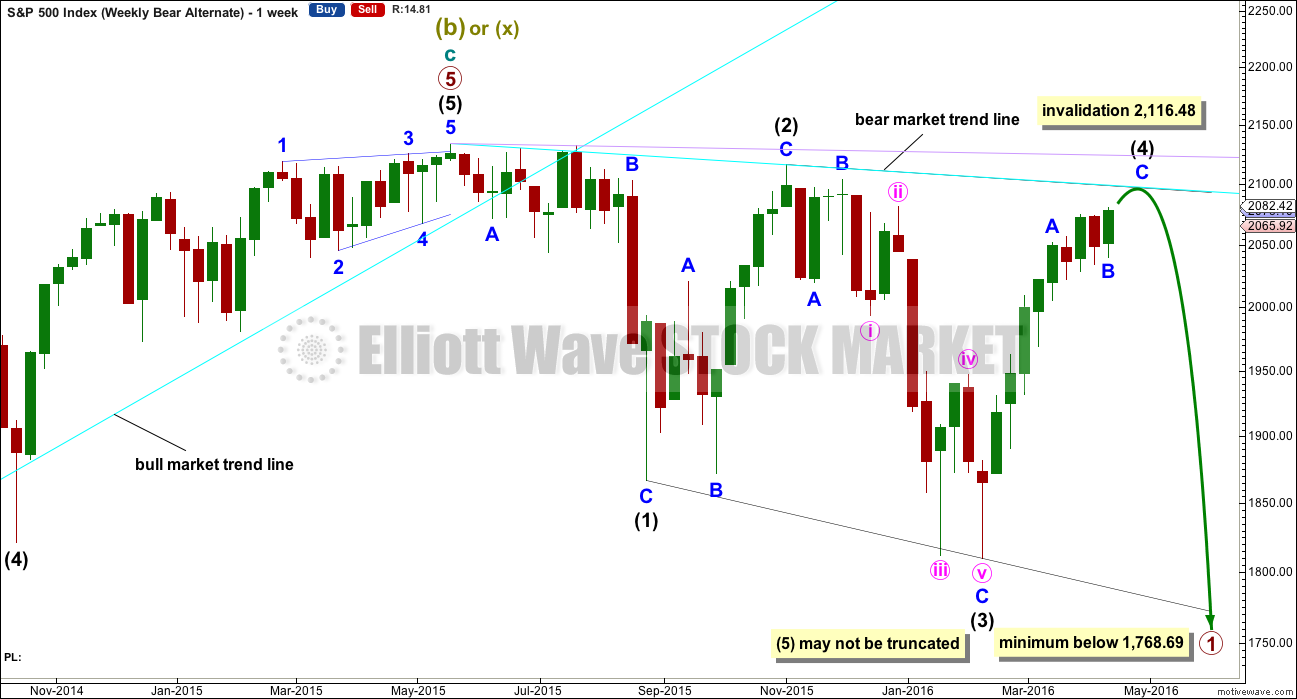
ALTERNATE WEEKLY CHART
Primary wave 1 may subdivide as one of two possible structures. The main bear count sees it as a complete impulse. This alternate sees it as an incomplete leading diagonal.
The diagonal must be expanding because intermediate wave (3) is longer than intermediate wave (1). Leading expanding diagonals are not common structures, so that reduces the probability of this wave count to an alternate.
Intermediate wave (4) may continue higher now and may find resistance at the bear market trend line.
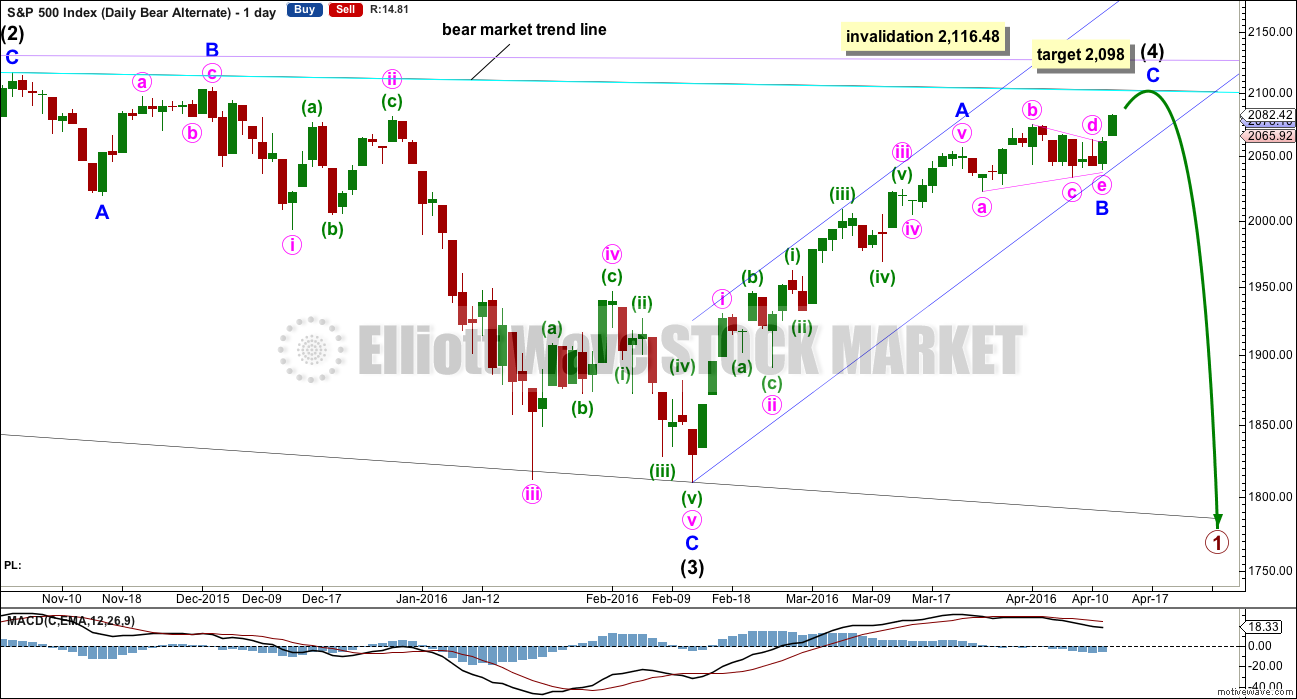
ALTERNATE DAILY CHART
Within a leading diagonal, subwaves 2 and 4 must subdivide as zigzags. Subwaves 1, 3 and 5 are most commonly zigzags but may also sometimes appear to be impulses.
Intermediate wave (3) down fits best as a zigzag.
In a diagonal the fourth wave must overlap first wave price territory. The rule for the end of a fourth wave is it may not move beyond the end of the second wave.
Expanding diagonals are not very common. Leading expanding diagonals are less common.
Intermediate wave (4) must be longer than intermediate wave (2), so it must end above 2,059.57. This minimum has been met. The trend lines diverge.
The triangle is seen as minor wave B. Intermediate wave (4) now has a clearer three wave look to it.
At 2,098 minor wave C would reach 0.236 the length of minor wave A. Intermediate wave (4) would find resistance at the bear market trend line, and price would stop very close to the round number of 2,100. This would have the right look for this wave count.
Leading diagonals may not have truncated fifth waves. Intermediate wave (5) would most likely be a zigzag, must end below 1,810.10, and must be longer in length than intermediate wave (3) which was 306.38 points.
BULL ELLIOTT WAVE COUNT
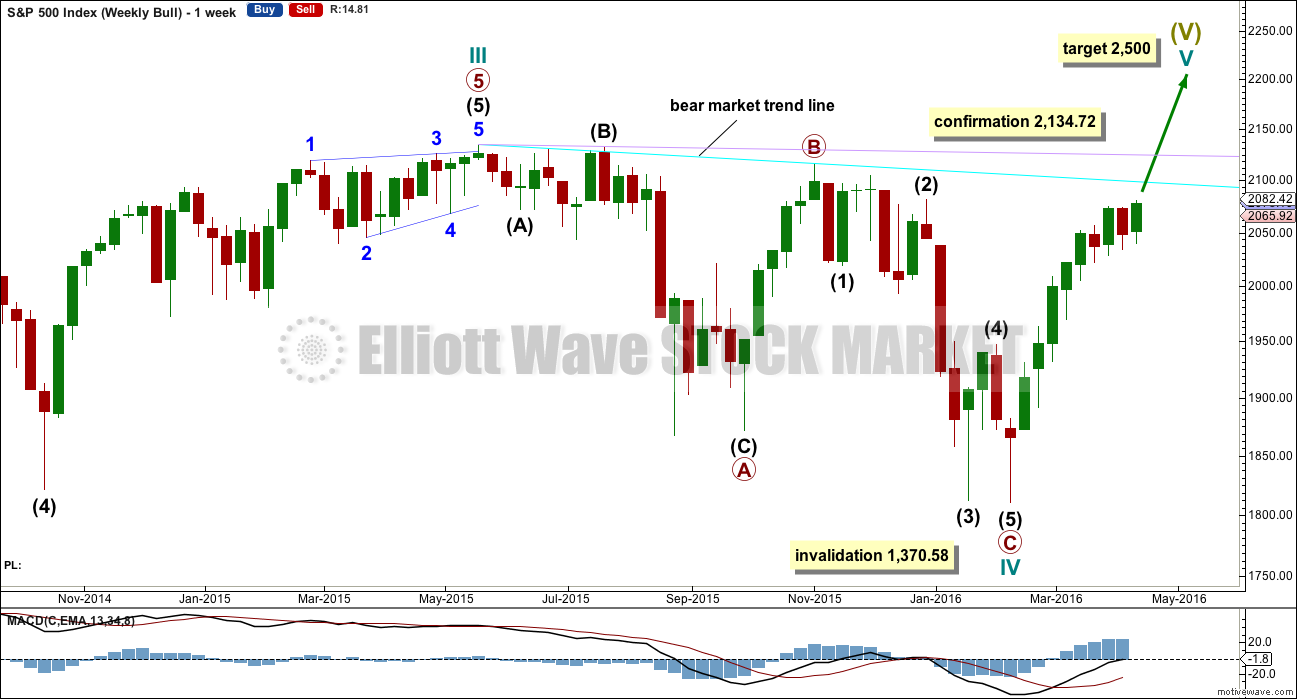
WEEKLY CHART
Cycle wave II was a shallow 0.41 zigzag lasting three months. Cycle wave IV may be a complete shallow 0.19 regular flat correction, exhibiting some alternation with cycle wave II.
At 2,500 cycle wave V would reach equality in length with cycle wave I.
Price remains below the final bear market trend line. This line is drawn from the all time high at 2,134.72 to the swing high labelled primary wave B at 2,116.48 on November 2015. This line is drawn using the approach outlined by Magee in the classic “Technical Analysis of Stock Trends”. To use it correctly we should assume that a bear market remains intact until this line is breached by a close of 3% or more of market value. In practice, that price point would be a new all time high which would invalidate any bear wave count.
This wave count requires price confirmation with a new all time high above 2,134.72.
While price has not made a new high, while it remains below the final bear market trend line and while technical indicators point to weakness in upwards movement, this very bullish wave count comes with a strong caveat. I do not have confidence in it.
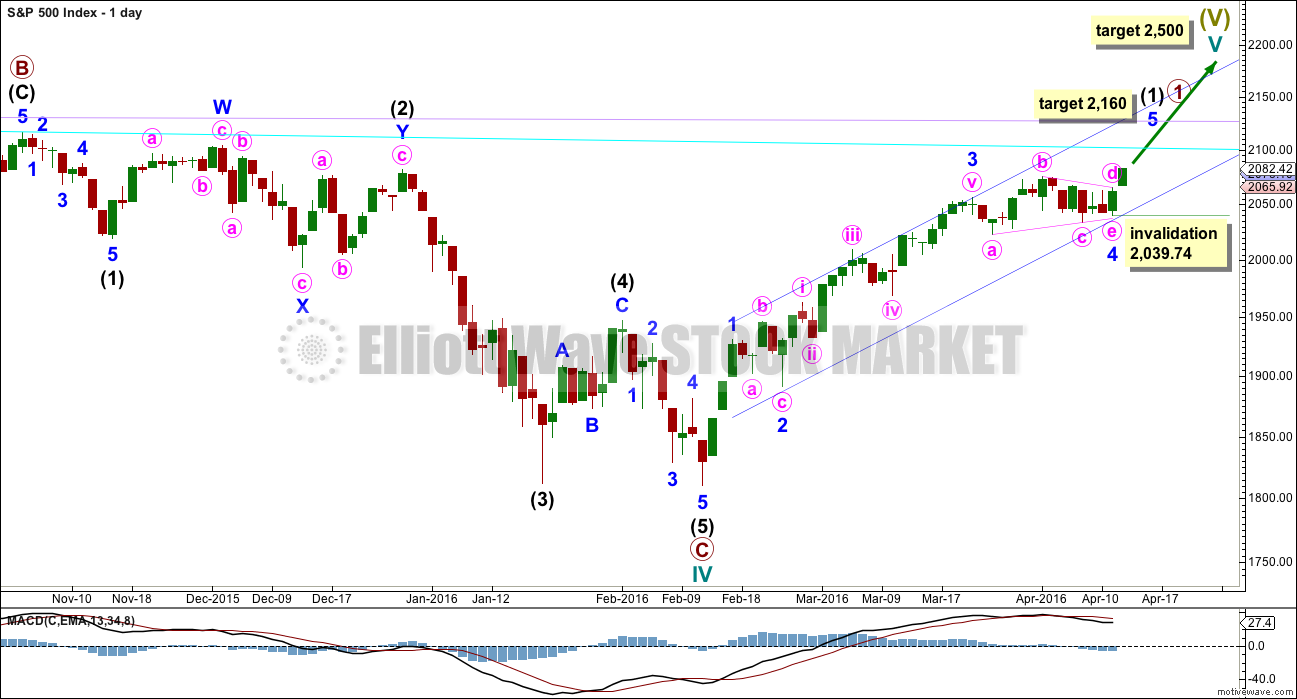
DAILY CHART
Intermediate wave (2) is seen as an atypical double zigzag. It is atypical in that it moves sideways. Double zigzags should have a clear slope against the prior trend to have the right look. Within a double zigzag, the second zigzag exists to deepen the correction when the first zigzag does not move price deep enough. Not only does this second zigzag not deepen the correction, it fails to move at all beyond the end of the first zigzag. This structure technically meets rules, but it looks completely wrong. This gives the wave count a low probability.
If the bull market has resumed, it must begin with a five wave structure upwards at the daily and weekly chart level. So far that is incomplete.
At 2,160 minor wave 5 would reach equality in length with minor wave 1.
Within minor wave 5, no second wave correction may move beyond the start of its first wave below 2,039.74.
TECHNICAL ANALYSIS
DAILY CHART
Click chart to enlarge. Chart courtesy of StockCharts.com.
Volume data on StockCharts is different to that given from NYSE, the home of this index. Comments on volume will be based on NYSE volume data when it differs from StockCharts.
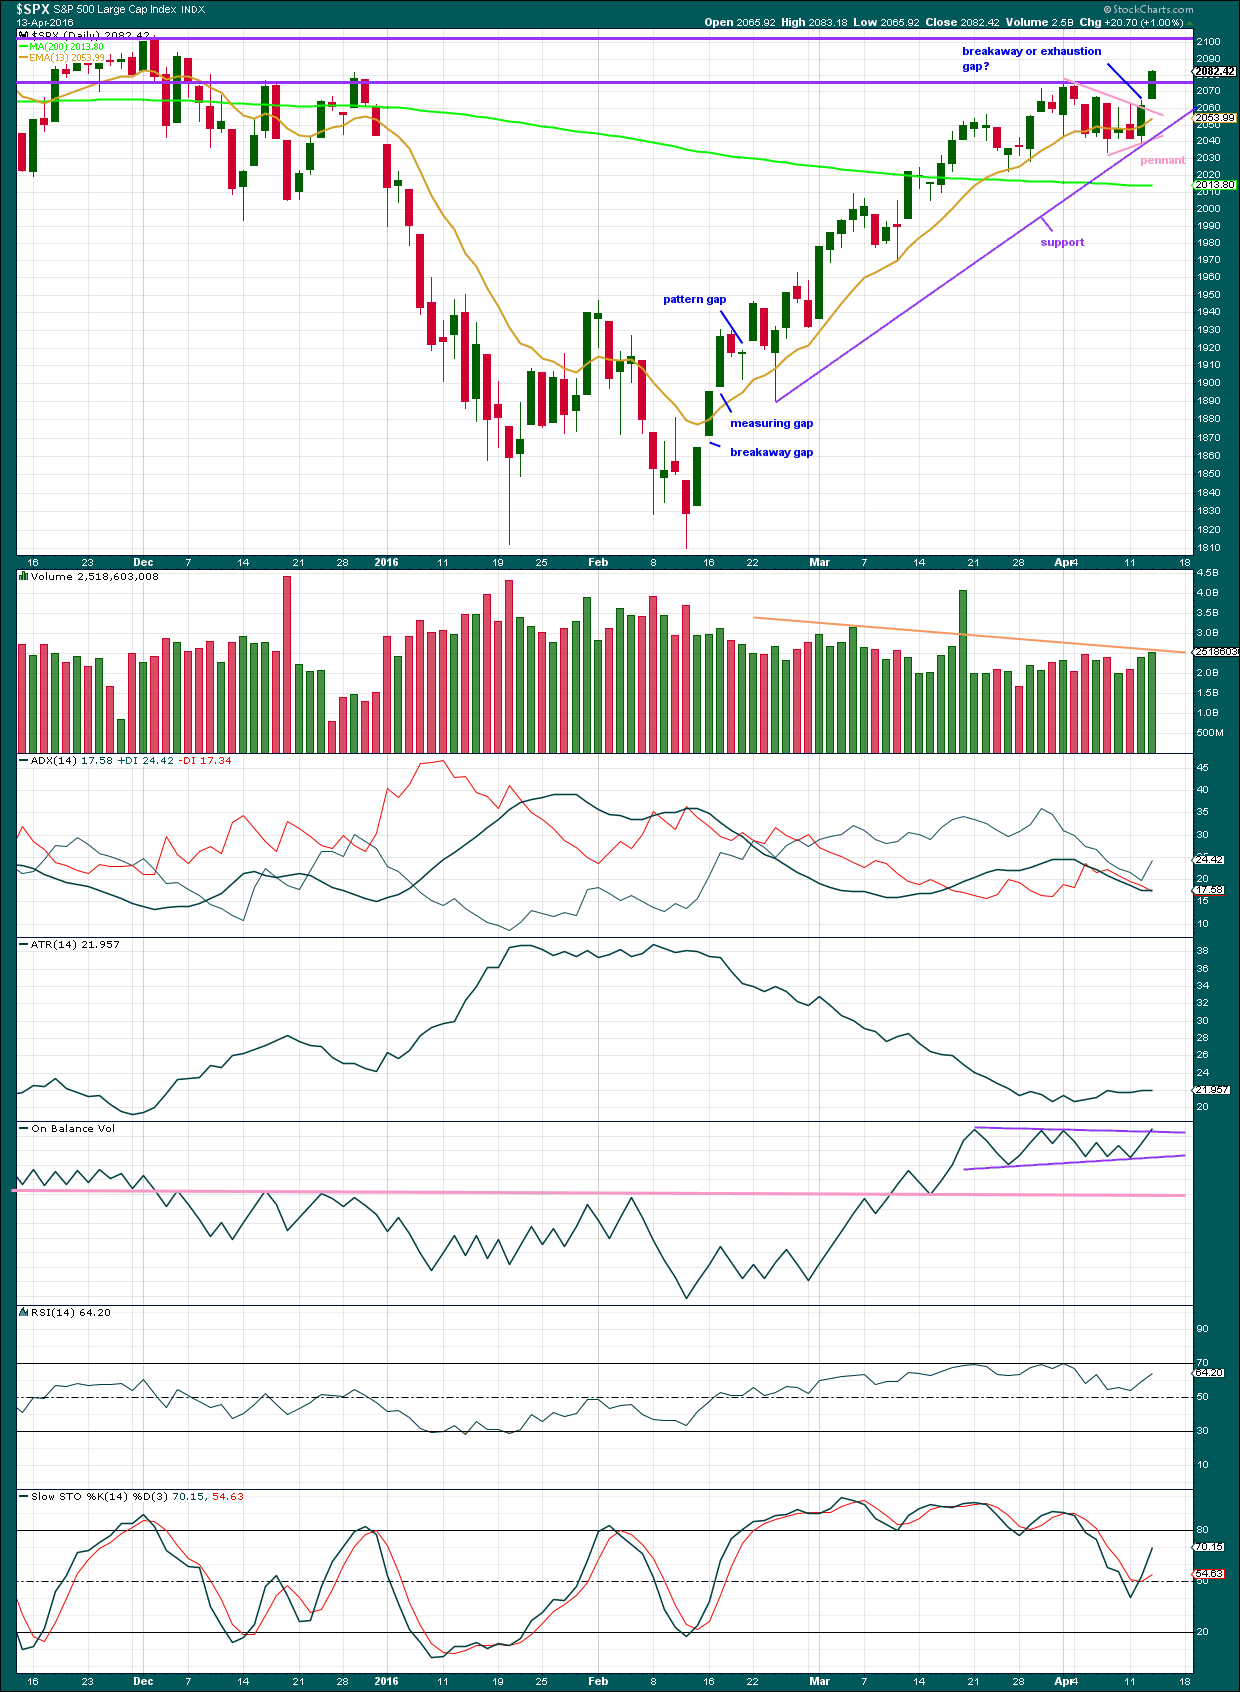
Price has been trending upwards for 42 days. The 13 day moving average is mostly showing where downwards corrections are finding support. It looks like a small pennant pattern has completed and is followed by an upwards breakout with a gap and an increase in volume. The trend has resumed after a few days of consolidation.
If the gap is closed within a very few days, then it may be an exhaustion gap. If it is not closed within a few days, it may be a breakaway gap from the pennant pattern. At this stage, because the gap appears after a small pattern and on a day with higher volume, it should provide support short term. Any short term buy positions may have their stops moved up to just below the lower edge of the gap.
As price moves upwards, it comes overall with declining volume. The trend is weak. It is not supported by volume, so is unsustainable.
ADX is today slightly rising indicating the upwards trend has most likely returned. ATR is now slightly increasing which supports ADX. At this stage, it looks like there is a trend and it is up.
ATR declined for most of this upwards trend. This is not normal for a trend and it indicates weakness.
On Balance Volume may be beginning to break above the upper purple trend line which has delineated recent OBV movement. If this breakout becomes clearer, it would be a small bullish signal. For OBV to give a clear bearish signal it needs to break below the pink line which has strong technical significance.
RSI has not managed to reach overbought during this trend. Price made a new high today within this current trend yet RSI has not made a corresponding new high. There is now divergence between price and RSI indicating weakness in price.
Stochastics also shows strong divergence with price. This also is indicating price is weak.
INVERTED VIX DAILY CHART
Click chart to enlarge. Chart courtesy of StockCharts.com.
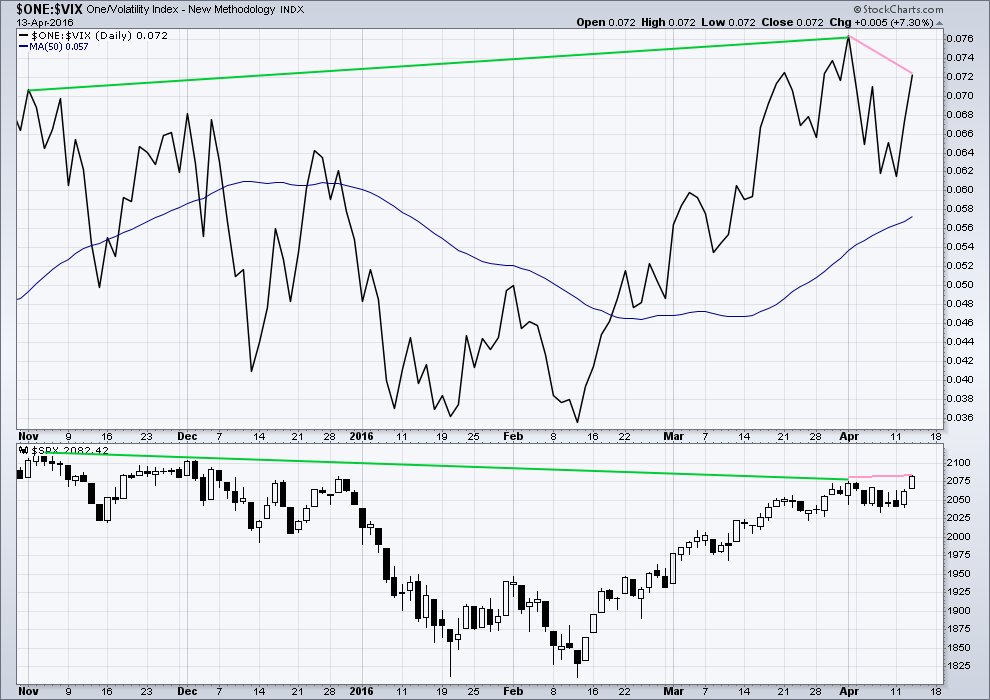
Volatility declines as inverted VIX climbs. This is normal for an upwards trend.
What is not normal here is the divergence over a reasonable time period between price and inverted VIX (green lines). The decline in volatility is not translating to a corresponding increase in price. Price is weak. This divergence is bearish.
Price made a new short term high today, but VIX has failed to make a corresponding high (pink lines). This is regular bearish divergence. It indicates further weakness in the trend.
BULLISH PERCENT DAILY CHART
Click chart to enlarge. Chart courtesy of StockCharts.com.
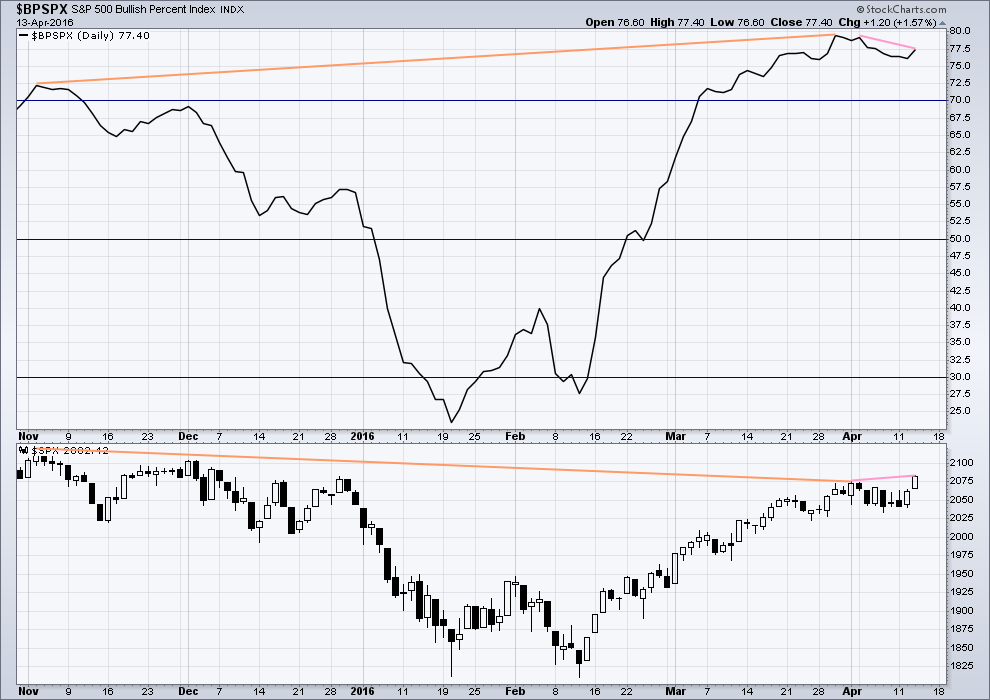
There is strong hidden bearish divergence between price and the Bullish Percent Index (orange lines). The increase in the percentage of bullish traders is more substantial than the last high in price. As bullish percent increases, it is not translating to a corresponding rise in price. Price is weak.
This looks like an overabundance of optimism which is not supported by price.
As price made a new short term high today, BP did not (pink lines). This is regular bearish divergence. It indicates weakness to the upwards trend.
ADVANCE DECLINE LINE

Click chart to enlarge. Chart courtesy of StockCharts.com.
With the AD line increasing, this indicates the number of advancing stocks exceeds the number of declining stocks. This indicates that there is breadth to this upwards movement.
From November 2015 to now, the AD line is making new highs while price has so far failed to make a corresponding new high. This indicates weakness in price; the increase in market breadth is unable to be translated to increase in price.
It remains to be seen if price can make new highs beyond the prior highs of 3rd November, 2015. If price can manage to do that, then this hidden bearish divergence will no longer be correct, but the fact that it is so strong at this stage is significant. The AD line will be watched daily to see if this bearish divergence continues or disappears.
The 200 day moving average for the AD line is now increasing. This alone is not enough to indicate a new bull market. During November 2015 the 200 day MA for the AD line turned upwards and yet price still made subsequent new lows.
DOW THEORY
I am choosing to use the S&P500, Dow Industrials, Dow Transportation, Nasdaq and the Russell 2000 index. Major swing lows are noted below. So far the Industrials, Transportation and Russell 2000 have made new major swing lows. None of these indices have made new highs.
I am aware that this approach is extremely conservative. Original Dow Theory has already confirmed a major trend change as both the industrials and transportation indexes have made new major lows.
At this stage, if the S&P500 and Nasdaq also make new major swing lows, then my modified Dow Theory would confirm a major new bear market. At that stage, my only wave count would be the bear wave count.
The lows below are from October 2014. These lows were the last secondary correction within the primary trend which was the bull market from 2009.
These lows must be breached by a daily close below each point.
S&P500: 1,821.61
Nasdaq: 4,117.84
DJIA: 15,855.12 – close below on 25th August 2015.
DJT: 7,700.49 – close below on 24th August 2015.
Russell 2000: 1,343.51 – close below on 25th August 2015.
This analysis is published @ 10:11 p.m. EST.

Another technician saying Breakout to new highs (From OppenH). He speaks as I post this.
He is using some time measurement + the advance/decline line. Double bottom… reversal and then breakout. 2250 by year end.
https://www.superstation95.com/index.php/world/1152…… interesting tidbit,, notice the date,,Apr. 19
Yes, very interesting!
They’re in competition with the USA is my bet. And they want to win. It’s a matter of pride.
I would say that’s the underlying impetus for the move.
Apart from not wanting any more USD if they have enough already.
I’ve been hearing about this significant development on world economics. It means the end of the US $ as the reigning world currency. I am a loyal and patriotic US citizen. But I’d much prefer to use currency that is backed by gold instead of currency backed by a printing press. I have been told this development is the reason for all the emergency Fed meetings and IMF meetings etc.
I am not sure it will cause a massive and immediate sell off in US $ denominated instruments and markets. But it is not good for the world’s largest debtor, the US, or should I say they US citizens. We are left holding the bag and it is full of ???.
The other world currency’s aren’t any better.
My concern is this: if the USD gets devalued due to this, doesn’t this mean the markets will go higher??? Stocks usually go down when the dollar strengthens, not weakens. So do all other markets: Euro, Japan, etc…
That relationship may no longer hold.
Here’s my theory FWIW:
This could be a move further away from regarding the USA as the leading world economy. Power may be shifting and a huge bear market may be the process.
As power shifts the USD may see flight from it towards a new major player, maybe the Chinese yuan but possibly something else.
This may coincide with a shift in investment from US markets as well. The indices may fall while the USD falls also. Europe may fall too. Asia may rise.
Now this theory is just that, a theory. I’m sure there are plenty of holes in it. It’s really just a musing out loud.
Lara
How does this align with your GOLD EW readings and expectations moving forward?
The dollar is going to strengthen again and stay strong for the next couple of years. Deflation will accelerate soon.
People often forget that so much of the world’s debt is denominated in dollars, and that debt destruction will offer some temporary reprieve so far as the dollar’s ultimate demise is concerned. I agree first we see deflation, then inflation like we have never seen…
We all know that China has nom taken over US in terms of the World GDP. I recall last numbers I saw reported China at 27-29% while US was 17%. The shift is happening and US will loose its spot at the top like all other before the US (England, France…).
There is another school of thinking that states by 2020-2025 the current currency based financial systems will be gone or replaced to large extent.
The other well-kept secret is that China’s gold reserves are far greater than what they have officially reported. The true information about just how much gold they do have will also be forthcoming when they introduce their new gold-back currency. This has been rumored for quite some time so its interesting to see it actually about to be announced. This is the kind of game-changing announcement that could usher in a primary wave decline. While folk may not get all the nuances of the implications of the dollar competing with a gold-backed currency, at some visceral level they are going to comprehend it will ultimately lead to the dollar’s and America’s demise (not immediately because of all the dollar denominated debt that will be destroyed, making the dollar more scarce and thus more valuable as deflation hits) and this will in turn result in the engine that powers all bear market being revved big time- FEAR!
I could not have said it any better.
I’m really struggling this morning with the short term structure on the hourly chart.
Conclusion: it can’t be over yet folks.
In my experience each time I really struggle to see a completed structure it generally means… it’s not complete.
I’m not sure where to put minute i end now. It doesn’t work at todays high. It doesn’t really work where I had it yesterday… unless tomorrow and Monday move higher without overlapping corrections to resolve a third wave. That’ll probably be my labelling.
Which expects minute iii has not passed its middle yet.
I think options expiration means an increase in overall volatility; probably much sound and fury…holding a few UVXY calls against the eventuality…’nite all…!
Amazing! I just got a note from the “other guys” affirming their expectation of new all time highs in the markets!!! Yikes!!!
Who are the other guy’s?
Prechter and company at EWI. He thinks we are still in an intermediate four triangle that will not be invalidated until we take out the Feb 11 lows. In a rare case of Steve Hochberg making his own call, the best he will concede is similar to Lara’s count of a minor five up to end even sooner than her count calls for. In fact he had a count showing a top last week but changed it with the new recovery highs yesterday. He still thinks we topped back in May of last year but I don’t think he believes this is primary two up. Nobody does….!….’cept us! 🙂
I recall back in early 2011 expecting the bounce after the GFC was primary 2 and everyone, everyone was waiting for primary 3 down.
Yet the whole 6+ years of bull market was a B wave and it had only just begun.
Lets see. Lets see if I can get it right this time…
I remember that…very painful for a lot of subscribers of theirs…took ’em literally years to change their tune, and they were dragged kicking and screaming. It is hysterically funny to hear the call now for new highs almost a year after we probably topped!
Well you did say everyone will be fooled.
That seems to be happening!
+ This I posted earlier today… A call I have a very, very … very hard time believing!
April 14, 2016 at 12:04 pm
Mike Mayo a Raging Bull on Bank Stocks!
Most Bullish he has been on Bank Stocks in 20 Years!
So it begins!
And he may yet be right.
And I may yet be wrong.
We have to wait and see.
I didn’t get a note from them today and nothing is posted there today.
It was a personal note in response to a query I sent ’em…
EWI?
Elliott Wave International…
Well, don’t go expecting a big move up (or down) tomorrow, regardless of the chart formation. Its unlikely, considering that monthly options are expiring. It would take something really big to overcome the market makers.
Chinese markets will have huge news tonight—GDP, retail sales, and industrial production. It will either be the catalyst to move the markets to its last leg up to complete wave 5 to Lara’s targets, or the start of primary wave 3…
Patiently waiting…
If you can rightly call the stuff they report “news”….! 🙂
Pure Fiction… The guy running the largest Pension fund in the USA said China’s growth is negative…. negative is far from 6.50%.
5 minute…lines not drawn the best but we get the idea
If we get a final move up tomorrow, I will be looking for an initial head-fake false break below the triangle followed by an immediate reversal to the upside in the final wave; the perfect scheme to confound bulls and bears alike…hopefully I get to scalp both moves…! 😉
Decline looking somewhat like a three wave move on five minute so we probably have more upside ahead. I expect the banksters will pump up the futures tonight! 🙂
that’s it. I think we’re done! there is a doji on the daily and 4 hour charts. and on the hourly wave 5 = wave 1.
There is more than one way to see the move up, included as a complete wave. If there is another move up, which is possible, I think it will be brief. Many red flags, and imo a high risk to reward ratio playing additional upside…
The bears are jumping early and attacking the run at the round numbers. It has been awhile since I have seen contested price action but the battle has clearly been joined. This ought to get quite interesting!
i’m still holding some calls…5 minute ABC from the top with A=C….
B wave of possible A-B-C on 5 min nowhere near 90% of A….a move back above 2084.25 would negate five down on 5 min though…
It would be very much in keeping with the character of this market to make an intra-day reversal such as this, catching everyone with their “shorts” down around their ankles so to speak… 🙂
Of course, it could just be a fourth wave correction as well..
Watching UVXY very closely, if it keeps going higher and closes solidly in the green with a fat green candle…
“Farewell Spanish Ladies…!”
I am guessing the count is not completed. All component waves must show up on the hourly charts. The fourth wave cannot breach the top of wave one though.
I am guessing one more wave up with a rapid impulsive reversal at the top to complete minor five…UVXY flying a bullish pennant so we may see some divergence….
Buying UVXY 18 strike calls expiring tomorrow for 0.80….
Actually, SPX did also poke its head above yesterday as well…so today’s penetration was the second the last two years…
Upper BB penetration by SPX!
Heads up folk! Take a look at UVXY….!
Nice rounded bottom on 5 min chart for UVXY.
I’ve been shut off twice today by DSL problems. Argh.
I noticed that the SPX keeps going up but UVXY and VIX have not made a lower low since earlier this morning. I assume it means accumulation. I would venture to guess it is smart money.
yes Rodney,, thats me…
Out of remaining SPY 208 calls. Small five down on one minute chart…
Possible ending diagonal for SPX on 5 min chart.
Yeah Baby!!
If it is… this should be a deep swift decline from here. Otherwise it is not it.
Yup. Should retrace to the beginning of the diagonal at 2074 quickly.
April 29 UVXY 21 strike calls have a bid/ask of 1.04/1.07. I am buying a few contracts at the market for my “canary in the coal mine trade”. I am using a few contracts as a trigger signal and will not have a stop loss on the trade. The idea is to see how they trade relative to SPX price action over the next several days. As the final wave moves up, I expect they will trade lower to find a bottom in the bid at around the time of the SPX high. The plan is to watch them bottom, then reverse and add to the position when they trade back up to around one buck. Of course if the market pulls a fast one and reverses faster and harder than a hockey puck in the face, you know what to do…! 🙂
(Should I be charging admission for these trade secrets??!! )
Just kidding folks; I really love sharing what I have found to be effective in these dicey markets!
Selling half SPY 208 calls for quick 80% pop…
Selling remaining NUGT 80 puts for 150% gain…
60 should hold, a great place to go long…
Mike Mayo a Raging Bull on Bank Stocks!
Most Bullish he has been on Bank Stocks in 20 Years!
So it begins!
I am starting to think that DJI 18,000.00 and SPX 2100.00 are now natural magnetic targets toward which we will see a concerted push by the bulls. There is a strange psychology around round numbers. Will they be achieved, and possibly slightly exceeded today?!
It would be a most fitting and picturesque climax to the bull run!
Not sure if that was two of minute three or four. How high this pop goes should tell…SPY 208 calls trading at 0.70; open STC at 1.1
Yesterday, The A-D line closed outside / above its Bollinger Band. This is an unusual and some might say rare development. I think it indicates an extreme overbought condition. I know that extreme sentiment and momentum indicators can become more extreme and remain extreme for some time. What it does portend, however, is a top of significance with a strong downwards move just ahead.
Again, just one more indicator that is giving a variety of evidence. Based on all the evidence including EW, the verdict beyond a reasonable doubt is that the market is about to top out and crash.
Yep. We find the market to be guilty sir. Judged. Sentenced.
Off to jail with it 🙂
Don’t forget the hand-cuffs…! 😀
Looks like we may get an extended third wave up for minute three. Re-buying small position in SPY 208 calls expiring tomorrow. Emphasis on small, and I would add speculative as now is NOT a good time for big comittments to the long side of this market imo…
Filled@0.45 per contract…
Vern, if you were to play the UVXY move up with options for SPX Primary 3 down…
Would you buy June expiration or something else… if you thought that move was reasonably near?
Would you buy $1, $2 or $3 in the money or something else?
If I were to play this with call options, I need to make sure I have enough of a time cushion because to me to get the time period wrong is where the most losses occur. I don’t care how much capital I put into the position.
Thanks, Asking because I am not sure I am comfortable putting a position on in UVXY and since you trade this often and follow closely I thought you could share your thoughts on this.
The only call options I own now in UVXY are leaps but I do own the actual shares. The run from trough to peak during an impulsive wave down which makes for a good trade usually lasts less than three weeks so the key is to correctly identify the beginning of the impulse or as close to is as possible. Of course if this is a primary third wave down things may develop a bit differently.
Once the impulse gets going, options one month out should give a sufficient margin of safety. I am not sure how much lower it will go but two green closes after a new 52 week low is usually tradeable at least for a short term pop. I would look for the first jump to the upper BB band to enter call positions if this is the first time you are trying to trade it to the upside. The very safest UVXY trade is the reversion to the mean after it penetrates the upper BB band. Getting positioned for the run higher can be a bit more of a challenge. Hope that helps a bit…
I like to try and get filled on calls for under a buck. For what it’s worth, I will post here when I pick up near term UVXY calls with strike price, expiry and bid amount included, for educational purposes only, of course! 🙂
If you wait for the move to get going… the options will cost much more, so how out of the money are these options under a buck?
Right now May 30 is under a buck. That a big spec play.
You will have plenty of time do don’t worry about the premiums. The real spike does not come until toward the end of the third wave down. I would keep an eye on those May 30 expiration premiums as they may go even lower. Once the decline is underway, just choose a higher strike price, if necessary, to get in under a buck. If this is a third down, even if only at intermediate degree, no need to rush to get positioned as we will have at least a few days of an open window to get positioned…
Joseph,
I’m not as experienced as Verne by any means, but if you don’t want to be too speculative look into longer term options and pay the premium. I’m currently looking at June 25 calls, went as low as 2.50 today. The BB’s have not been this tight on UVXY since November 11th, and before that around August 12th when the difference between the upper and lower was 6.40. Currently the difference is 7.68, but that is still a very tight BB. The move up (guessing up like most people on this forum) is near. But they could be this tight for a while, but the longer the BB “tunnel” the more explosive the move.
If UVXY goes lower over the next few days, and if you can accumulate the June UVXY 25 call for under 2.50, I think that would be a good setup. I’m going to guess that when wave 1 of intermediate 3 starts, UVXY will probably head to 35 or so… Lets see what Verne says about this idea…
Thanks… Keeping an eye on both. I still would rather buy June in the money so that I have until the week before expiration to recover my premium… but I am open to other ideas.
I guess that was no ending diagonal.
Sounds great to me. Paying the extra premium is sure worth not worrying too much about the near term market gyrations. Once the decline gets going, you also have the option of a “backward roll” to snag nearer dated contracts with less premium…
UVXY has made yet another new 52 week low, as expected. Look for BB band compression over the next several days to presage the onset of the next wave down. If it is indeed a third wave down of primary degree as many of us are expecting, UVXY will quickly jump to the top of an exploding BB channel and stay pinned there for quite some time. This is a trading set-up that usually only presents one or twice a year.
Verne,
It was interesting to me that TVIX did not make a new 52 week low yesterday. I was reading that as accumulation. Today, it is making a new lows even thought the SPX is down at the moment. I am sort of drooling over these prices. I will do my best to remain patient.
It is quite remarkable! 🙂
Here is another one on the ongoing policy experiment by the central banks.
http://www.marketwatch.com/story/central-banks-have-it-all-wrong-with-their-focus-on-cutting-interest-rates-2016-04-13
“If central banks continue to use the wrong models, they will continue to do the wrong thing.”
Good Morning All,
Here is another prespective on the market rallies
http://www.marketwatch.com/story/why-this-market-rally-looks-like-a-classic-investor-trap-2016-04-14
Excerpt
“What is clear is that just because the markets did not get hit as expected or the correction is delayed, it is not safe to jump all-in. At the International Institute of Management, our stock-market predictive model flashed a red alert in the second-quarter of 2015, indicating a double-digit decline. If current central bank policies and financial market trends continue, we could see a severe market correction either in 2016 or 2017.”
Agree with Lara, on STOPs, NYSE has been recording declining New Highs and VIX was covered in the commentary from Lara. Last time we had this type of bullishness and divergence was November 2014 and we saw what the markets did. Now they are only that much more overbought and weak on fundamentals…
Lara, Thanks for the stop advice. I’m going to try it out.
No worries. Just done so myself.
I was reading up on gaps this morning and was reminded of this approach from Kirkpatrick and Dhalquist.
hi
Hi Doc…or should I say “whoo hoo!”… ? 😀
yes,, shout it out,, but it is woo hoo, not whoo hoo. (grin)
Does that mean I need to get the “H” out of here?! 🙂