
Charts only today.
WEEKLY ELLIOTT WAVE COUNT
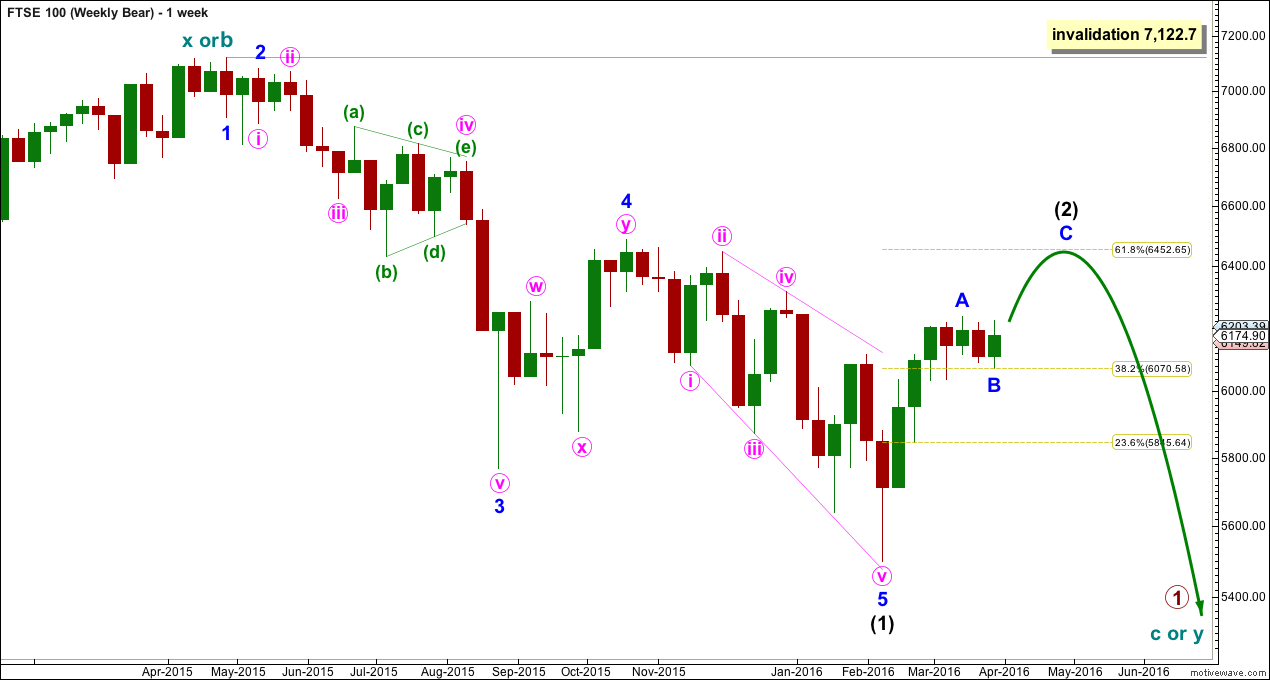
Click chart to enlarge.
DAILY ELLIOTT WAVE COUNT
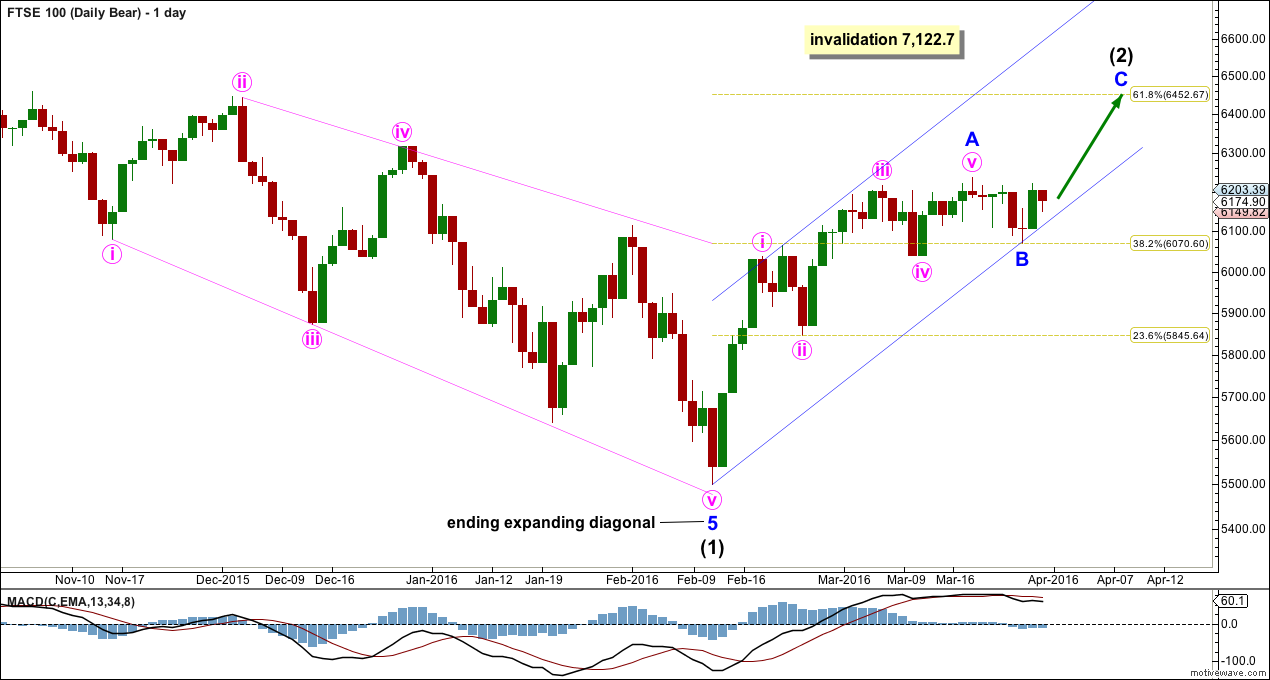
Click chart to enlarge.
Intermediate wave (2) is still most likely to end about the 0.618 Fibonacci ratio at 6,453.
TECHNICAL ANALYSIS
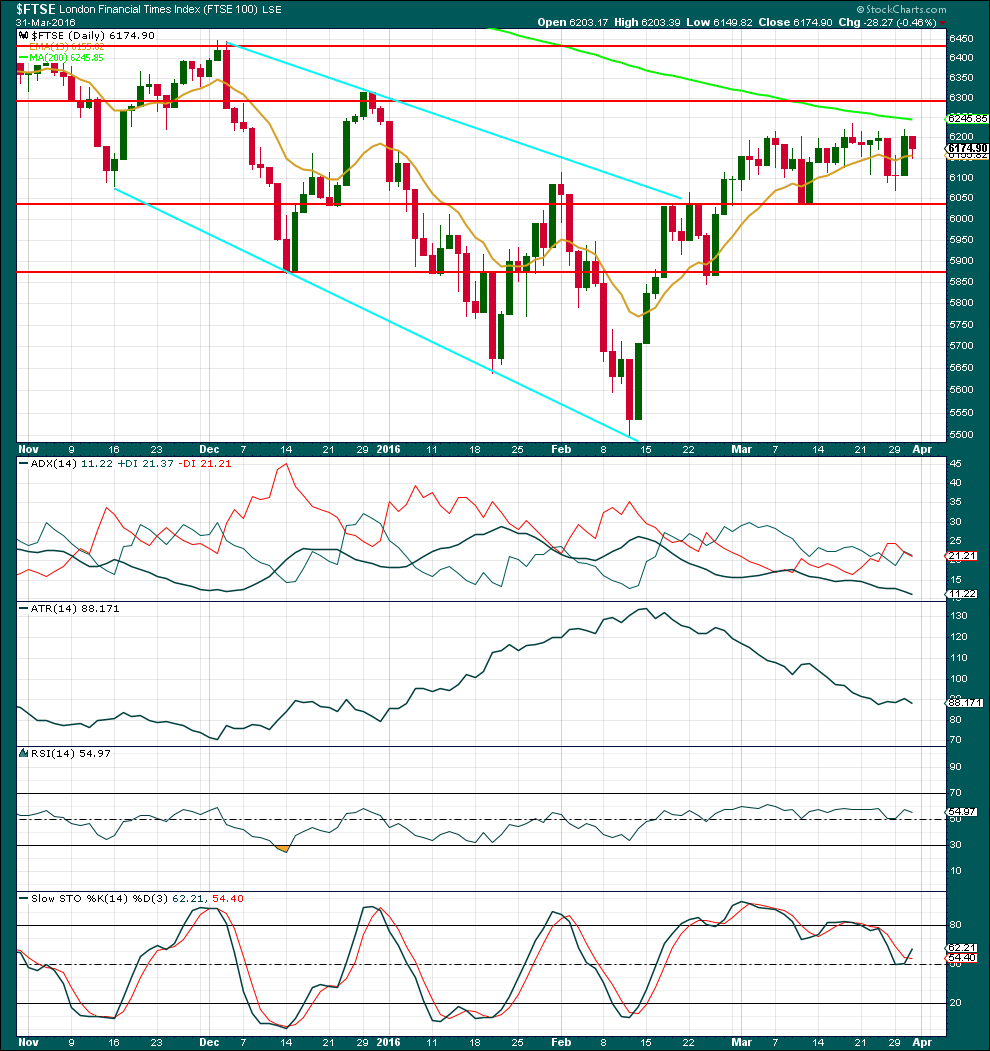
Click chart to enlarge. Chart courtesy of StockCharts.com.
This analysis is published @ 09:16 p.m. EST.