Downwards movement to about 2,035 was expected for Wednesday.
Price moved lower to reach 2,034.86.
Summary: This is still a bear market rally until proven otherwise. Today’s downwards day may have been day one of minor wave 4 which may continue lower / sideways for another two to three days. Thereafter, the upwards trend should resume for a final fifth wave up.
To see last published monthly charts click here.
To see how each of the bull and bear wave counts fit within a larger time frame see the Grand Supercycle Analysis.
To see detail of the bull market from 2009 to the all time high on weekly charts, click here.
New updates to this analysis are in bold.
BEAR ELLIOTT WAVE COUNT
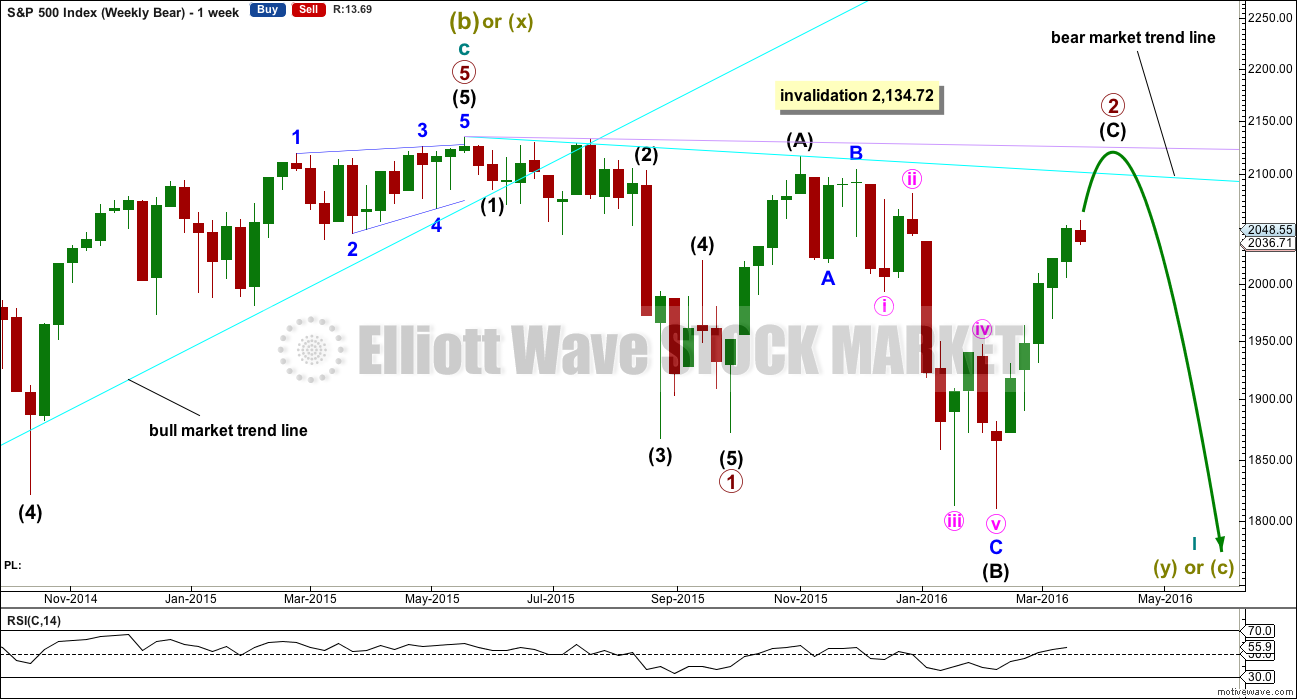
WEEKLY CHART
This bear wave count fits better than the bull with the even larger picture, super cycle analysis found here. It is also well supported by regular technical analysis at the monthly chart level.
Importantly, there is no lower invalidation point for this wave count. That means there is no lower limit to this bear market.
Primary wave 1 may be complete and may have lasted 19 weeks, two short of a Fibonacci 21. So far primary wave 2 is in its 24th week. It looks unlikely to continue for another 10 weeks to total a Fibonacci 34, so it may end in about two to five weeks time. This would still give reasonable proportion between primary waves 1 and 2. Corrections (particularly more time consuming flat corrections) do have a tendency to be longer lasting than impulses.
Primary wave 2 may be unfolding as an expanded or running flat. Within primary wave 2, intermediate wave (A) was a deep zigzag (which will also subdivide as a double zigzag). Intermediate wave (B) fits perfectly as a zigzag and is a 1.21 length of intermediate wave (A). This is within the normal range for a B wave of a flat of 1 to 1.38.
Intermediate wave (C) is likely to make at least a slight new high above the end of intermediate wave (A) at 2,116.48 to avoid a truncation and a very rare running flat. However, price may find very strong resistance at the final bear market trend line. This line may hold price down and it may not be able to avoid a truncation. A rare running flat may occur before a very strong third wave down.
If price moves above 2,116.48, then the new alternate bear wave count would be invalidated. At that stage, if there is no new alternate for the bear, then this would be the only bear wave count.
Primary wave 2 may not move beyond the start of primary wave 1 above 2,134.72.
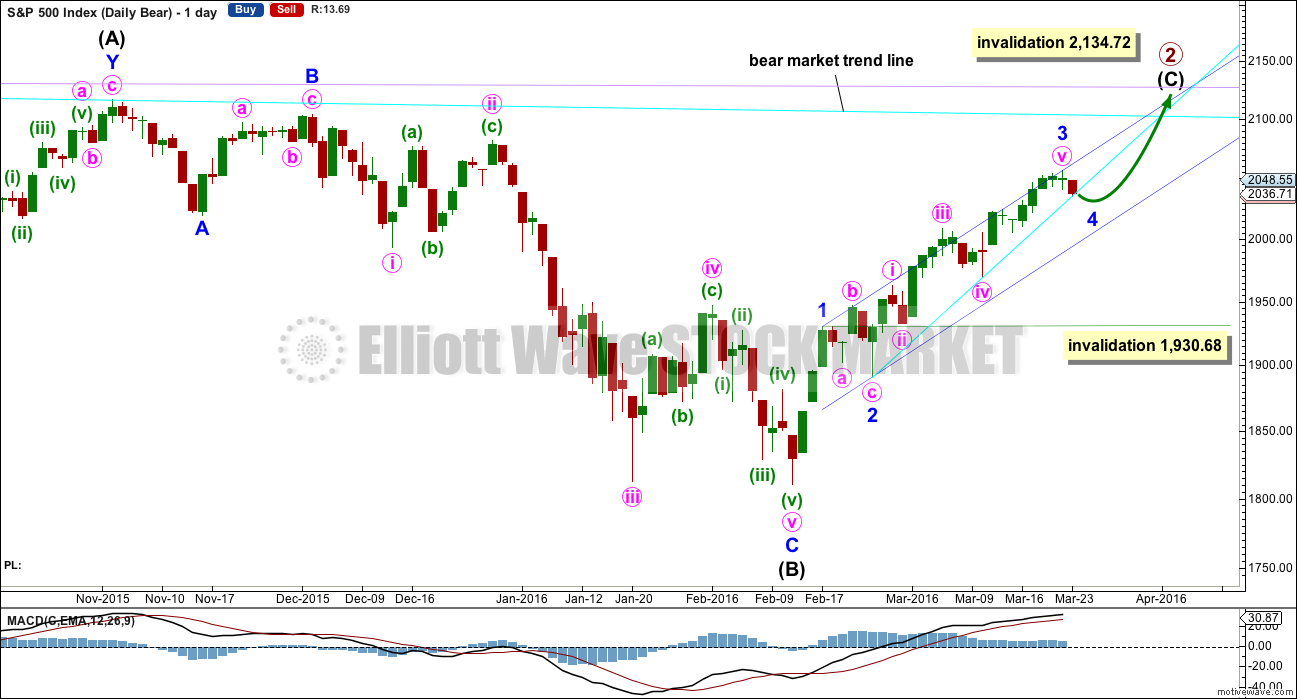
DAILY CHART
Intermediate wave (A) fits as a single or double zigzag.
Intermediate wave (B) fits perfectly as a zigzag. There is no Fibonacci ratio between minor waves A and C.
Intermediate wave (C) must subdivide as a five wave structure. It is not unfolding as an ending diagonal, so it must be unfolding as a more common impulse.
Intermediate wave (C) does not have to move above the end of intermediate wave (A) at 2,116.48, but it is likely to do so to avoid a truncation. If it is truncated and primary wave 2 is a rare running flat, then the truncation is not likely to be very large. As soon as price is very close to 2,116.48 this wave count looks at the possibility of a trend change.
The next wave down for this wave count would be a strong third wave at primary wave degree.
A bull market trend line for this rally is drawn across the first two small swing lows as per the approach outlined by Magee. This upwards sloping cyan line may provide support for corrections along the way up. If price breaks below that cyan line, then look for support at the lower edge of the dark blue Elliott channel.
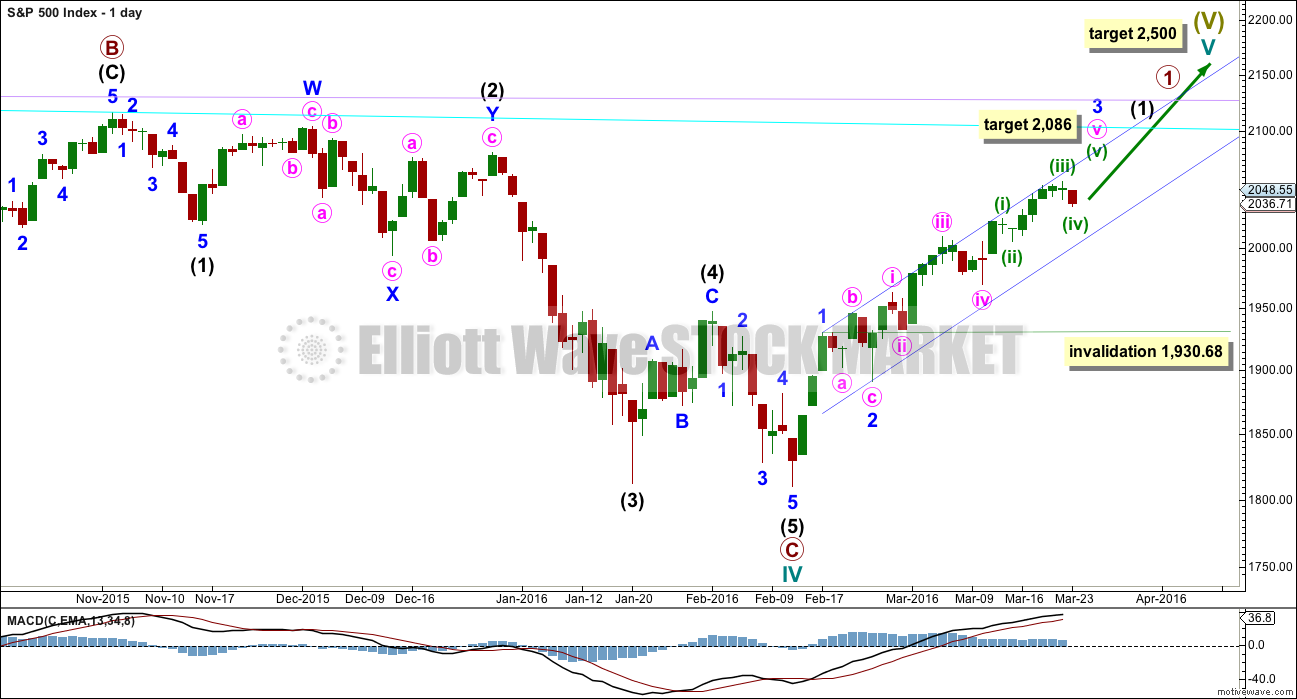
At the daily chart level, I have changed the wave count to see minor wave 3 over. This fits on the hourly chart. There is no Fibonacci ratio between minor waves 3 and 1. This resolves some problems of alternation at the hourly chart level, although it does not have quite as neat a fit at the daily chart level. Both ways (yesterday’s labelling and today’s) are valid ways to label this upwards movement.
Minor wave 4 downwards may not move into minor wave 1 price territory below 1,930.68.
HOURLY CHART
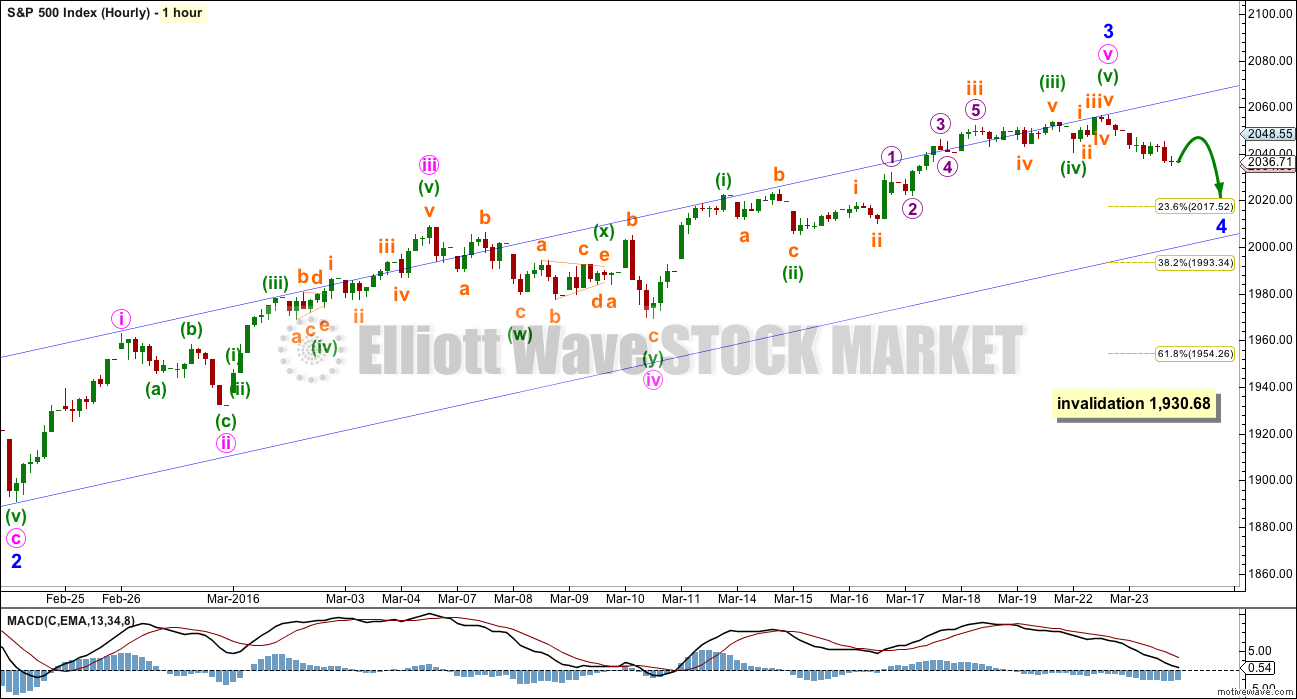
Ratios within minor wave 3 are: minute wave iii is 5.36 points longer than equality in length with minute wave i, and minute wave v has no Fibonacci ratio to either minute waves iii or i. There is alternation between the combination of minute wave iv and the zigzag of minute wave ii.
There are no adequate Fibonacci ratios between minuette waves (i), (iii) and (v) within the extension of minute wave v. There is alternation between the expanded flat of minuette wave (ii) and the zigzag of minuette wave (iv).
Minor wave 2 was a shallow 0.329 expanded flat. Minor wave 4 may be a more shallow zigzag to exhibit alternation. If it is deeper, it may find support at the lower edge of the Elliott channel copied over here from the daily chart.
Minor wave 4 may not move into minor wave 1 price territory below 1,930.68.
ALTERNATE WEEKLY CHART
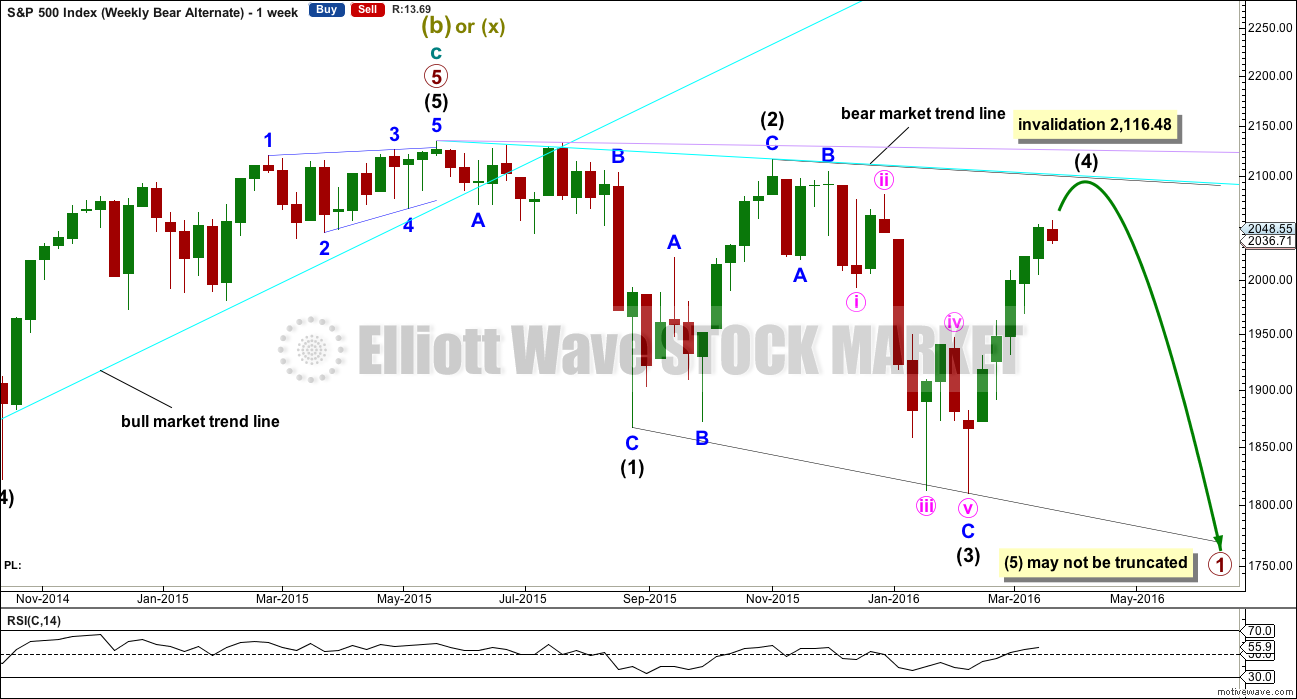
Primary wave 1 may subdivide as one of two possible structures. The main bear count sees it as a complete impulse. This alternate sees it as an incomplete leading diagonal.
The diagonal must be expanding because intermediate wave (3) is longer than intermediate wave (1). Leading expanding diagonals are not common structures, so that reduces the probability of this wave count to an alternate.
Intermediate wave (4) must continue higher and may find resistance at the cyan bear market trend line. Intermediate wave (4) may not move above the end of intermediate wave (2) at 2,116.48.
ALTERNATE DAILY CHART
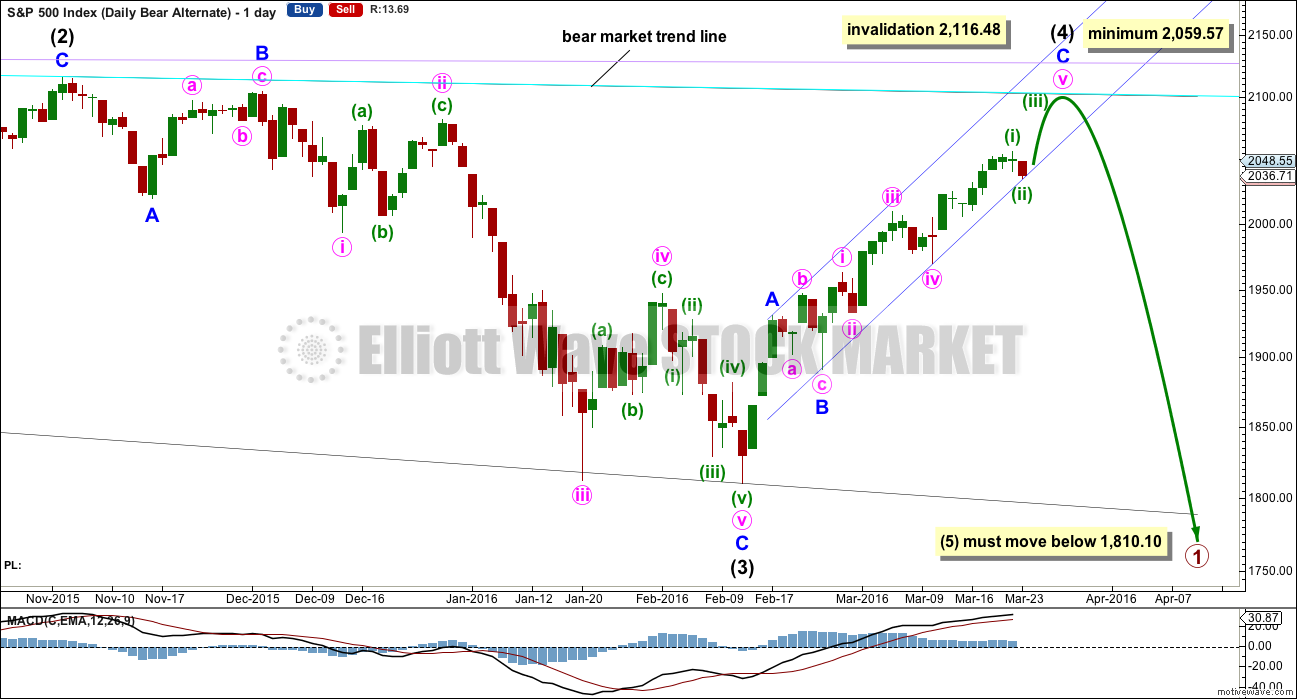
Within a leading diagonal subwaves 2 and 4 must subdivide as zigzags. Subwaves 1, 3 and 5 are most commonly zigzags but may also sometimes appear to be impulses.
Intermediate wave (3) down fits best as a zigzag.
In a diagonal the fourth wave must overlap first wave price territory. The rule for the end of a fourth wave is it may not move beyond the end of the second wave.
Expanding diagonals are not very common. Leading expanding diagonals are less common.
Intermediate wave (4) must be longer than intermediate wave (2), so it must end above 2,059.57. If this minimum is not met, this wave count would be invalid. The trend lines must diverge.
Leading diagonals may not have truncated fifth waves. Intermediate wave (5) would most likely be a zigzag, must end below 1,810.10, and must be longer in length than intermediate wave (3) which was 306.38 points.
BULL ELLIOTT WAVE COUNT
WEEKLY CHART
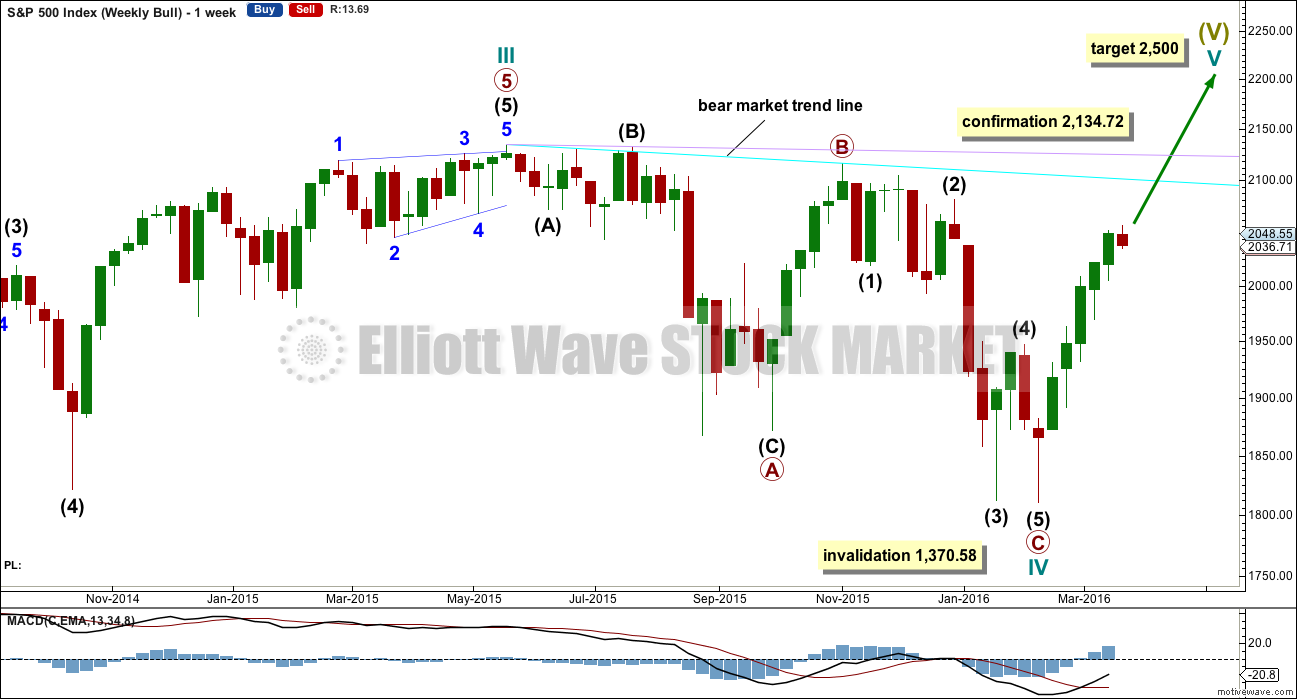
Cycle wave II was a shallow 0.41 zigzag lasting three months. Cycle wave IV may be a complete shallow 0.19 regular flat correction, exhibiting some alternation with cycle wave II.
At 2,500 cycle wave V would reach equality in length with cycle wave I.
Price remains below the final bear market trend line. This line is drawn from the all time high at 2,134.72 to the swing high labelled primary wave B at 2,116.48 on November 2015. This line is drawn using the approach outlined by Magee in the classic “Technical Analysis of Stock Trends”. To use it correctly we should assume that a bear market remains intact until this line is breached by a close of 3% or more of market value. In practice, that price point would be a new all time high which would invalidate any bear wave count.
This wave count requires price confirmation with a new all time high above 2,134.72.
While price has not made a new high, while it remains below the final bear market trend line and while technical indicators point to weakness in upwards movement, this very bullish wave count comes with a strong caveat. I do not have confidence in it.
DAILY CHART
Upwards movement cannot now be a fourth wave correction for intermediate wave (4) as price is now back up in intermediate wave (1) territory above 2,019.39. This has provided some clarity.
For the bullish wave count, it means that primary wave C must be over as a complete five wave impulse.
Intermediate wave (2) is seen as an atypical double zigzag. It is atypical in that it moves sideways. Double zigzags should have a clear slope against the prior trend to have the right look. Within a double zigzag, the second zigzag exists to deepen the correction when the first zigzag does not move price deep enough. Not only does this second zigzag not deepen the correction, it fails to move at all beyond the end of the first zigzag. This structure technically meets rules, but it looks completely wrong. This gives the wave count a low probability.
If the bull market has resumed, it must begin with a five wave structure upwards at the daily and weekly chart level. So far that is incomplete.
At 2,086 minuette wave (v) would reach equality in length with minuette wave (iii). Because with this labelling minuette wave (iii) is slightly shorter than minuette wave (i), this is also a limit for minor wave 4 so that minuette wave (iii) is not the shortest. Also, at 2,086 minor wave 3 would reach 1.618 the length of minor wave 1.
Minor wave 4 may not move into minor wave 1 price territory below 1,930.68.
TECHNICAL ANALYSIS
DAILY CHART
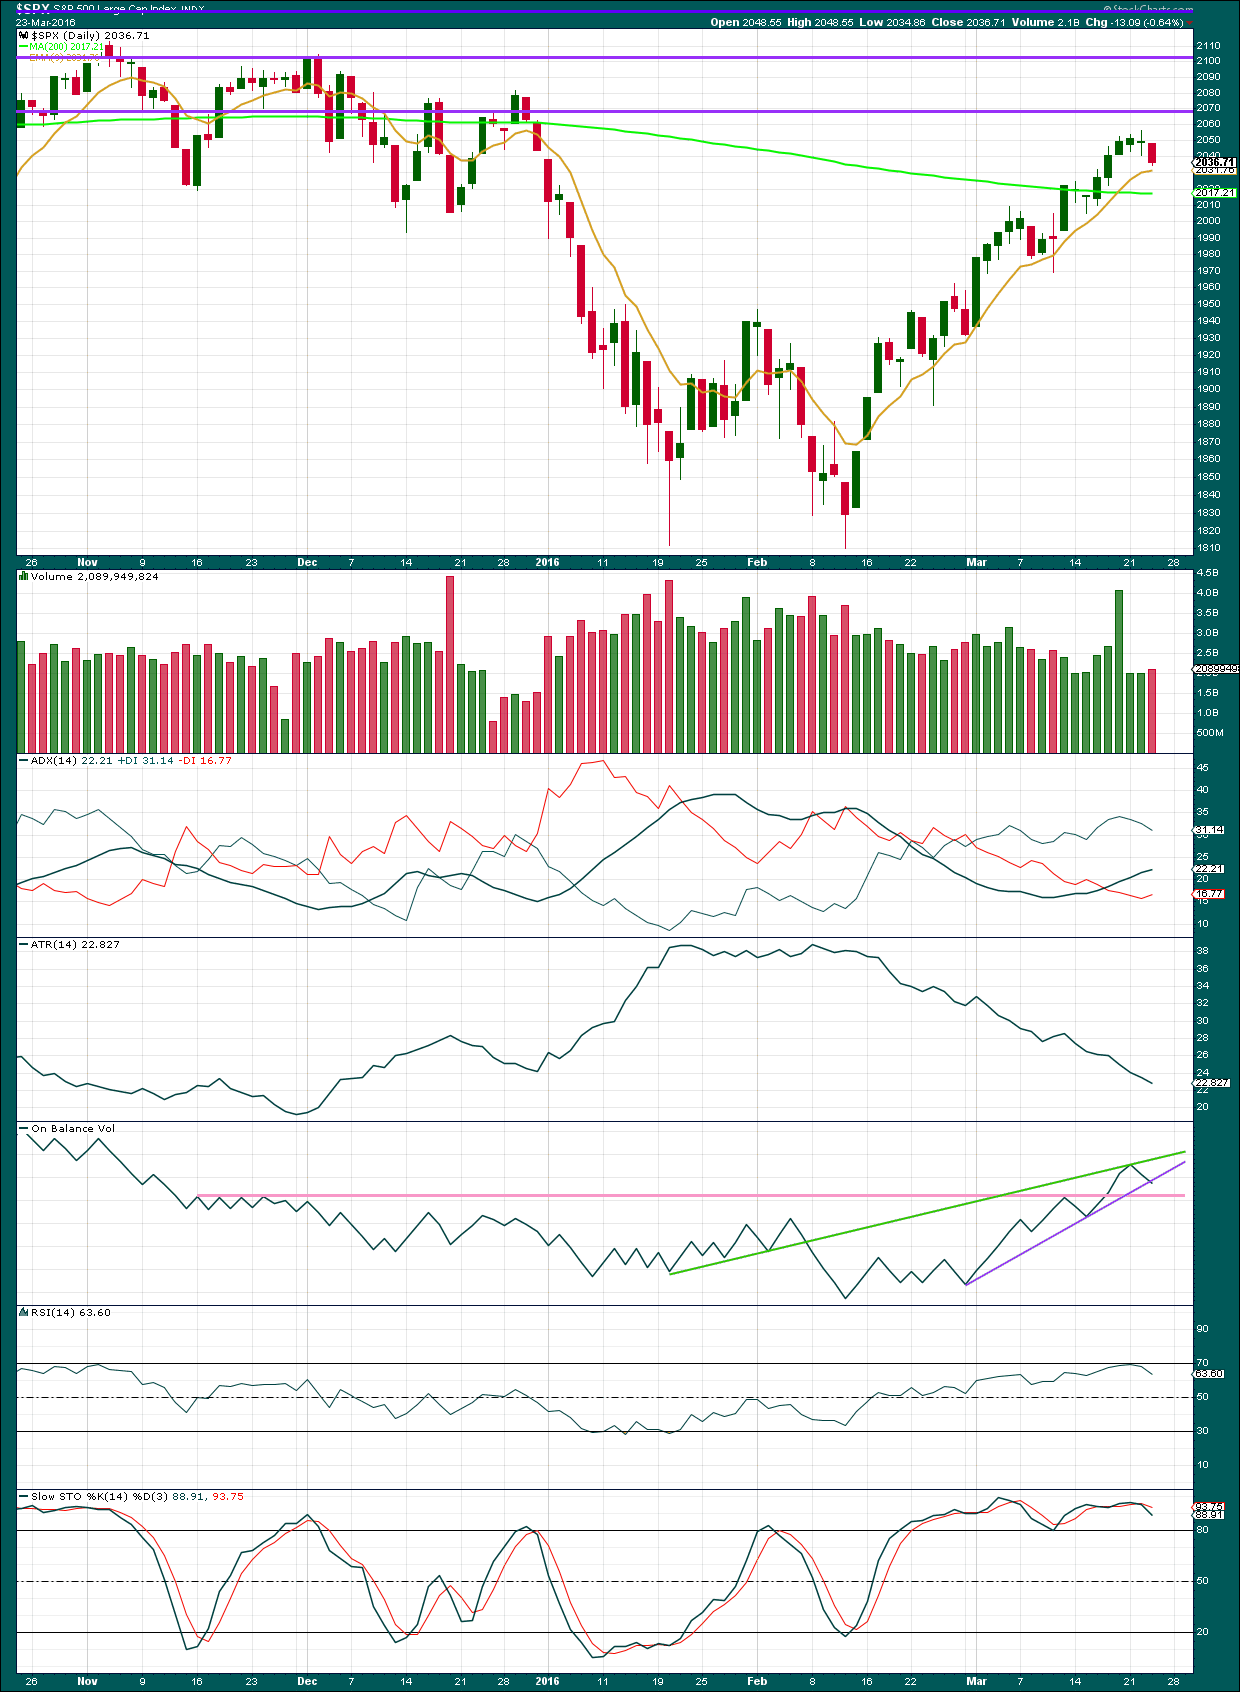
Click chart to enlarge. Chart courtesy of StockCharts.com.
Volume data on StockCharts is different to that given from NYSE, the home of this index. Comments on volume will be based on NYSE volume data when it differs from StockCharts.
NYSE data shows a slight decline in volume for the downwards day of Wednesday. The fall in price is not supported by volume which indicates it may be a counter trend movement, a small correction. This supports the Elliott wave count at least short term.
ADX is increasing indicating the market is trending upwards. Along the way up, price is finding support at the 9 day moving average. This may help to hold up the correction here.
ATR is still declining while price has been moving upwards. There is something wrong with this trend, which supports the Elliott wave count that sees it as a bear market rally.
RSI has not yet reached overbought. There is still room for further rise in price. Stochastics remains overbought, but this oscillator may remain extreme for periods of time during a trending market.
Since the all time high in 20th May, 2015, price has made a series of lower highs and lower lows. Price broke below a long held bull market trend line indicating a new bear market. The 200 day moving average slowly turned from increasing to decreasing. Price remains below the bear market trend line drawn on the Elliott wave charts. All these technical indicators still point to price being in a bear market currently.
If price closes 3% or more of market value above the bear market trend line, then the analysis will change from bearish to bullish. While this has not happened, it should be assumed that the trend remains the same until proven otherwise.
ADVANCE DECLINE LINE
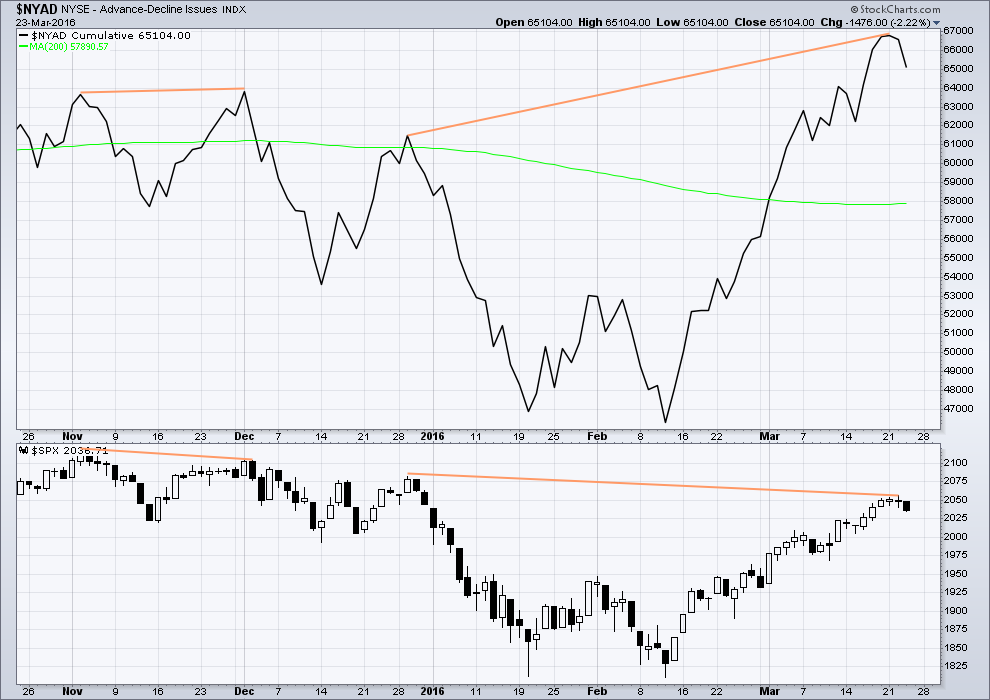
Click chart to enlarge. Chart courtesy of StockCharts.com.
The Advance Decline line shows no short term (day to day basis) divergence with price. With the AD line increasing, this indicates the number of advancing stocks exceeds the number of declining stocks. This indicates that there is breadth to this upwards movement.
Longer term, looking back over the last five months, there are two cases of hidden bearish divergence between price and the AD line.
From November 2015 to December 2015 the AD line made a new high while price failed to make a corresponding high. This indicated weakness in price and preceded new lows for price.
Now again from 29th December, 2015, to now the AD line is making new highs but price has so far failed to also make corresponding new highs. This again is an indication of weakness in price. Despite price rising with market breadth increasing, the breadth increase is not translating to substantial rises in price.
It remains to be seen if price can make new highs beyond the prior highs of 29th December, 2015. If price can manage to do that, then this hidden bearish divergence will no longer be correct, but the fact that it is so strong at this stage is significant. The AD line will be watched daily to see if this bearish divergence continues or disappears.
The 200 day moving average for the AD line is now increasing. Even if the 200 day MA points up this alone would not be enough to indicate a new bull market. During November 2015 the 200 day MA for the AD line turned upwards and yet price still made subsequent new lows.
DOW THEORY
I am choosing to use the S&P500, Dow Industrials, Dow Transportation, Nasdaq and the Russell 2000 index. Major swing lows are noted below. So far the Industrials, Transportation and Russell 2000 have made new major swing lows. None of these indices have made new highs.
I am aware that this approach is extremely conservative. Original Dow Theory has already confirmed a major trend change as both the industrials and transportation indexes have made new major lows.
At this stage, if the S&P500 and Nasdaq also make new major swing lows, then my modified Dow Theory would confirm a major new bear market. At that stage, my only wave count would be the bear wave count.
The lows below are from October 2014. These lows were the last secondary correction within the primary trend which was the bull market from 2009.
These lows must be breached by a daily close below each point.
S&P500: 1,821.61
Nasdaq: 4,117.84
DJIA: 15,855.12 – close below on 25th August 2015.
DJT: 7,700.49 – close below on 24th August 2015.
Russell 2000: 1,343.51 – close below on 25th August 2015.
This analysis is published @ 09:55 p.m. EST.

I can see a complete zigzag down on the hourly and five minute charts for minor wave 4. If it is over here it exhibits perfect alternation with minor 2 and looks reasonably in proportion with minor 2 on the daily chart.
Now the cyan line has been breached if we do see more upwards movement then that line may provide resistance.
The slightly bigger picture: I notice there is a lot of comment today and yesterday that a high may be in place. And so I’m wondering, what if? What if I’m wrong expecting another push up?
We could have a complete zigzag upwards.
The problem I have with this idea is it just does not fit with either of the bear wave counts. This rally must move to 2,059.57 minimum for the alternate to meet the rule for intermediate (4) wave length.
For the main bear intermediate (C) would be so massively truncated, no rules would be broken but for me to consider it over here would be so amateur… I would never publish such a wave count.
And so I’ll have to take some time to see an alternate scenario. So far the only one I can see is the idea I discarded days ago of this being a lower degree second wave correction. The proportions just look bad.
My conclusion so far is the probability of more upwards movement is high.
A new high above 2,038.21 would increase that probability; I see this as the end of wave A within the zigzag of this fourth wave. A new high above that point could not be a small fourth wave correction within an impulse unfolding lower, which means the downwards movement would be confirmed as a complete three wave structure.
Does that make sense?
hi Olga,, makes cents to me too,, thanks for the update posts Lara, really helps .I would have been stewing over it the whole weekend.
I currently have 2038.21 as my first (upper) line in the sand so makes perfect sense to me Lara – many thanks. 2045.39 is my final line (stop) as that would seal the deal imo (invalidate poss 1,2s)
Cheers Olga. Good morning. I thought you were taking a break, sick of watching the paint dry 🙂
she had to sleep off those vodka eye shots,, hee , eye warned her
yes , make cents to me too,, thank you for clarification.
These long lower wicks have recently been a reliable indicator of further upward movement to come so I think the count showing minor four is correct. The gap in UVXY was clearly not a break-away gap so one more push to the upside is in the works. I think it is going to be short and sweet with a true engulfing candle next week on very high volume.
UVXY setting up for run to upper BB. MMs may sell it back to as low as 22 intra-day in the next few trading sessions. No guarantee though. If it closes above 25 today, that window may have passed….
Looks to me like UVXY went up 5 waves and back 3, and its right at the 38% retrace line. I’m adding a couple more calls.
Gap from today’s open filled. Will probably retreat a bit more to around 22 next Monday on final move up. I would be happy to be assigned additional shares if 22 puts in the money at the end of next week but I am not holding my breath. Have an awesome week-end all!
Verne, I see the gap from 2,034.86 to 2,032.48. 2.38 points.
I see the high so far today up to 2,033.61.
So I’m not seeing the gap filled quite yet.
But then my data via BarChart may be different to yours.
And now the gap is filled…
Now to wait to see if price can make it above 2,038.21 when markets open next week.
I was actually looking at the UVXY gap open. You are absolutely right about UVXY and EW, I never try to count the waves as it seems just about impossible to do so reliably. I have a number of other indicators I have come to rely on over the time I have been trading it. It sure is one tricky beast.
Thomas, I’m looking right now at a chart of UVXY on StockCharts, daily going back to 30th Sep 2015.
I’m counting the subdivisions and trying to envisage how / what wave count would fit.
And the conclusion I’m quickly coming to is this market does not have enough volume to exhibit clear Elliott wave structures.
I strongly suspect that it’s threes may look like fives and vice versa, often enough for any EW analysis of it to be unreliable.
I did some time ago do daily EW analysis of AAPL. And after a year or so came to that conclusion. I do not think individual equities have enough volume for reliable EW analysis.
Indicies, yes. Global commodity markets, yes. But not even the most heavily traded equities such as AAPL seem to.
Classic TA of UVXY is massively helpful though. Just probably not EW.
Lara–what about using VXX as it averages more than 2X volume as UVXY ? They both use the same underlying index.
Probably still not high enough.
I notice it is higher than AAPL which I found to not work.
But it is still substantially lower than the indices and global commodity markets. And Forex.
And its chart looks gappy (yes spell check, that is a word!) and thin.
I notice it has lighter volume than GDX which I’ve analysed for a while now, and for GDX I’ve had to conclude volume isn’t high enough for reliable EW analysis.
General info at this hour:
SPX 200 DMA is 2016.94 Today Daily Chart
DJIA 200 DMA is 17130.59 Today Daily Chart
Trend lines both from SPX 1810.10 Low to 2 other lows both broken now… 2nd one by three hourly candle sticks not touching that trend line.
WTI down -1.13 or -2.84%
Brent down -0.85 or -2.10% both back below $40
I don’t trust that trend line for the S&P. It has a nasty habit of breaking lines then continuing on its way in the prior direction, this time up.
Now the cyan line is broken it may provide resistance for upwards movement.
Beware the banksters! The last time we had European futures deep in the red they came in an bought the initial decline with a vengeance trapping folk who went short at the opening. I for one will be selling my short term volatility calls at the open in anticipation of their ambush. If we do get one final wave up as a result, it will be an excellent opportunity to get positioned for the coming slide.
Hey Thomas, you holding on or taking the money and run? I know you wisely went out a few months so don’t have to worry about the short-term gyrations. Knowing these banksters, I like to ring the register early and often! If SPX decisively breaks the 2000 pivot, its a go!!!! Good luck today everyone! 🙂
Hi Verne,
Right now I’m standing pat with UVXY and SPX, but I’ve got puts on some weaker stocks. I follow HYG and IYT because they have been leading to the downside. HYG has now broken out of its corrective channel, gone back to test and looks to be breaking down. IYT is moving down hard but still within its corrective channel.
Its looking an awful lot like we have seen the top, but I’m not going full short until I see 5 clear waves down and a correction.
Sounds good to me! I was looking for UVXY to fill the gap from this morning to reload calls but it is being quite coy. SPX still trying to fill its gap down open.
Trying to get filled selling 22/20 UVXY bullish credit spreads expiring next week. They should net a minimum of a cool 0.35 per contract! 🙂
Hi Lara,
We could have a turn here already as the daily shows a perfect doji followed by a bearish engulfing candle
Nick,
On Tuesday the high of the real body was 2048.64. On Wednesday the high of the real body was 2048.55. Therefore, Wednesday’s real body does not fully engulf Tuesdays. If I am correct, that means Wednesday fails to be a bearish engulfing pattern. But we in fact have a doji on Tuesday with the required follow through on Wednesday.
However, the implications of the pattern still bear (pun intended). The bulls are losing control as the bears are gaining control.
Since I am not a candlestick expert by any measure, please correct me if I have this wrong.
I thought the same as you Rodney, technically we don’t actually have a bearish engulfing candlestick as the real body of 23rd doesn’t engulf the real body of 22nd.
We don’t have an evening doji star either, because the doji is not above the first real body, it is within.
BUT…
I went to Mr Nison’s excellent book and read again his notes on bearish engulfing candlestick patterns. They are the strongest bearish reversal pattern. The concept is sentiment reverses in the second session. For a bearish pattern the bulls are dominant in the first session, and then the second session the bears dominate the entire session and manage to not only move price strongly lower but move it below the open of the first session. It is the lower edge of the second candlestick which I think is most important.
And so applying this logic, if the market opens with a gap lower and then closes lower, below the open of the prior day, even below the entire range of the real body of the prior day, then there has been a significant shift in sentiment from bullish to bearish.
I would judge that to be more bearish than an already very bearish engulfing pattern.
I am not totally sure Mr Nison would agree, as I don’t like to make assumptions. But he may. It makes sense to me.
Beware though. Notice a similar pattern in that the bearish candle closed below the real body of the bullish candle on 23rd February. And that was just a small counter trend movement. Not a reversal.
Also the candle for 8th March.
So we’ve seen this twice before in this upwards trend, and neither of those times was it a reversal.
The daily chart for the main bear count still shows minor three as incomplete.
Can we assume that since minuette two for the alternate bear sits on the bottom of the channel, we should know tomorrow if it’s correct as minuette three would be expected to clear the top of the channel with strong movement…?
I know that SPX tends to misdirect by falling out of channels then climbing back in so that assumption may not be entirely valid.
Sorry Verne, wrong chart.
Fixed now.
The first daily chart should see minor 3 complete.
I expect it to break below the cyan line then to continue up finding resistance there.
More weakness.
Thanks, Lara!
hi
You are fast!
runner up in the Olympics