Summary: FTSE remains in a bear market: lower highs, lower lows, 200 day moving average still pointing lower, and price below the bear market trend line.
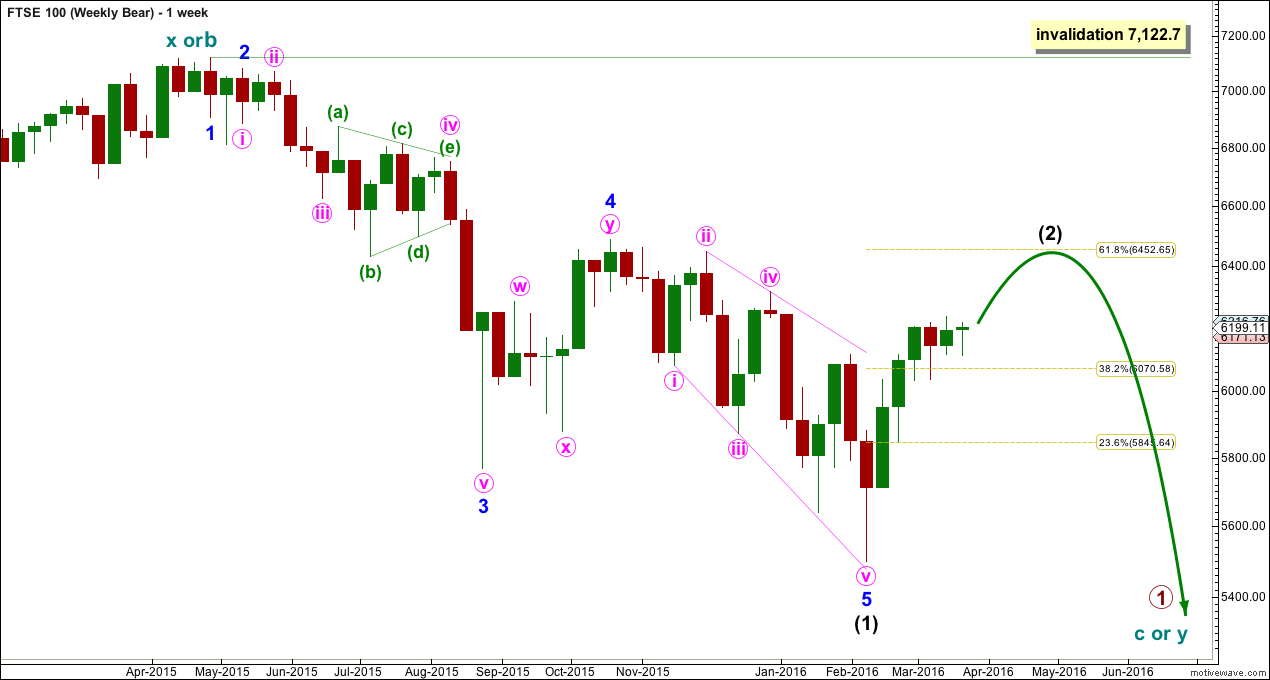
WEEKLY ELLIOTT WAVE COUNT
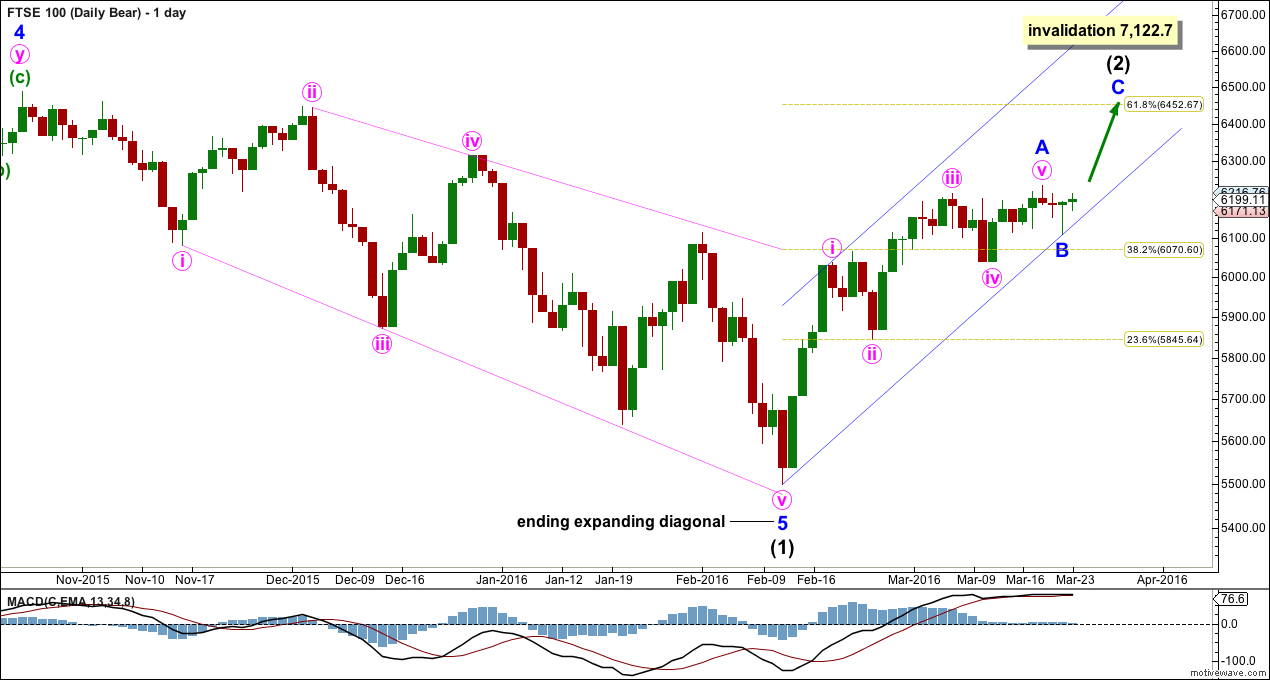
DAILY ELLIOTT WAVE COUNT
The structure of intermediate wave (2) still needs at least one more small final wave up to complete a corrective count of seven.
Redraw the channel if minor wave B moves lower. After a new high a subsequent break below the lower edge of the channel would indicate a trend change.
Intermediate wave (2) is still most likely to end about the 0.618 Fibonacci ratio at 6,453.
TECHNICAL ANALYSIS

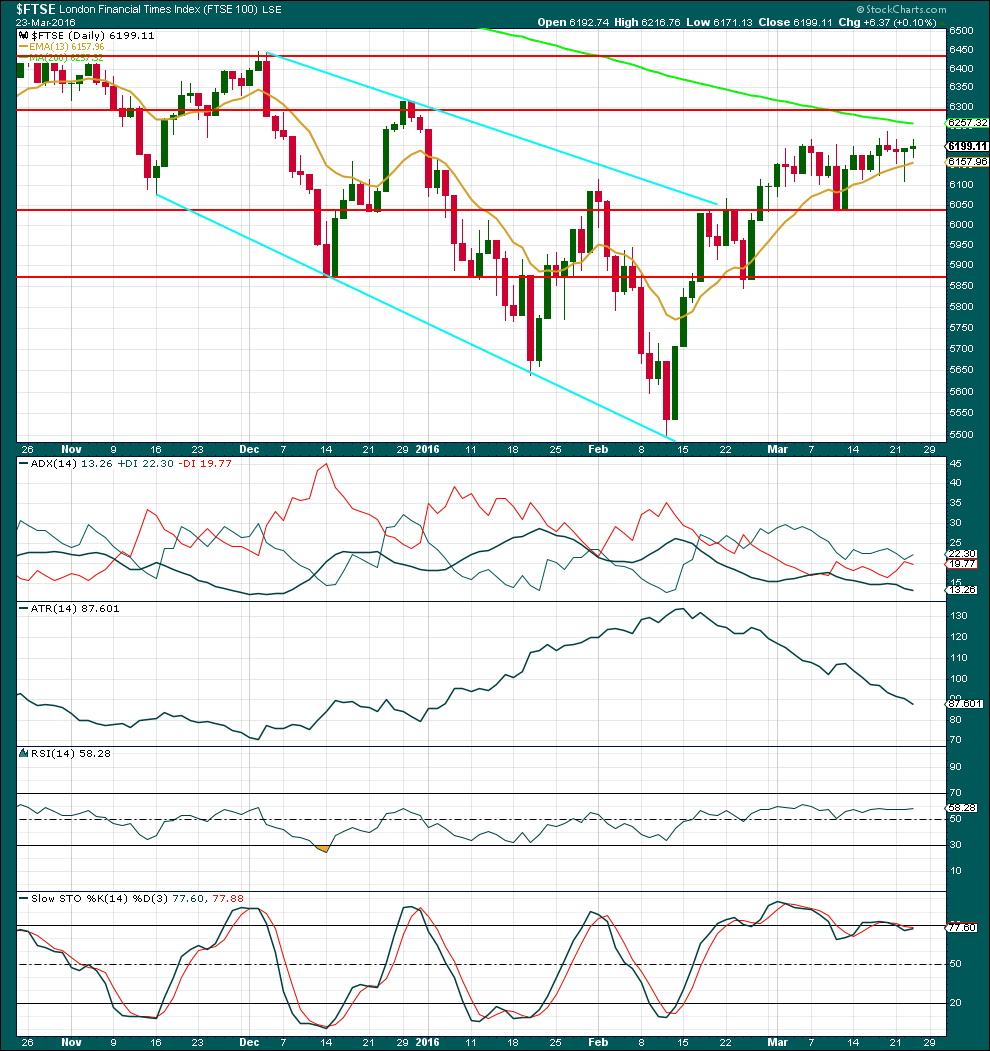
Click chart to enlarge. Chart courtesy of StockCharts.com.
Comments on volume use data from Yahoo Finance as StockCharts do not provide volume data for FTSE.
Downwards days continue to be stronger than upwards days for FTSE. The volume profile is still more bearish than bullish.
As price moves essentially sideways, volume is overall slightly declining. Price may find some resistance at the 200 day moving average.
Price is range bound between the 200 day average and the red horizontal support line at 6,035. A breakout above or below on a day with increased volume is required before the next trend direction can be known for FTSE. Volume favours a downwards breakout which supports the Elliot wave count.
RSI is not yet extreme. There is room for price to rise.
This analysis is published @ 11:03 p.m. EST.


I’m on a roll
It’s a hat-trick!