A slight new high fits the bull and alternate bear Elliott wave counts best.
The situation short term is slightly clearer. There will only be one bear Elliott wave count now.
Summary: This is still a bear market rally until proven otherwise. The target remains at 2,126. In the short term, a new high tomorrow above 2,032.59 would indicate a fifth wave up is underway. A new low below 2,019.06 is expected and would indicate more sideways movement for a further two days before the short term upwards trend resumes.
To see last published monthly charts click here.
To see how each of the bull and bear wave counts fit within a larger time frame see the Grand Supercycle Analysis.
To see detail of the bull market from 2009 to the all time high on weekly charts, click here.
I have published the bull market wave counts first for a long time, waiting for S&P and Nasdaq to confirm my modified Dow Theory before calling a bear market. Due to a lack of confidence in bull wave counts at this stage, I will stop doing that. The bear wave count will be published first. The bull wave count will continue to be published until it is invalidated by price.
New updates to this analysis are in bold.
BEAR ELLIOTT WAVE COUNT
MONTHLY CHART
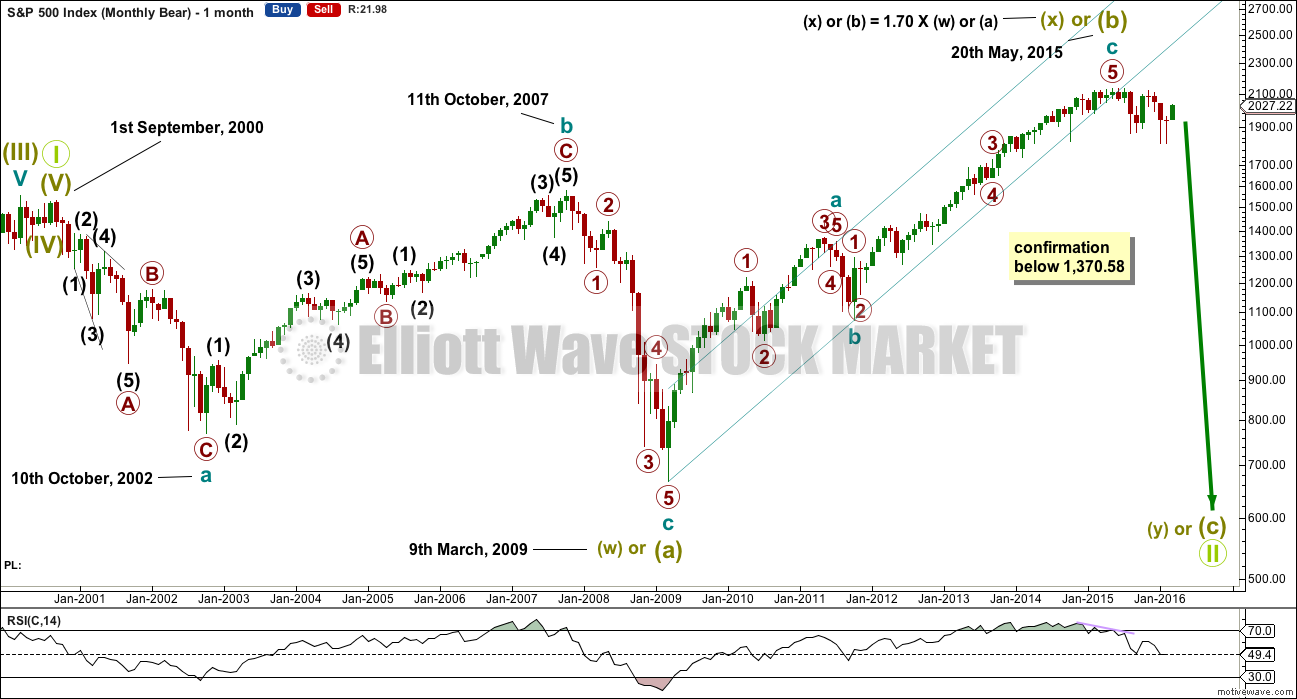
What if the big flat correction labelled super cycle wave (w) or (a) was only the first three in a larger correction?
This bear wave count fits better than the bull with the even larger picture, super cycle analysis found here. It is also well supported by regular technical analysis at the monthly chart level.
There are two ideas presented in this chart: a huge flat correction or a double flat / double combination. The huge flat is more likely. They more commonly have deep B waves than combinations have deep X waves (in my experience).
A huge flat correction would be labelled super cycle (a)-(b)-(c). It now expects a huge super cycle wave (c) to move substantially below the end of (a) at 666.79. C waves can behave like third waves. This idea expects a devastating bear market, and a huge crash to be much bigger than the last two bear markets on this chart.
The second idea is a combination which would be labelled super cycle (w)-(x)-(y). The second structure for super cycle wave (y) would be a huge sideways repeat of super cycle wave (a) for a double flat, or a quicker zigzag for a double combination. It is also possible (least likely) that price could drift sideways in big movements for over 10 years for a huge triangle for super cycle wave (y).
Importantly, there is no lower invalidation point for this wave count. That means there is no lower limit to this bear market.
WEEKLY CHART
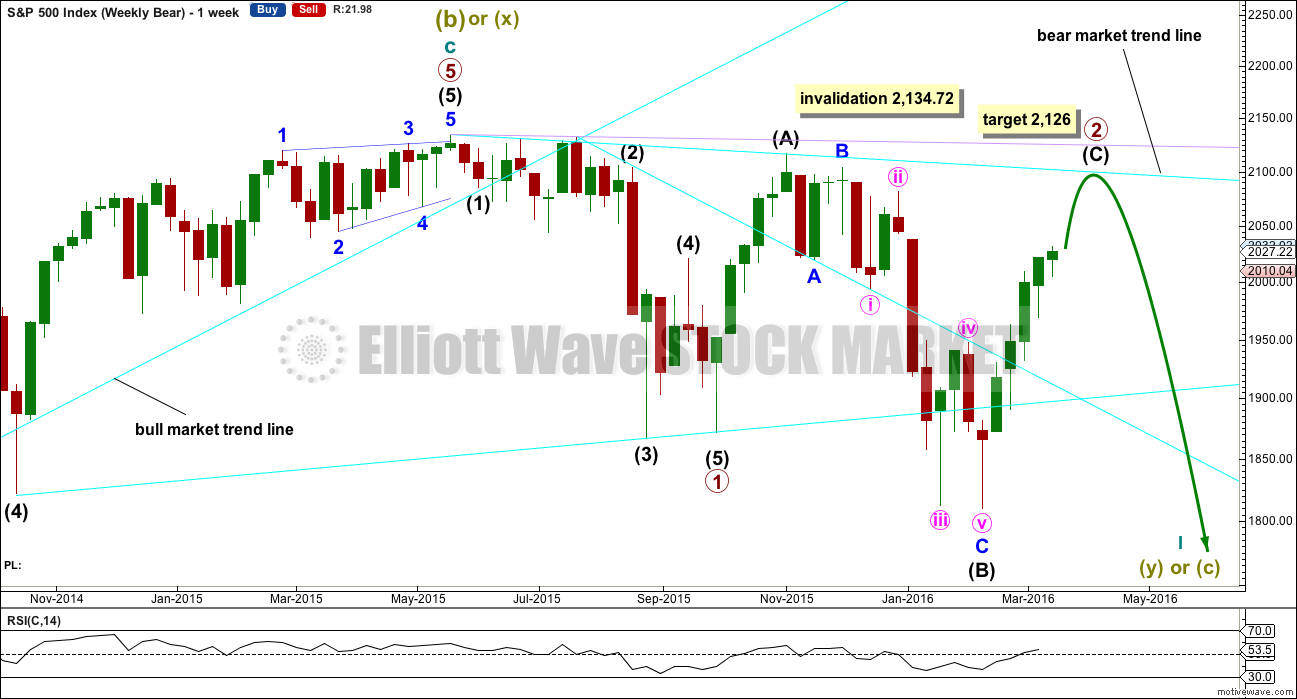
Primary wave 1 may be complete and may have lasted 19 weeks, two short of a Fibonacci 21. So far primary wave 2 is in its 23rd week. It looks unlikely to continue for another 11 weeks to total a Fibonacci 34, so it may end in about two to five weeks time. This would still give reasonable proportion between primary waves 1 and 2. Corrections (particularly more time consuming flat corrections) do have a tendency to be longer lasting than impulses.
Primary wave 2 may be unfolding as an expanded or running flat. Within primary wave 2, intermediate wave (A) was a deep zigzag (which will also subdivide as a double zigzag). Intermediate wave (B) fits perfectly as a zigzag and is a 1.21 length of intermediate wave (A). This is within the normal range for a B wave of a flat of 1 to 1.38.
Intermediate wave (C) is likely to make at least a slight new high above the end of intermediate wave (A) at 2,116.48 to avoid a truncation and a very rare running flat. However, price may find very strong resistance at the final bear market trend line. This line may hold price down and it may not be able to avoid a truncation. A rare running flat may occur before a very strong third wave down.
Primary wave 2 may not move beyond the start of primary wave 1 above 2,134.72.
Only one bear wave count will be published today. The prior main bear wave count now has a big problem with proportions and no longer has the right look. It is discarded.
DAILY CHART
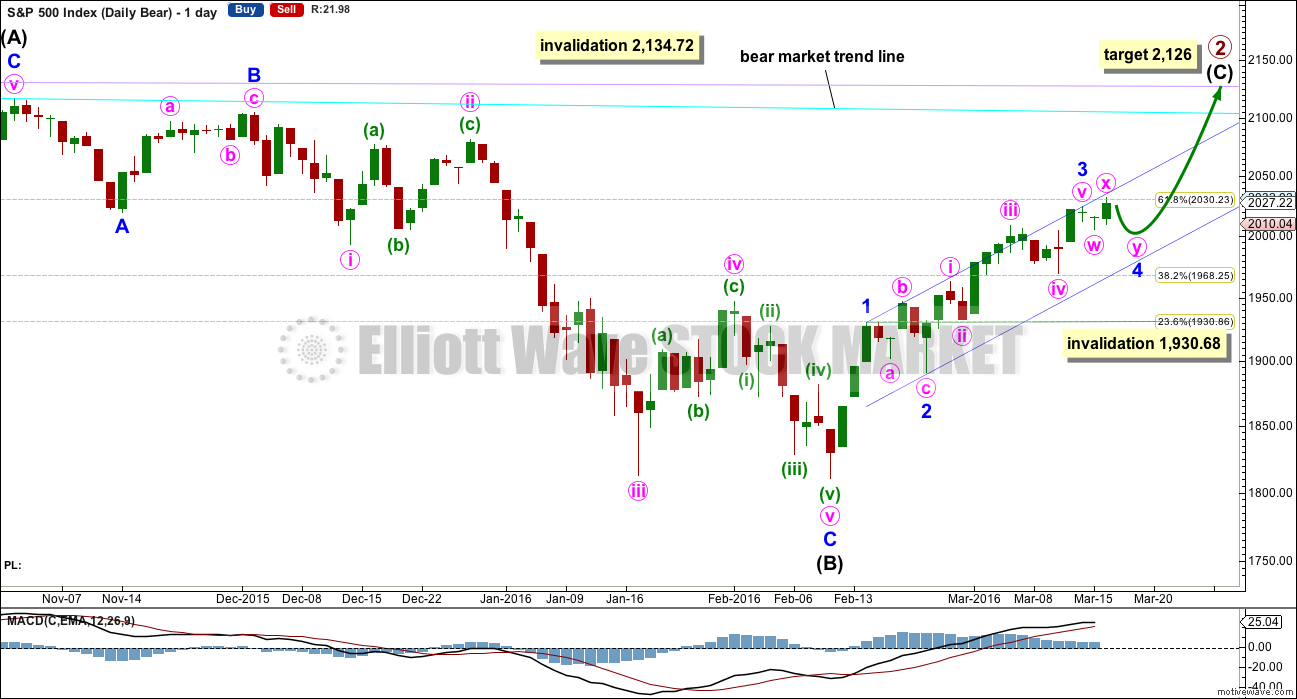
Intermediate wave (A) fits nicely as a single or double zigzag.
Intermediate wave (B) fits perfectly as a zigzag. There is no Fibonacci ratio between minor waves A and C.
Intermediate wave (C) must subdivide as a five wave structure. It is not unfolding as an ending diagonal, so it must be unfolding as a more common impulse.
The short / mid term target for minor wave 3 is exactly the same as the short / mid term target for the bull wave count. A-B-C of a zigzag and 1-2-3 of an impulse both subdivide 5-3-5. The labelling within this upwards movement of each subdivision is the same for both wave counts.
Price is approaching the 0.618 Fibonacci ratio at 2,030. It may find some resistance there.
Minor wave 4 downwards may not move into minor wave 1 price territory below 1,930.68.
Intermediate wave (C) does not have to move above the end of intermediate wave (A) at 2,116.48, but it is likely to do so to avoid a truncation. If it is truncated and primary wave 2 is a rare running flat, then the truncation is not likely to be very large. As soon as price is very close to 2,116.48 this wave count looks at the possibility of a trend change.
The next wave down for this wave count would be a strong third wave at primary wave degree.
At 2,126 minor wave 5 would be about equal in length with minor wave 4. This target may be recalculated as minor wave 4 continues sideways, so the target may change. The target is given as an indication only, would see price find resistance at either the cyan or lilac lines, and would see intermediate wave (C) avoid a truncation.
HOURLY CHART
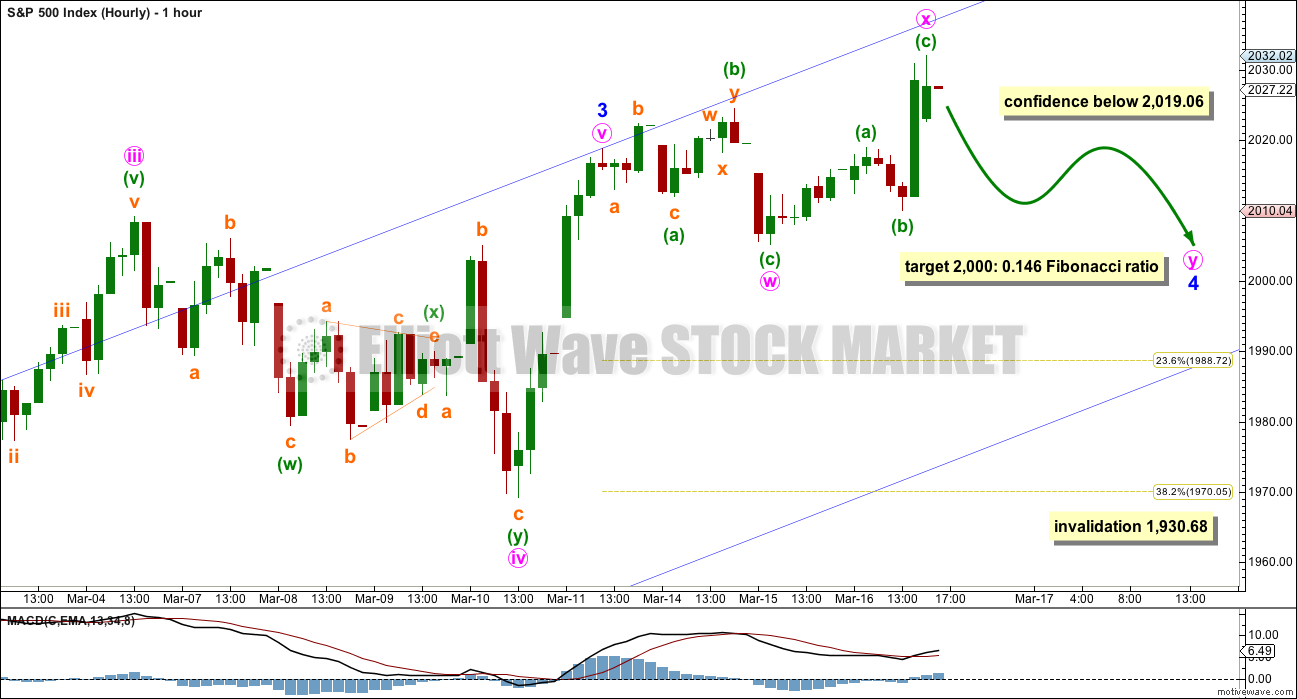
Minor wave 4 is most likely to continue sideways to last longer and be better in proportion with minor wave 2.
Minor wave 2 lasted a Fibonacci five days and was a shallow 0.329 expanded flat. Given the guideline of alternation, minor wave 4 may be either a combination as labelled or a triangle.
It is likely to be more shallow than minor wave 2, so that it ends within the price territory of the fourth wave of one lesser degree. Minute wave iv has its range from 2,009.13 to 1,969.25. Both the 0.236 and 0.382 Fibonacci ratios of minor wave 3 lie within this range. The 0.146 Fibonacci ratio (not shown, MotiveWave does not have this option) is at 2,000 exactly, also within the range. This is the target for minor wave 4 to end.
Overall more sideways movement in a consolidation would be expected for a further two days most likely, with an upwards breakout when it is done. Confidence may be had in this short term outlook with a new low below 2,019.06. At that stage, the alternate below would be invalidated.
If price keeps rising tomorrow above 2,032.59, then minute wave x would be over twice the length of minute wave w. This would reduce the probability of this main hourly wave count in favour of the alternate below.
ALTERNATE HOURLY CHART
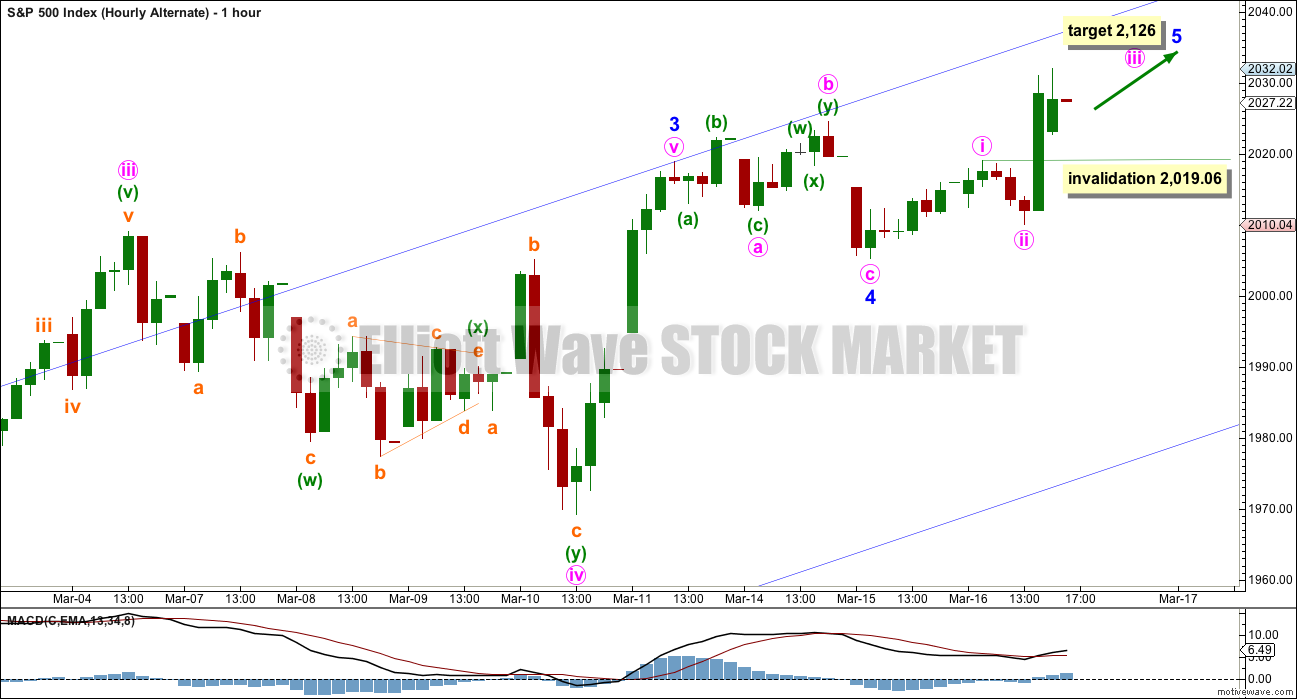
If minor wave 4 is over already, there is inadequate alternation with minor wave 2. Both would be expanded flat corrections. Minor wave 2 would be deeper at 0.329 and minor wave 4 would be very shallow at 0.107.
Minor wave 2 would have lasted a Fibonacci five days and minor wave 4 would have lasted only one day. The proportions do not look right on the daily chart.
If price rises above 2,032.59 tomorrow, then this alternate may be correct. The main wave count would remain valid but would reduce in probability in favour of this alternate.
Minor wave 5 should then be expected to be fairly likely to be underway.
Within minor wave 5, minute wave iv may not move into minute wave 1 price territory below 2,019.06.
BULL ELLIOTT WAVE COUNT
MONTHLY CHART
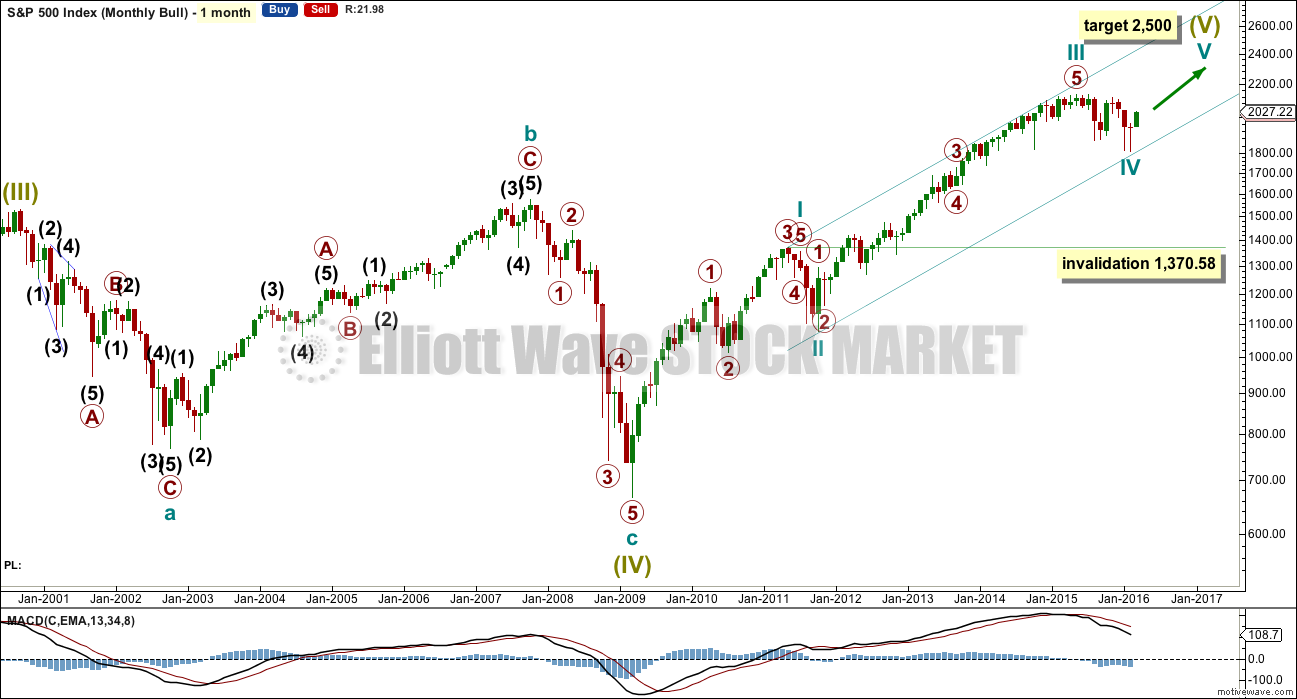
This wave count is bullish at Super Cycle degree.
The two big bear markets of 2000 – 2002 and 2007 – 2009 may have been waves A and C within a large flat correction for a Super Cycle wave IV. The bull market since 2009 may be Super Cycle wave V.
Cycle waves I, II and III are complete within Super Cycle wave V. Cycle wave II was a relatively shallow 0.41 zigzag lasting 12 weeks. Cycle wave III is 55.97 points short of 1.618 the length of cycle wave I. This is a reasonable difference, but as it is less than 10% the length of cycle wave III (it is 5.2%) I consider this an acceptable Fibonacci ratio.
Draw a best fit channel about this bull market as shown. Cycle wave IV may have ended just short of support at the lower edge.
If it continues any further, cycle wave IV may not move into cycle wave I price territory below 1,370.58. If this bull wave count is invalidated by downwards movement, then the bear wave count shall be fully confirmed.
Cycle wave III shows an increase in upwards momentum beyond cycle wave I.
Cycle wave II was a shallow 0.41 zigzag lasting three months. Cycle wave IV may be a complete shallow 0.19 regular flat correction, exhibiting some alternation with cycle wave II.
At 2,500 cycle wave V would reach equality in length with cycle wave I.
WEEKLY CHART
Cycle wave II was a shallow 0.41 zigzag lasting three months. Cycle wave IV may be a complete shallow 0.19 regular flat correction, exhibiting some alternation with cycle wave II.
At 2,500 cycle wave V would reach equality in length with cycle wave I.
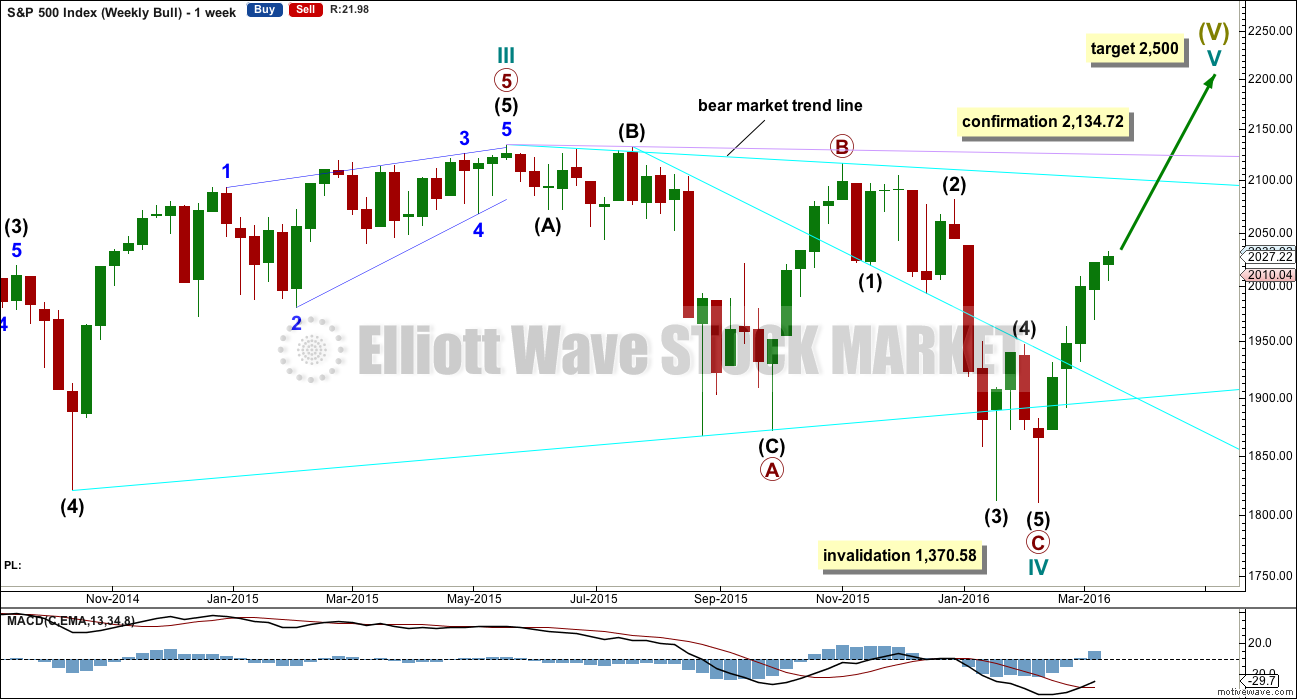
Price remains below the final bear market trend line. This line is drawn from the all time high at 2,134.72 to the swing high labelled primary wave B at 2,116.48 on November 2015. This line is drawn using the approach outlined by Magee in the classic “Technical Analysis of Stock Trends”. To use it correctly we should assume that a bear market remains intact until this line is breached by a close of 3% or more of market value. In practice, that price point would be a new all time high which would invalidate any bear wave count.
This wave count requires price confirmation with a new all time high above 2,134.72.
While price has not made a new high, while it remains below the final bear market trend line and while technical indicators point to weakness in upwards movement, this very bullish wave count comes with a strong caveat. I do not have confidence in it.
DAILY CHART
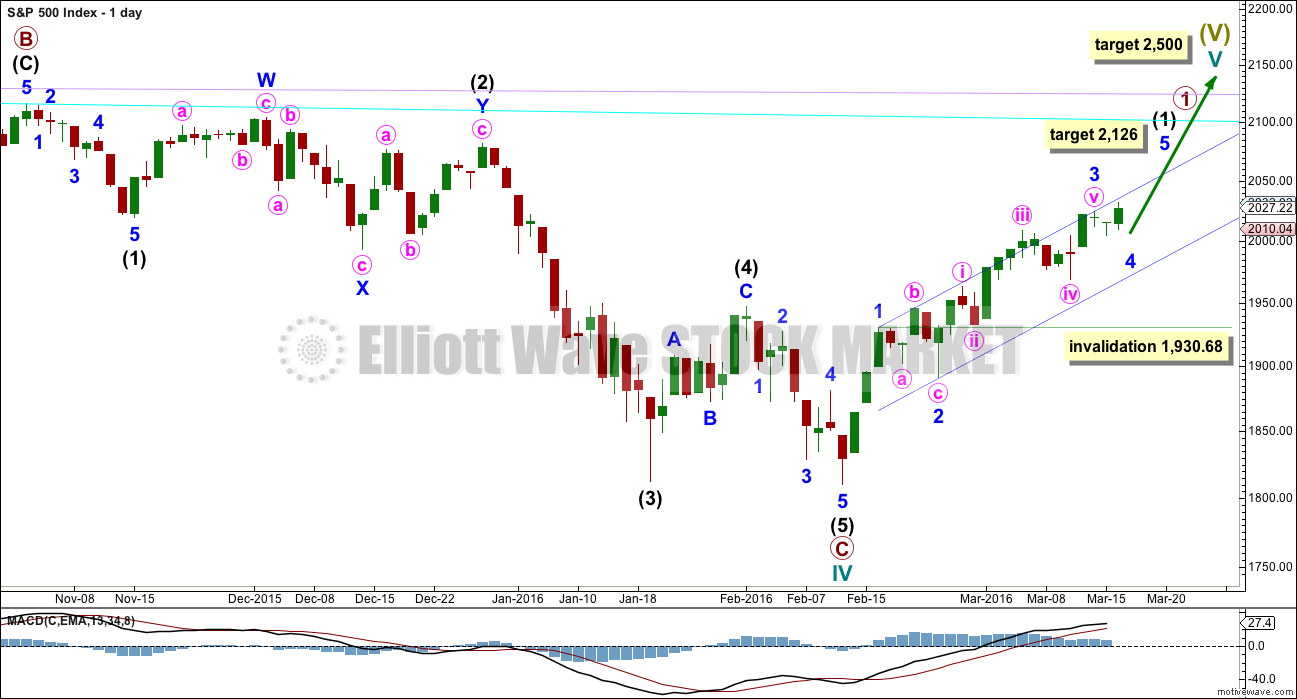
Upwards movement cannot now be a fourth wave correction for intermediate wave (4) as price is now back up in intermediate wave (1) territory above 2,019.39. This has provided some clarity.
For the bullish wave count, it means that primary wave C must be over as a complete five wave impulse.
Intermediate wave (2) is seen as an atypical double zigzag. It is atypical in that it moves sideways. Double zigzags should have a clear slope against the prior trend to have the right look. Within a double zigzag, the second zigzag exists to deepen the correction when the first zigzag does not move price deep enough. Not only does this second zigzag not deepen the correction, it fails to move at all beyond the end of the first zigzag. This structure technically meets rules, but it looks completely wrong. This gives the wave count a low probability.
If the bull market has resumed, it must begin with a five wave structure upwards at the daily and weekly chart level. So far that is incomplete.
At 2,088 minor wave 3 would reach 1.618 the length of minor wave 1. Within minor wave 3, at 2,086 minute wave v would reach 1.618 the length of minute wave iii. This gives a two point target zone calculated at two wave degrees which should have a reasonable probability.
Minor wave 4 may not move into minor wave 1 price territory below 1,930.68.
TECHNICAL ANALYSIS
MONTHLY CHART
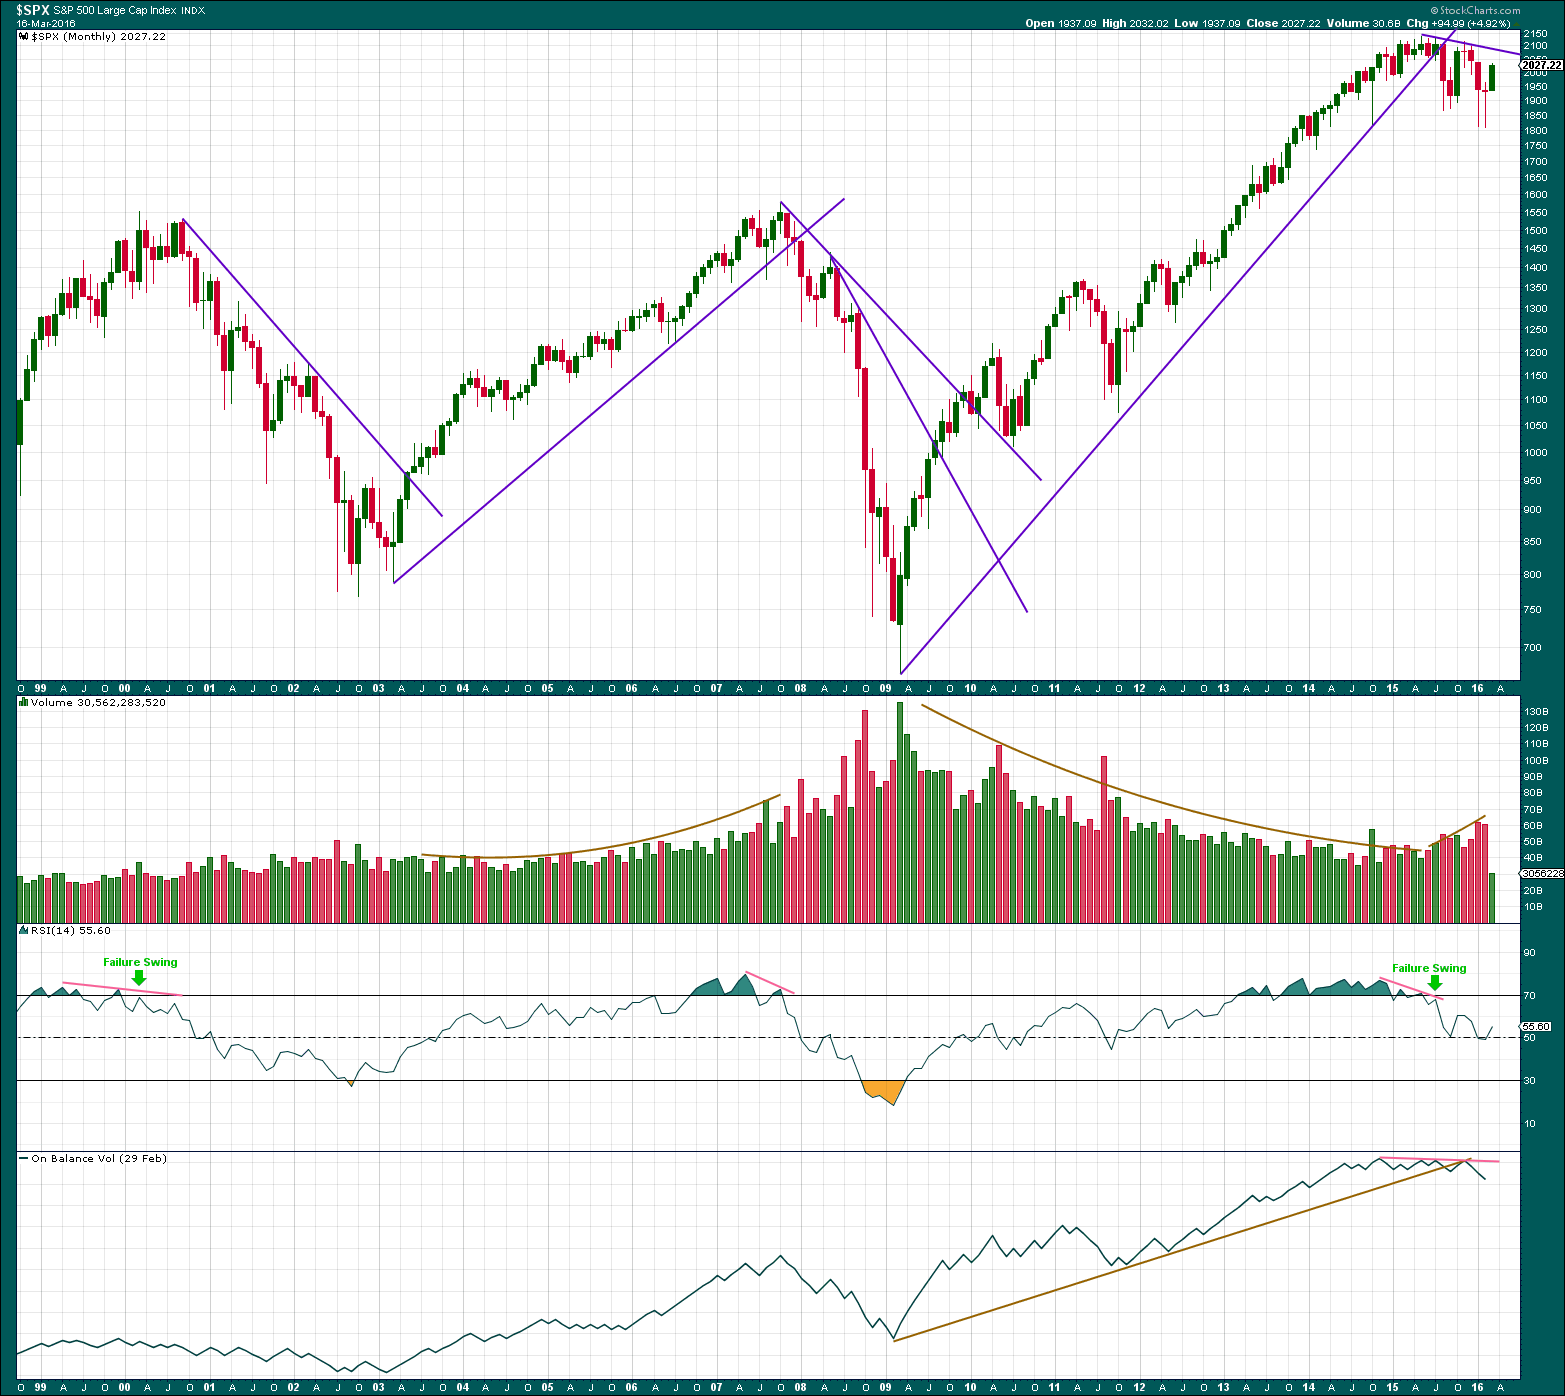
Click chart to enlarge. Chart courtesy of StockCharts.com.
The long trend line on price is drawn from the low of March 2009, at 666.79 to the low in October 2011. This trend line was repeatedly tested, breached, and then provided resistance in August 2015. Price has closed well over 3% of market value below it. Trend lines like this one which are reasonably shallow, long held and repeatedly tested are highly technically significant. The breach tells us the market has switched from bull to bear. This supports the bear wave count over the bull.
Volume has overall declined during the bull market spanning over 6 years. The rise in price was not supported by volume at the monthly chart level. This also supports the bear wave count over the bull.
RSI shows double negative divergence with price as the final highs were made. Finally, a failure swing on RSI completes a pattern which was last seen in September 2000. This pattern indicates a bear market may begin from here and supports the bear wave count over the bull.
On Balance Volume also shows divergence with price (pink line) as the final highs were made. On Balance Volume has breached a very long held trend line (brown). This is further support for the bear wave count over the bull.
Since the all time high in May 2015, downwards movement is coming with an increase in volume at the monthly chart level. This further supports the bear wave count over the bull.
Not only is there nothing bullish about this picture at the monthly chart level, it is very bearish indeed. It indicates that recent downwards movement is more likely to be the start of a large bear market than it is to be another correction within a continuing bull market.
DAILY CHART
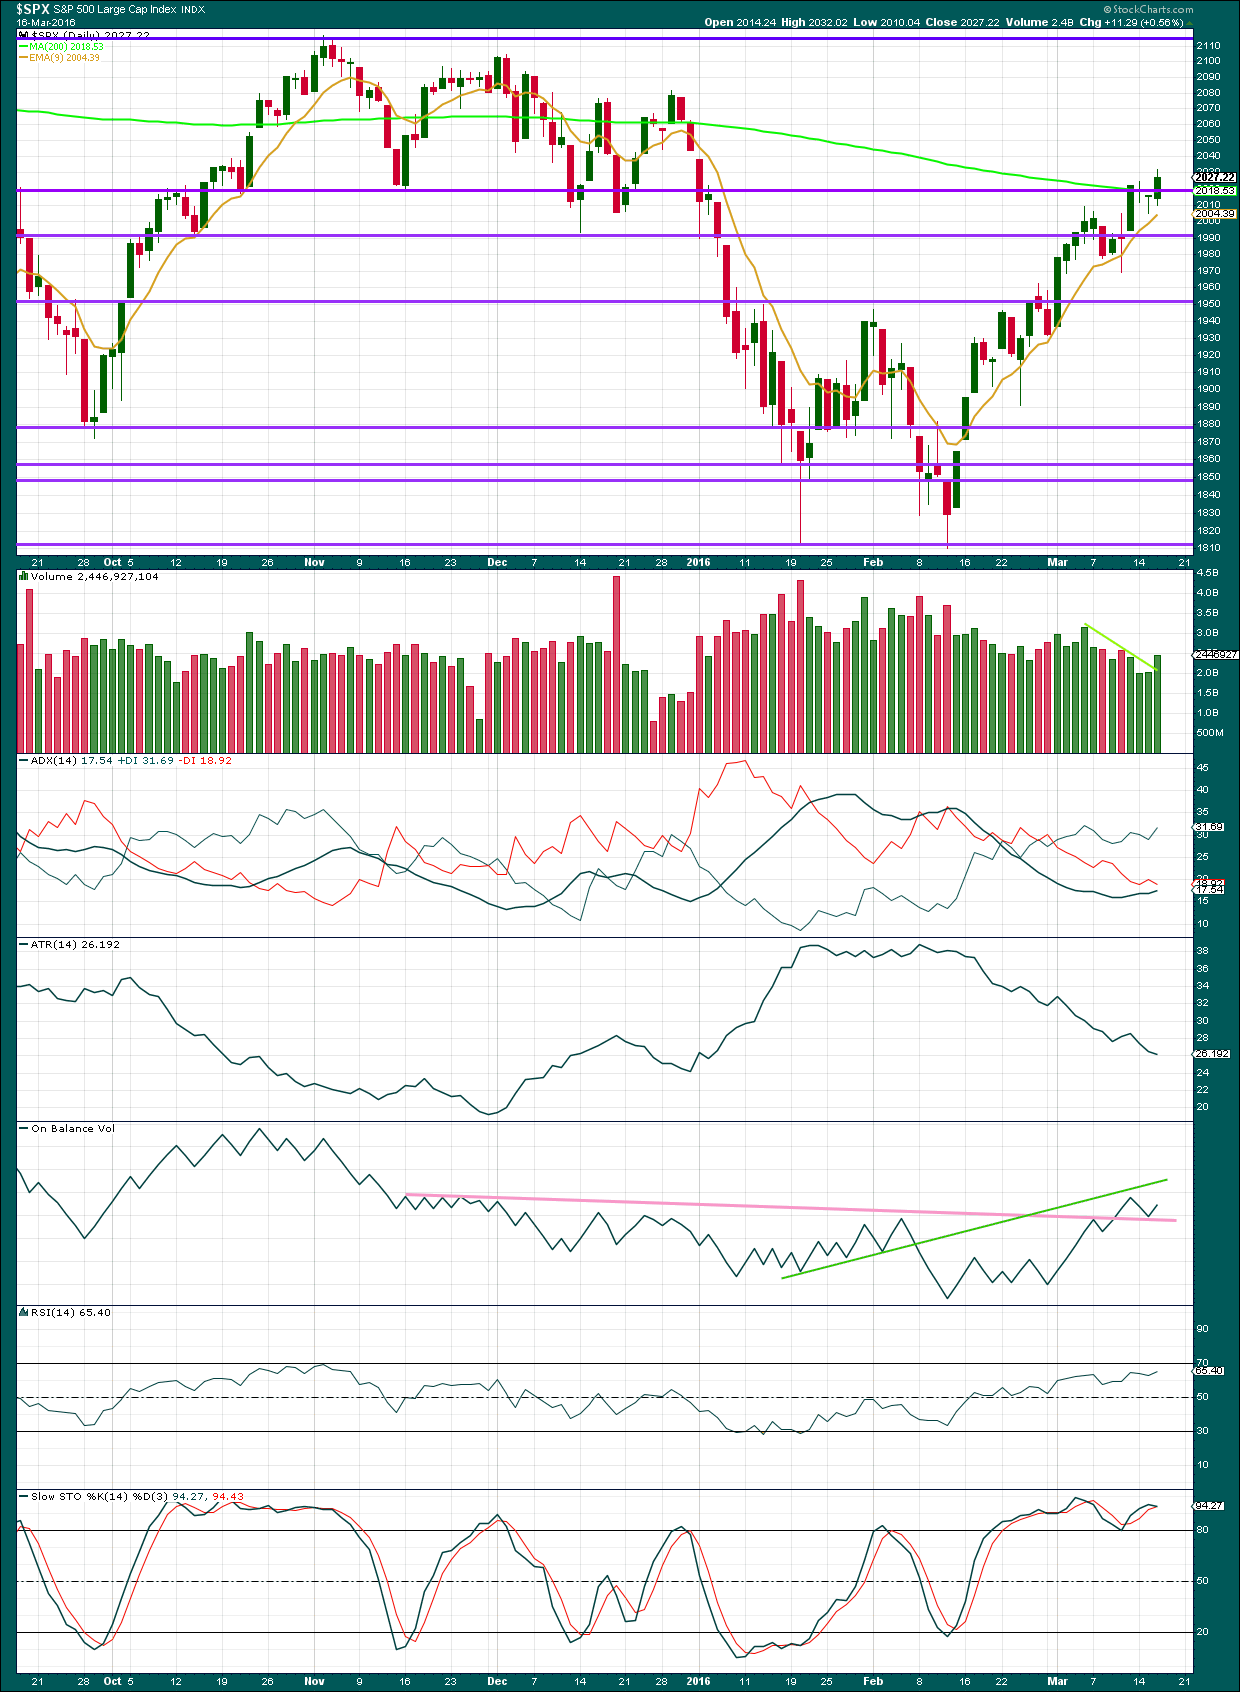
Click chart to enlarge. Chart courtesy of StockCharts.com.
Volume data on StockCharts is different to that given from NYSE, the home of this index. Comments on volume will be based on NYSE volume data when it differs from StockCharts.
A close above resistance about 2,025 on a day with increased volume indicates a possible upwards breakout may be underway. If price keeps moving higher tomorrow and shows a further increase in volume, then the current short term upwards trend may be expected to be continuing.
Price has closed above the 200 day Moving Average. This has happened before and yet all gains were fully retraced thereafter. This close does not mean the bull market is back; this is still more likely a bear market rally.
The 200 day MA is still pointing down.
ADX is increasing indicating the market is trending. The trend is up.
ATR still disagrees indicating that there is something wrong with this possible trend. If it is a bear market rally, this makes more sense.
On Balance Volume found support at the pink trend line, so the strength of that line is reinforced. This line may assist to hold price up from moving too much lower for any continuation of a consolidation.
Neither RSI nor Stochastics are yet overbought. There is room yet for price to rise further.
DOW THEORY
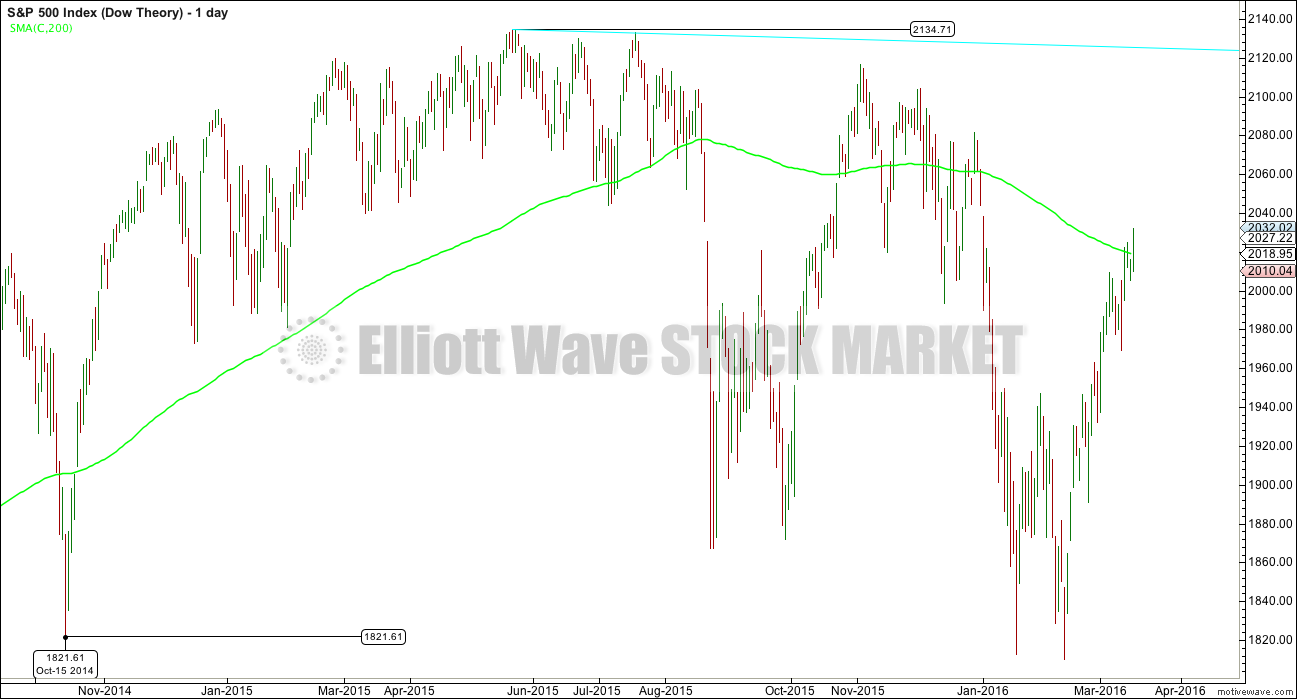
I am choosing to use the S&P500, Dow Industrials, Dow Transportation, Nasdaq and the Russell 2000 index. Major swing lows are noted below. So far the Industrials, Transportation and Russell 2000 have made new major swing lows. None of these indices have made new highs.
I am aware that this approach is extremely conservative. Original Dow Theory has already confirmed a major trend change as both the industrials and transportation indexes have made new major lows.
At this stage, if the S&P500 and Nasdaq also make new major swing lows, then my modified Dow Theory would confirm a major new bear market. At that stage, my only wave count would be the bear wave count.
The lows below are from October 2014. These lows were the last secondary correction within the primary trend which was the bull market from 2009.
These lows must be breached by a daily close below each point.
S&P500
The S&P has not yet closed below 1,821.61. Price remains below the bear market trend line. Price has not made a major swing high. The 200 day moving average remains pointing down.
NASDAQ
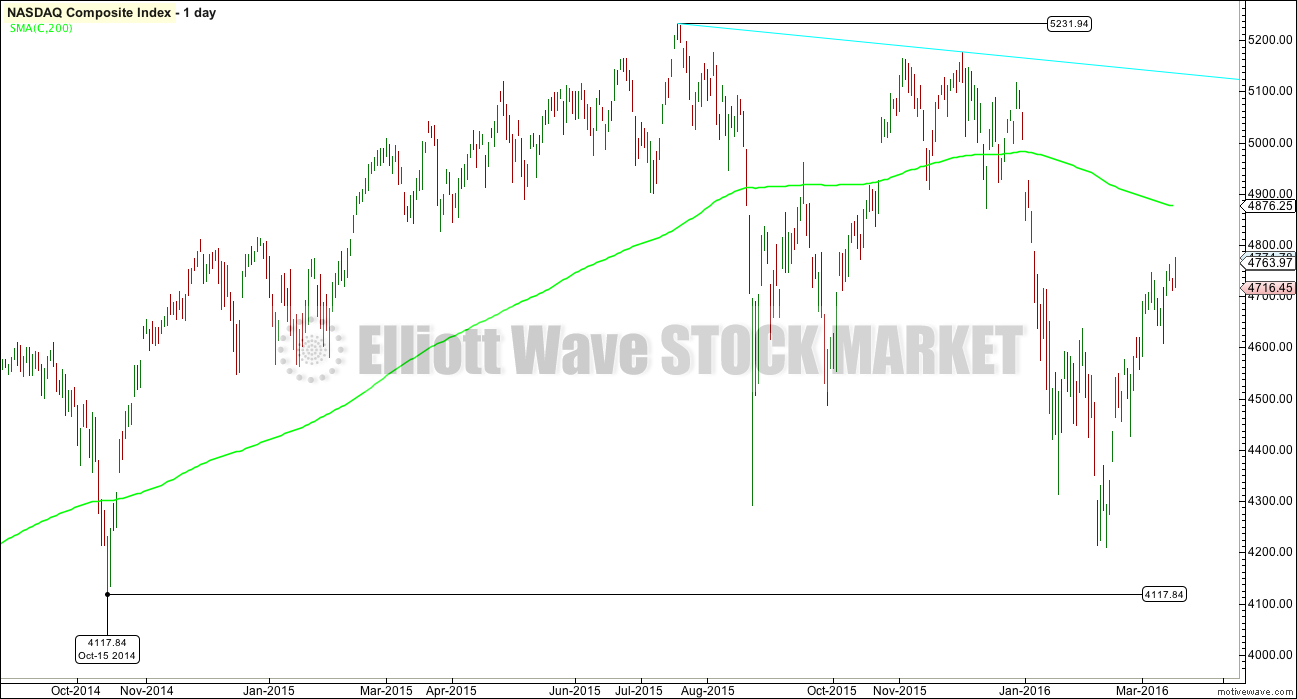
Nasdaq has not yet closed below 4,117.84. Price remains below the 200 day moving average which remains pointing down. Price is below the bear market trend line. Price has not made a major new swing high.
DOW INDUSTRIAL AVERAGE
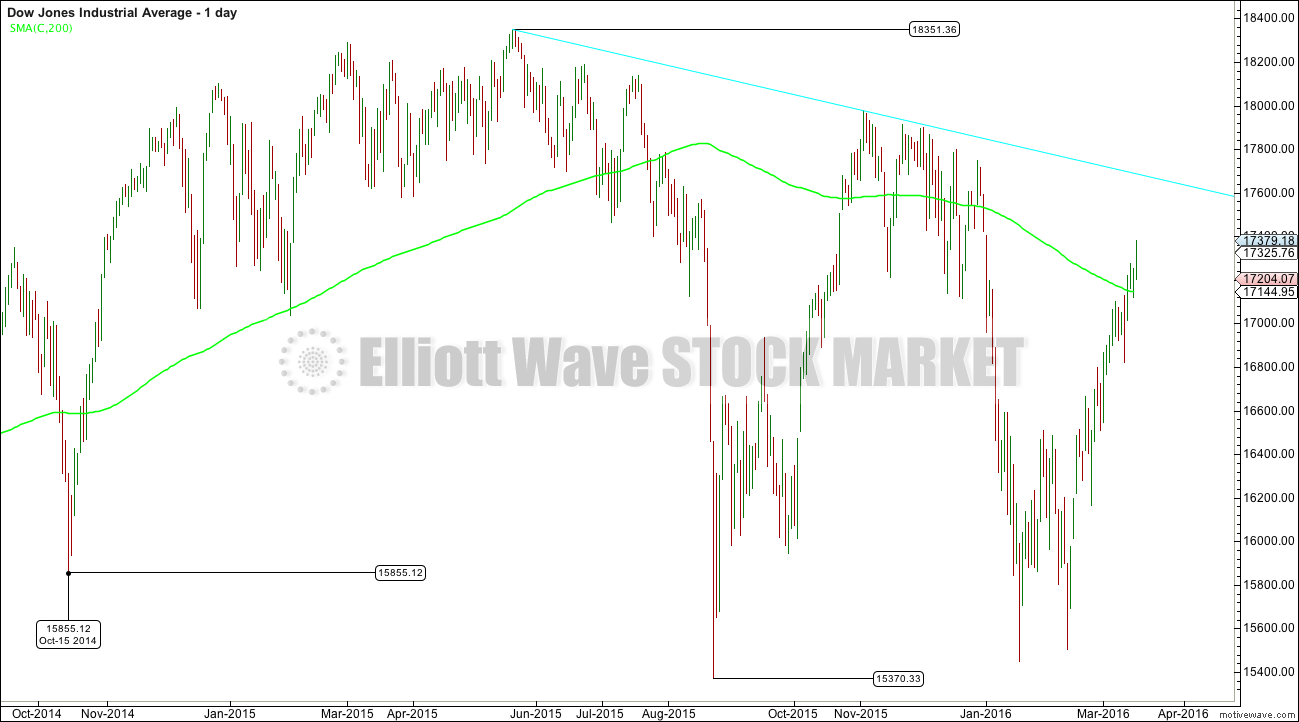
Dow Industrials closed below the last major swing low of the last bull market at 15,855.12 on 20th January. That daily close was 15,766.74. Price is now above the 200 day moving average. The average remains pointing down. Price is below the bear market trend line. Price has not made a major new swing high.
DOW TRANSPORTATION
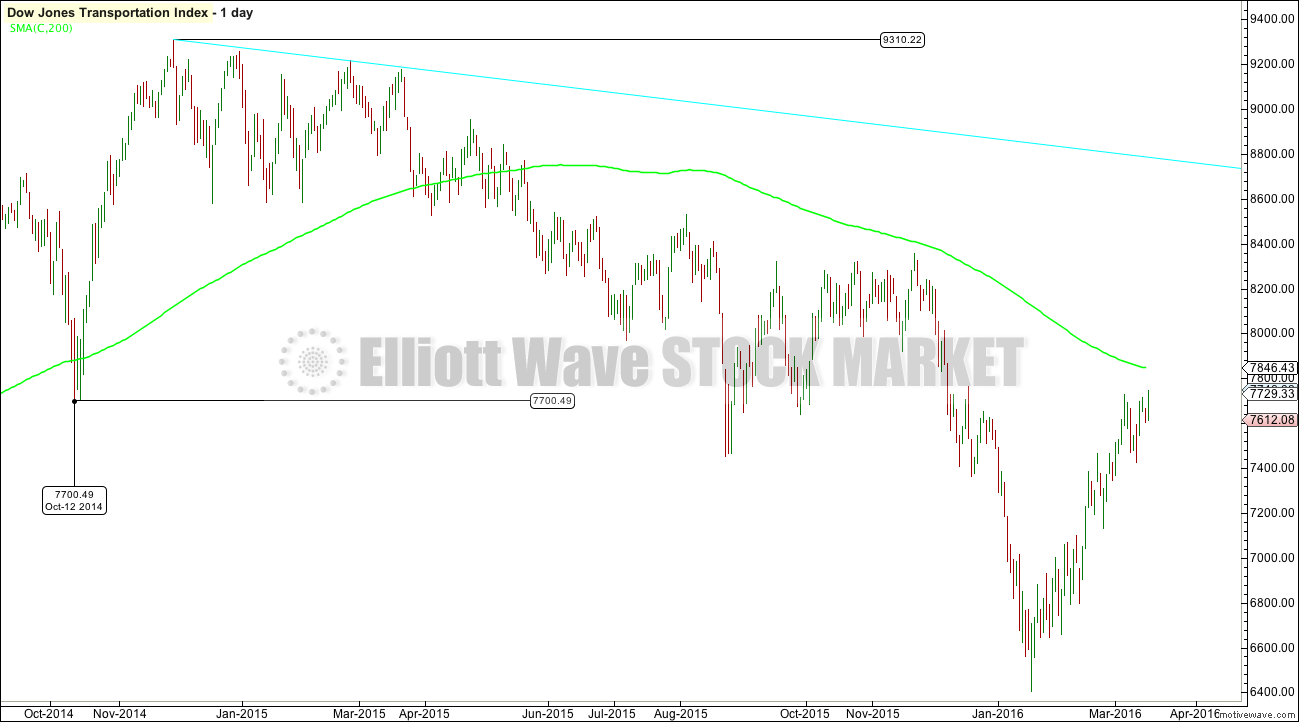
The transportation index has confirmed a new bear market with the industrials. Price closed below the major swing low within the last bear market which was made in October 2014, at 7,700.49. The close was on 24th August, 2015, at 7,595.08. Price is below the 200 day Moving Average. The average is still pointing down. Price is below the bear market trend line. Price has not made a major new swing high.
RUSSELL 2000
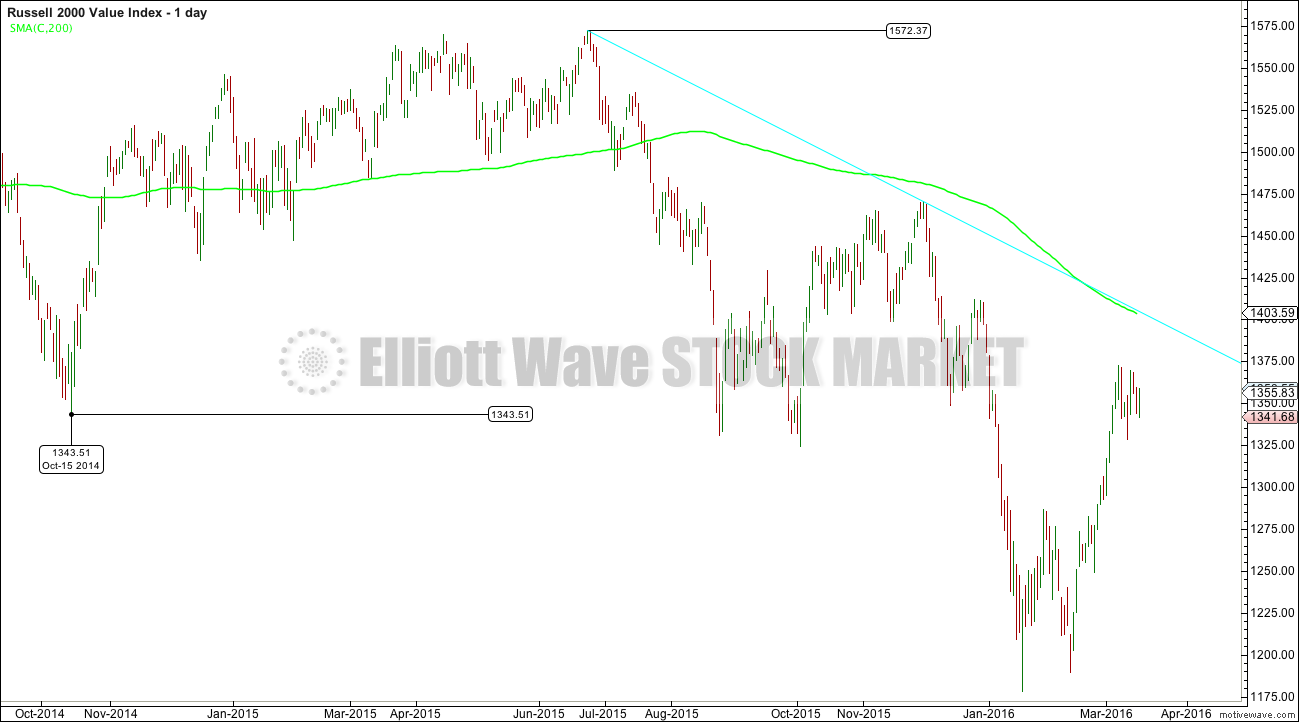
The Russell 2000 closed below the last major swing low of the last bull market which was on Ocober 2014, at 1,343.51 with the close of 1,330.81 on 25th August, 2015. Price is below the 200 day Moving Average. The Average is still pointing down. Price is below the bear market trend line. Price has not made a major new swing high.
This analysis is published @ 10:33 p.m. EST.
[Note: Analysis is public today for promotional purposes. Member comments and discussion will remain private.]

I must confess I have been pondering the most recent price action in the market myself. Now I realize there are some extreme conspiracy theorists who opine that the market is one big manipulated fraud and that even the sentiment gauges are not to be trusted. Clearly some technical indicators have not been as reliable as in times past but unless one is prepared to argue that all market purchases are being made by algos and banksters only, some retail and/or institutional investors must be participating in the market rally. Most of the institutional buying (except stock buybacks) come at month’s end so this mid month rally is even more striking in that it implies a greater participation by retail buyers. The technical particulars about this market are readily available to anyone caring to take even a cursory glance. Granted not everyone subscribes to EWSM and privy to the kind of detailed analysis we enjoy, there is ample evidence highlighting the level of risk US equity markets currently pose. Ample evidence. The question then arises – Who’s buying??!! If the volatility gauges are even remotely useful, the answer has to be EVERYBODY. Volatility is at 52 week lows, a level of complacency wholly incommensurate with the level of market risk. It is however, entirely commensurate with a wave two correction at primary degree. As ironic as it may seem, the one thing that the current market action affirms is that human nature never changes, and for some of us, that is a very good thing. Who would have guessed considering the start of this year, we would be seeing DJI 17,481.00 and SPX 2040.59 on March 17, 2016?! Talk about market price action for the ages- we may be about to witness the same…Stay Frosty!… 🙂
And hats off that you suspected a higher degree for quite a while.
That said, ‘realize’ & ‘weed’ couldn’t go unnoticed. 8/10 – See me 🙂
Did you notice how quick Lara was to explore the possibility once it came up? She is still the only analyst I know who has actually charted that possibility. I was not in the least bit surprised when she said the wave count at that degree was indeed viable. UVXY heading South with nary (hardly) a backward glance was a really big hint…
And I thought that was a really quick edit!!! 🙂 🙂 🙂
Hi all,
As a regular observer and infrequent poster here, I cannot help but see EWT (while delivered perfectly) has not helped in this recent market action. As a novice I cannot evaluate why that is the case.
However, I fear that the collective is now moving bullish and becoming the ‘herd’ that is burnt when the market does in fact turn bearish.
Just an observation based on watching recent price action and the comments here.
I am a new student to Elliotwave myself I thought these quotes from “The Elliot Wave Principle,” by Frost and Prechter would be helpful.
“…What the Wave Principle provides is a means of first limiting the possibilities and then ordering the relative probabilities of possible future paths…” (p87).
“…You can prepare yourself psychologicially for such outcomes through the continual updating of the second best interpretation, sometimes called the alternate count…” (p87).
“…If you’re thrown by your horse , it’s useful to land right atop another…” (p87).
“…Because applying the Wave Principle is an exercise in probability…”(p87).
The reason I chose these quotes is that as a group we are only as good as the wave count we agree upon yet all the alternatives have been provided it is up to us to choose the correct count. The agreed upon count which failed was the supposition of a series of 1’s and 2’s which would lead to an extention. It was logical to assume such yet not even Elliotwave can predict future price movement.
Some of us did get this correction wrong Alison. The problem was not so much the wrong wave count, but wrong degree. Clearly EWT has its limitations. The market is always right! 🙂
Tbf. I’ve lost count how many times Lara clearly stated that until price confirmation is reached the market could go higher. In that regard EWT was and still is right on the money imho. The market is dynamic so near term counts will always be dynamic (unless the analyst is either biased or terrible, or both)
BTW – I did send Lara a link to a book on EWG blog : ‘Psychic for beginners’. Maybe she just hasn’t got around to reading it yet 😉 🙂 🙂 (or was it Psycho…? 🙂 )
I wrote that book,, “Psychotic for Beginners”, would you like an autographed version?
Oooo. Yes please…. 🙂
BTW 2 🙂 It is also a sign of a very good analyst when the longer term count is changed (before it invalidates) when it stops looking right imho. This is very unpopular but the short term pain is usually long term gain. If it were any other way I probably wouldn’t be around here very long
It is one of outstanding qualities of Lara as an analyst, and the reason I originally subscribed – her objectivity.
Folk new to her service and EWT will learn to appreciate that over time…of that I am sure… 🙂
To be REALLY clear, this was not a criticism of Laura, the work, effort and delivery is EXCELLENT!
Merely a question mark for me over EWT.
The flip from bearish to bullish concerns me and is seems unatural to be looking down and then suddenly up – but as they say, ‘don’t fight the market’.
Ali
Just 20 minutes to market close and S&P showing a volume of 430 million so far…
4:06PM volume 657.473 more than yesterday
I wonder if there is something happening at close by big players cause this sudden jump in volume is very interesting. Looking around for rationale behind this jump..
I am out of my SPXS and SDOW shares. Looking for re-entry. Might as well lock in some profits… then reposition.
This will be my main hourly chart today.
Proportions all fit nicely. Some nice Fibonacci ratios in there.
Minute v is extending to complete minor 3. At 2,086 minor 3 = 1.618 X minor 1. A reasonable target.
Also, interestingly, at 2,086 minuette (iii) = 1.618 X minuette (i).
So about 2,086 expect a correction to develop.
Draw an acceleration channel: from the high of minor 1 to the last high, a low on minor 2. As price keeps moving higher keep redrawing the channel. When minor 3 is done the channel helps show us where minor 4 may find support.
Yeah – that makes alot more sense.
Only doubts I have is just how weak this move up looks (suppose that could resolve itself at any time) – if start hitting some small degree wave 1 invalidations we’ll know soon enough. Until that point it looks absolutely perfect to me.
This new count is definitely my new favourite but keeping larger Minor 4 structure on the back burner just in case.
An increase in volume today supports the rise in price.
I’ll be looking at momentum, volatility and breadth too.
So I’ll address this concern in todays analysis which I’m doing now. I’ll take a look and see how weak this is.
Wow! This wave up has executed a psychological master-stroke.
There is no doubt in my mind that a new 52 week volatility low in a confirmed bear market is consistent with a second wave correction at primary degree.
Aggressive traders will be backing up the truck on volatility today.
Technical traders will wait for the next green UVXY candle on close.
Conservative (and probably more prudent) traders will wait for the violent take out of DJI 17,000.00 and SPX 2000.00
Farewell and adieu,
To you Spanish Ladies… 🙂
I’m waiting until we get as close to ATH as possible – very unlikely it will work out that way but that’s the plan.
If the structure looks complete and we are fairly close to ATH (close enough that I won’t lose the farm if count is wrong) then I’ll be *in*.
Possibly a once in a lifetime setup in terms of risk/reward – which makes me think it very likely won’t go quite so smoothly as I imagine.
Fear and Greed meter (which Rodney sometimes quotes) is now at 78.
By end of this count, it’ll probably only show smoke!! 🙂
http://money.cnn.com/data/fear-and-greed/
I’ve been watching it. My original goal / hope was for it to hit 80. With daily MACD now approaching the 30 target, the market is entering a significantly overbought period. Right up near the ATH is a marvelous place to enter short. 2100 here we come.
I also want to see bullish / bearish percentiles at the end of the week. Last week I think was only 37 % bullish. I’d like 50+. I am licking my chops as I see the prices of my trading instruments for bears reaching 52 week lows. We recently saw how high they can go if we turn around and fall to 1800. What if they blast right through that on the way to 1700 and then have another oversold condition for the bounce?
Have a great weekend.
I am keeping a very sharp eye on UVXY. I picked up some more April 30 strike calls today and will add over the next several days if it stays above 23.30 I do not think this market will continue higher too much longer. I also think primary 3 down is going to begin with a monster gap and plan on staying out of the way of that runaway train. Sentiment now extreme.
Yeah I agree – there is probably some tradeable upside left but I am too chicken to play it other than maybe small very short term scalps (minutes!).
When Minor 4 finally shows itself I’ll have a bit more confidence of exactly where we are on the map.
But is picking up pennies in front of a steam roller atm imho. A wave at this degree could easily truncate and trap you seriously on the wrong side.
It has been a while since market participants have experienced a primary degree third wave down – there have been so many false starts. There are some incredible implications if we are indeed about see one, namely, that the most devastating leg of this bear market could be over before the Summer…
“Yes its gonna to be a cold, lonely Summer …”
This is only cycle wave I.
There’s cycle wave II to correct eventually…
And one day in the far off future cycle wave III down… with primary 3 in the middle of it. But I don’t think we’ll be able to trade that down. Shorts will probably be illegal for that move.
Here’s an idea which has better proportions.
What if minute v of minor 3 is extending? What if that expanded flat I have labelled minor 4 on the alternate hourly is only minuette (i) within minute v?
It makes zero difference to expected direction and the target. It makes a difference to when and where we expect the next correction to turn up.
I’ll chart it and put that up here for your consideration.
There is a small five up on the hourly chart. This looks like an impulse. Within it the third wave has a close 1.618 Fibonacci ratio to the first, it’s just 0.4 points short. So far the fifth wave is now longer than the third by 2.1 points.
On that basis I may have to discard the main hourly chart now.
I had considered retaining it because sometimes B waves (and X waves) can be longer than 2 X A waves (or W waves). But with what looks like a clear five up on the hourly… it just has such a low probability now.
I’ll make that final judgement after looking at the five minute chart.
For now the probability is that the S&P is in minor wave 5 upwards. Target 2,126.
It is very difficult for me to estimate how long minor 5 will last. So far for the bear wave count these waves are not exhibiting Fibonacci numbers for duration. So my estimate is a guess only. About two weeks?
Update on my thoughts after some further reasoning….
The gap fill area seems like the most logical place for a reversal, BUT, I suspect every trader and their granny will be watching that level. It’s just to obvious.
Couple that with the fact that 73% of my brokers clients are short SPX, that points towards something like this:
A small pullback from the 2043 resistance, enough to make everyone pile in short, and then reverse into a massive squeeze and spike higher to 2060-2080 area.
Fully expect first test of 2043 to be rejected but unless we get a break of 2005 there is more upside to come.
Just throwing that out there to share?
Sure feels like that. Today and tomorrow there will be a lot of short unwinding and I’m sure we are already in the thick of that now. Anyone short Friday is likely to want to throw in the towel before the weekend.
Don’t think the 2043 pivot is going to slow this down for long, probably zooming right up to 2007 pivot range.
UVXY is well below 52 week lows and likely to go lower if we get an EOD surge. Not much fear out there right now.
I would not call one point “well below”. I was actually expecting it to flirt with the 20.00 point area. Remarkable since we have yet to make new all time highs. It just blows my mind observing this kind of market psychology play out right before your very eyes. After all the decades of market analysis and all that has been written about crowd behaviour one would think it should have an effect on human response once it has become commonly known. In a very sad way this is like shooting fish in a barrel. Somethings never change!
Amend that to just below the 52 week high – still an amazing shift in a few days…
oh, and 2070 near term pivot target range 🙂
I hear you and wondering how many other technical players are position for this. I suspect majority and Mr. Market loves to prove the majority wrong and hence my suspicion that when it reverses, a lot will be caught out of position or very little exposure/protection.
Complacency in most markets right now. The Bulls are all giddy!
As price gets higher and higher, and if it does get close to the all time high at 2,134, then almost everyone will be stating very firmly that the bull market is back.
Even the Ellioticians. Because the upwards move should subdivide as an impulse.
That is what primary 2 should do. Convince the vast majority there is no bear market.
Right before primary 3 explodes.
I suspect we have at least a couple of weeks profit to the upside before it arrives.
I think we could still be in Minor 4 – time wise (relative to Minor 2) it makes sense, but price wise it is getting a bit out of proportion with other waves. It could still morph into a larger Minor 4 corrective pattern that makes sense of it all.
But the further we continue drifting upwards the less that probability and greater probability that we must already be in Minor 5, albeit it seems to be seriously lacking any conviction atm.
Chart – (b) is now more than 2*(a) so this count might be a bit of a stretch, but I have seen out of proportion B waves quite often and this current move up looks tired – volume will be telling.
Labelling probably should be (w)(x) rather than (a)(b)
My thoughts exactly Olga.
I’ve seen B waves that are well over 2 X A. Not often, but a fair few.
So I’ll be swapping the hourly charts over based on probability, but what is the main hourly chart in this analysis will be retained.
As you say, proportion. It just looks wrong.
But then, the other awful thing about the S&P is proportions of its waves just don’t always look right at all time frames. Just look at minute i (within intermediate (B) down) on the daily bear chart. That looks all wrong, but it was a five and subdivides as a five on the hourly chart.
And that right there is what makes analysing this particular market so difficult.
And I think I have a better solution. See comment above… and chart to be posted shortly.
Updated USD:CHF chart – price just made a lower low.
USD spiking, that will do the number on commodities, including oil.
Imo USD will lag most other currencies in the race to the bottom, but EW suggests that CHF may come last in that race in USD terms – (so effectively turbo charging its worth against other currencies falling faster than USD).
SO Bear alt. hourly is now in play…
Now in Minor wave 5 with minute wave iv over and minute wave v in progress.
SO we are now looking for a termination point for minor wave 5 at the same time as for minute wave v. Once these TOP… The next wave down for this wave count would be a strong third wave at primary wave degree.
Lara, have I read this correctly? If yes, can these TOP at any point up between here and 2126 and the alt hr & daily counts are valid?
Thank You
Yes, you’ve read that right.
Now we have to wait for the structure of minor 5 to be complete. And that is at least a week away, probably longer.
As soon as price gets close to 2,116 look out for it to end.
There is a higher probability that price will make it at least slightly above 2,116, but it does not have to do that.
I don’t think the bears are on the prowl just yet. Although Europe down, US futures still showing too much optimism. The wrangling has now moved from the round number pivots to the 200 dma and if last Fall was any indication, should play out over several days as the bulls do their best to try and keep the party going. I’m keeping my remaining powder dry until futures herald a decisive demolition of the round numbers, or the bears pull a fast one and execute an intra-day ambush. Away from screens today so that is probably likely to transpire! Have a great trading day everyone!
Verne, how do you determine if/when UVXY bottoms?
It confuses me because it can go so low, so that they need to reverse split it, and then it can go even lower… so I’ve never come close to figuring it out…
I feel like the time to load up on some UVXY calls is getting close though…
falling down now, this doesn’t look like a 4th wave correction.
That was a great analysis Lara. I’m sure it took a long time to make this one…
Thank you.
Yes it did. Hours and hours.
I really want to be right. I hate being wrong. And if something is unclear I like to put in the time to understand until it becomes clear.
You’re not wrong I don’t think. Its just that this primary wave 2 has gotten complicated. After I watched Ciovacco Capital video, it all made sense. This is the prototypical retracement (possibly close to 100% retracement) to get all the bears and bulls doubting about market direction. Primary wave 2 is doing what’s its suppose to be doing: confusing everyone, making people bang their head against the wall, and pulling their hair out…
But boy, I can’t wait til its over 🙂
Waiting patiently to add to my positions…
I’m so thoroughly impressed with Ciovacco Capital.
Such solid and simple technical analysis.
And so calmly presented.
Lara, I like what you did in discarding the previous bear count and are very clear as to what your thoughts are about the bull count. If we in fact make it over 2100, a whole bunch of people will be caught with their pants down so to speak. It makes sense. A second wave scares out a mass of bears and sucks in a mass of bulls. By 2100 we will be at the extreme end of most sentiment and momentum indicators. Perfect.
I will be patient. But I am certainly looking forward to the end of this 2nd wave.
Thanks Rodney.
If that bear wave count is right then most Ellioticians, or at leas the less experienced or capable ones, will be fooled too. It will be a five up. On the daily chart. That means a new trend for many.
If it makes it over 2,116.48 they’ll all call a new major swing high. Which would be technically correct.
And that is where Elliott wave would identify a potential major bear move where the rest of the technicals may miss it.
Expanded flats. Tricky structures. Very common too, and in my experience fiendishly difficult to see unfolding when the B wave comes because of the new price extreme (and because zigzags can look so much like impulses).
I am nervous about the nail biting finish this wave count expects TBH. It’s a pretty big call to make. But this is the only option left that I can see at this stage that makes sense after all other possibilities have been eliminated by price or due to a very low probability.
I had to page down forever, first and worst.
if futures hold,, it looks like we are in that 5th up.