Sideways movement for a small green daily candlestick still fits the Elliott wave count.
Summary: The correction is still most likely over. Price confirmation that the correction is over is still required with a new low below 1,962.96. Upwards movement may continue while price remains above this point. A low below 1,962.96 by any amount at any time frame would indicate a strong third wave down is most likely beginning.
To see how each of the bull and bear wave counts fit within a larger time frame see the Grand Supercycle Analysis.
To see detail of the bull market from 2009 to the all time high on weekly charts, click here.
Last published monthly charts can be seen here.
If I was asked to pick a winner (which I am reluctant to do) I would say the bear wave count has a higher probability. It is better supported by regular technical analysis at the monthly chart level, it fits the Grand Supercycle analysis better, and it has overall the “right look”.
New updates to this analysis are in bold.
BULL ELLIOTT WAVE COUNT
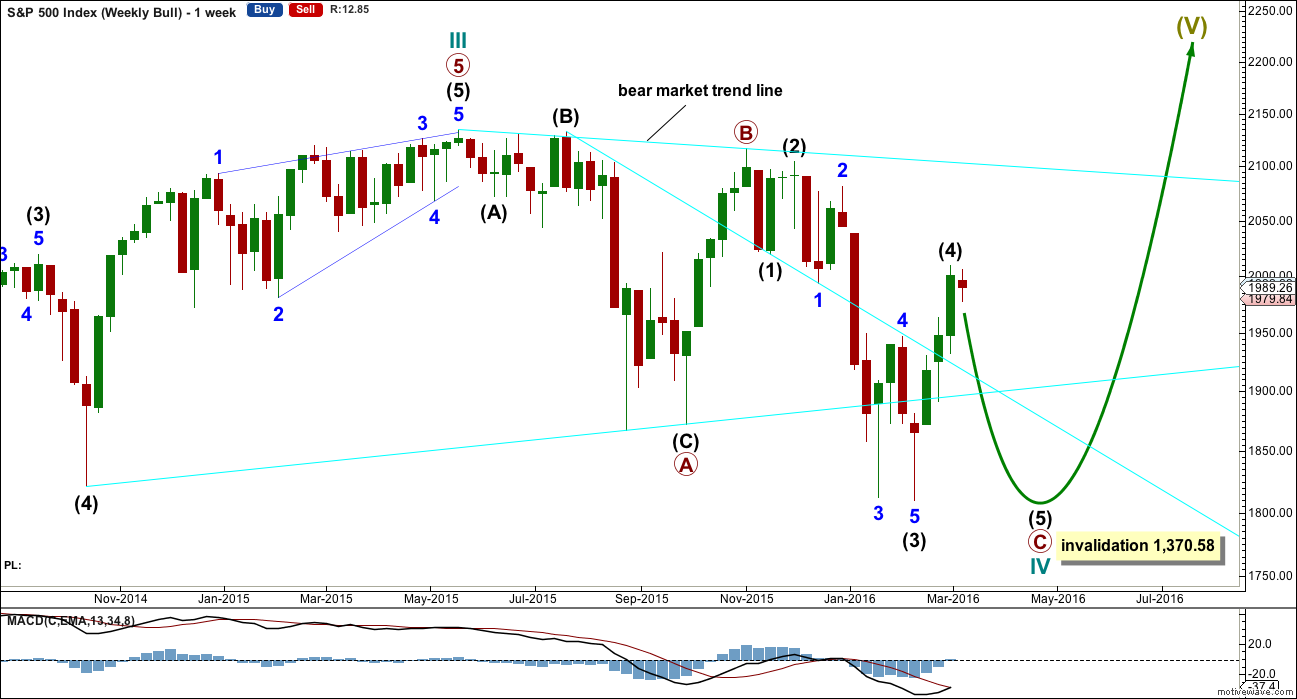
WEEKLY CHART
To see all movement from the all time high without squashing the daily candlesticks up too much, it is time to publish weekly charts regularly.
This wave count is bullish at Super Cycle degree.
Cycle wave IV may not move into cycle wave I price territory below 1,370.58. If this bull wave count is invalidated by downwards movement, then the bear wave count shall be fully confirmed.
Cycle wave II was a shallow 0.41 zigzag lasting three months. Cycle wave IV should exhibit alternation in structure and maybe also alternation in depth. Cycle wave IV may be a flat, or combination. This first daily chart looks at a flat correction.
Cycle wave IV may end within the price range of the fourth wave of one lesser degree. Because of the good Fibonacci ratio for primary wave 3 and the perfect subdivisions within it, I am confident that primary wave 4 has its range from 1,730 to 1,647.
Primary wave C should subdivide as a five.
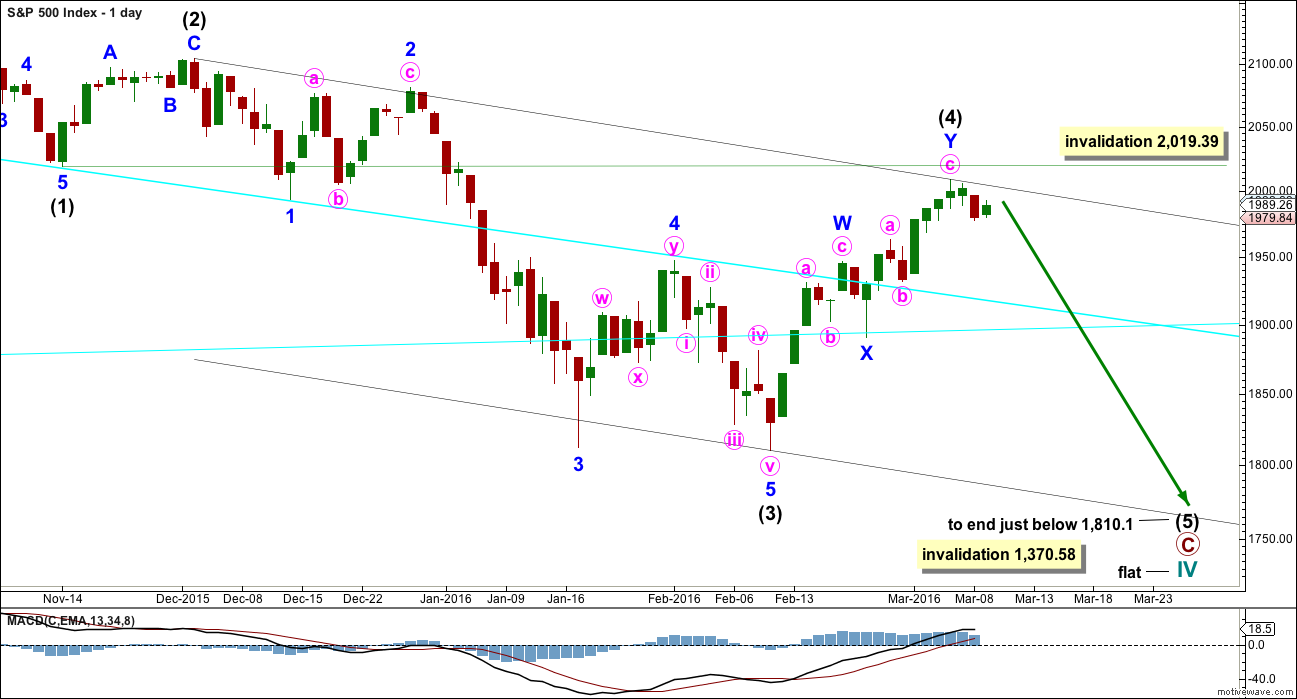
DAILY CHART – FLAT
Within the new downwards wave of primary wave C, intermediate waves (1), (2) and now (3) may be complete. Intermediate wave (4) may now be over. Intermediate wave (2) will subdivide either as a single or double zigzag (as will intermediate wave (4) ). There is inadequate alternation between these two corrections, which reduces the probability that the current correction is a fourth wave.
Draw the channel about primary wave C using Elliott’s second technique. Draw the first trend line from the ends of intermediate waves (1) to (4), then a parallel copy on the end of intermediate wave (3). Expect intermediate wave (5) to find support at the lower edge. Intermediate wave (5) is highly likely to end slightly below 1,810.1.
The idea of a flat correction for cycle wave IV has the best look for the bull wave count. The structure would be nearly complete and at the monthly level cycle wave IV would be relatively in proportion to cycle wave II.
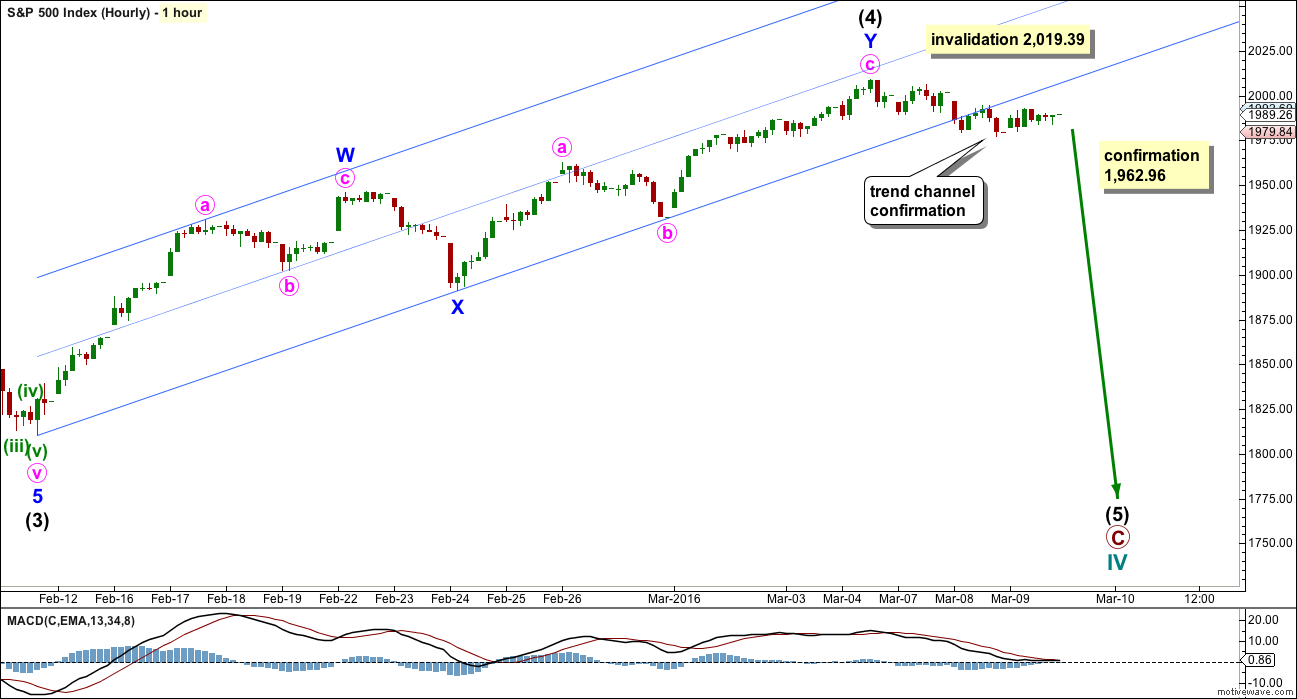
HOURLY CHART
Comment on structure will be with the bear wave count today.
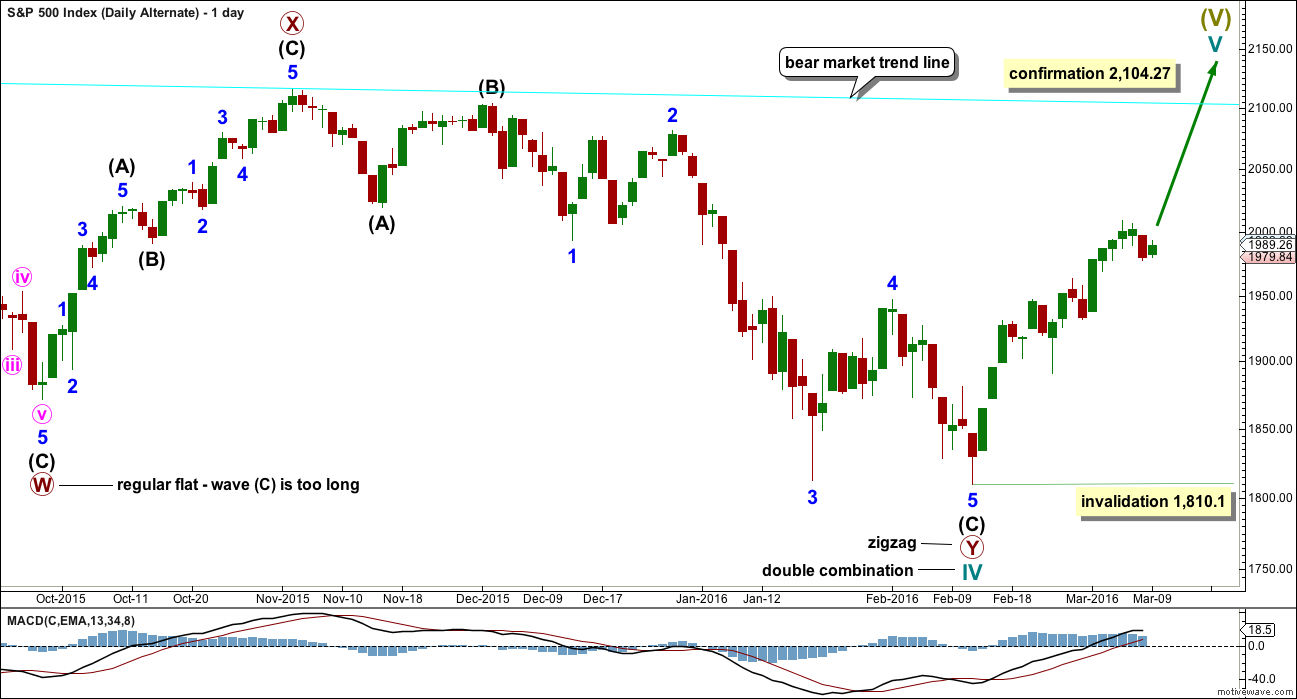
DAILY CHART – COMBINATION
This idea is technically possible, but it does not have the right look. It is presented only to consider all possibilities.
If cycle wave IV is a combination, then the first structure may have been a flat correction. But within primary wave W, the type of flat is a regular flat because intermediate wave (B) is less than 105% of intermediate wave (A). Regular flats are sideways movements. Their C waves normally are about even in length with their A waves and normally end only a little beyond the end of the A wave. This possible regular flat has a C wave which ends well beyond the end of the A wave, which gives this possible flat correction a very atypical look.
If cycle wave IV is a combination, then the first structure must be seen as a flat, despite its problems. The second structure of primary wave Y can only be seen as a zigzag because it does not meet the rules for a flat correction.
If cycle wave IV is a combination, then it would be complete. The combination would be a flat – X – zigzag.
Within the new bull market of cycle wave V, no second wave correction may move beyond the start of its first wave below 1,810.10.
I do not have any confidence in this wave count. It should only be used if price confirms it by invalidating all other options above 2,104.27.
BEAR ELLIOTT WAVE COUNT
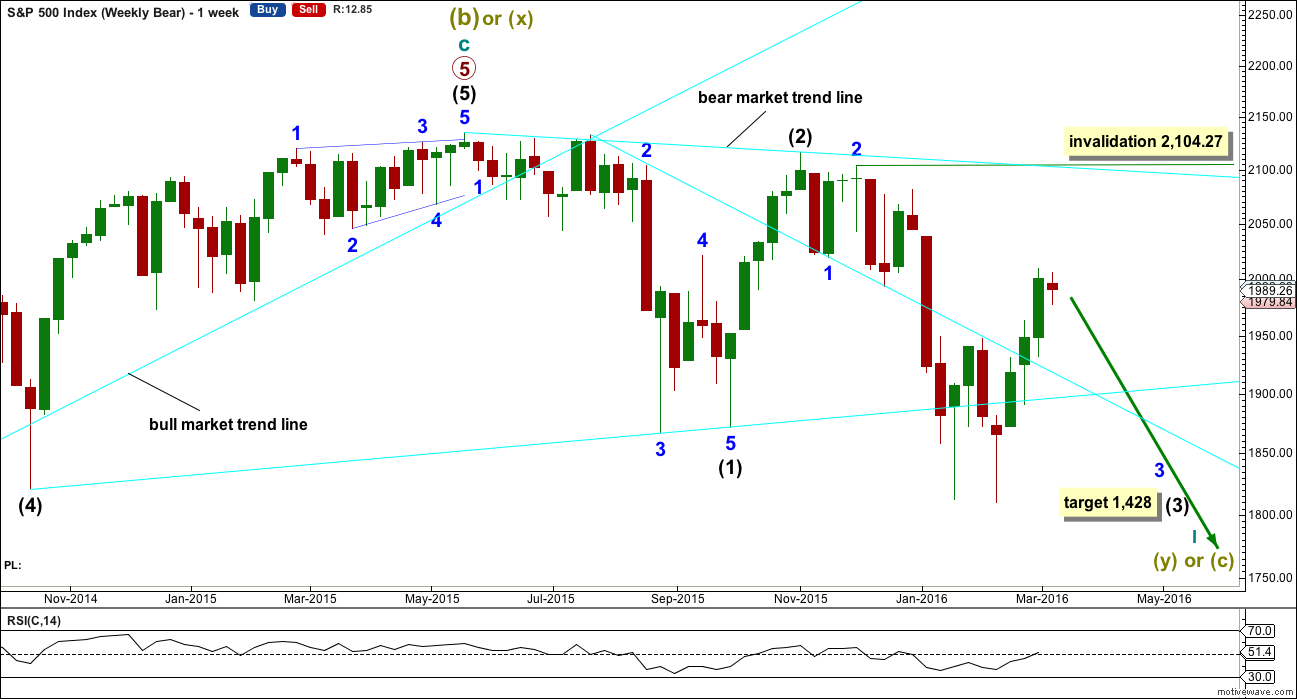
WEEKLY CHART
This bear wave count fits better than the bull with the even larger picture, super cycle analysis found here. It is also well supported by regular technical analysis at the monthly chart level.
Importantly, there is no lower invalidation point for this wave count. That means there is no lower limit to this bear market.
Downwards movement so far within January still looks like a third wave. This third wave for intermediate wave (3) still has a long way to go. It has to move far enough below the price territory of intermediate wave (1), which has its extreme at 1,867.01, to allow room for a following fourth wave correction to unfold which must remain below intermediate wave (1) price territory.
Intermediate wave (2) was a very deep 0.93 zigzag. Because intermediate wave (2) was so deep the best Fibonacci ratio to apply for the target of intermediate wave (3) is 2.618 which gives a target at 1,428. If intermediate wave (3) ends below this target, then the degree of labelling within this downwards movement may be moved up one degree; this may be primary wave 3 now unfolding and in its early stages.
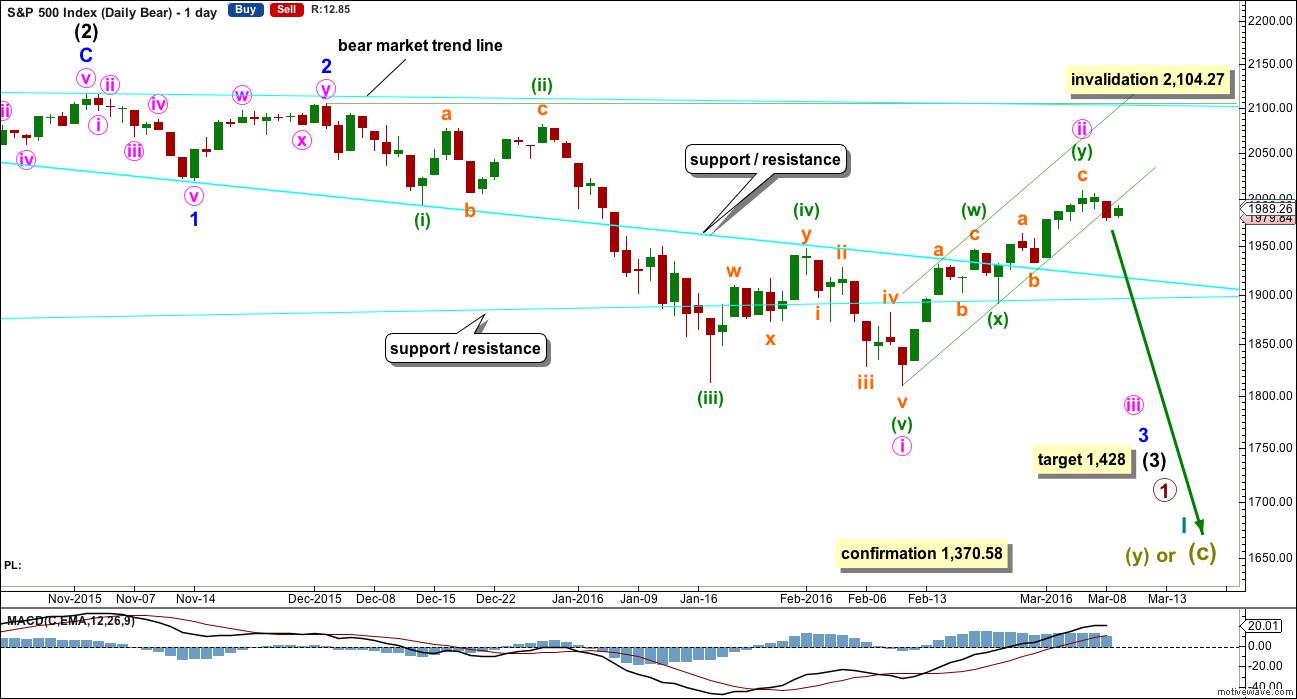
DAILY CHART
Intermediate wave (2) lasted 25 sessions (not a Fibonacci number) and minor wave 2 lasted 11 sessions (not a Fibonacci number).
Minute wave ii has now lasted fifteen sessions, four longer than minor wave 2. At this stage, the size of minute wave ii no longer gives the wave count the right look, so for this reason the alternate below is published. The S&P does not always exhibit perfect proportions, so this wave count remains entirely valid. The overall look is not too far from perfect to be somewhat acceptable for this market in my experience.
The channel about minute wave ii has been breached now by a full daily candlestick below and not touching the lower trend line. The small amount of upwards movement for Wednesday looks like a typical throwback to the trend line.
Minute wave ii may not move beyond the start of minute wave i above 2,104.27.
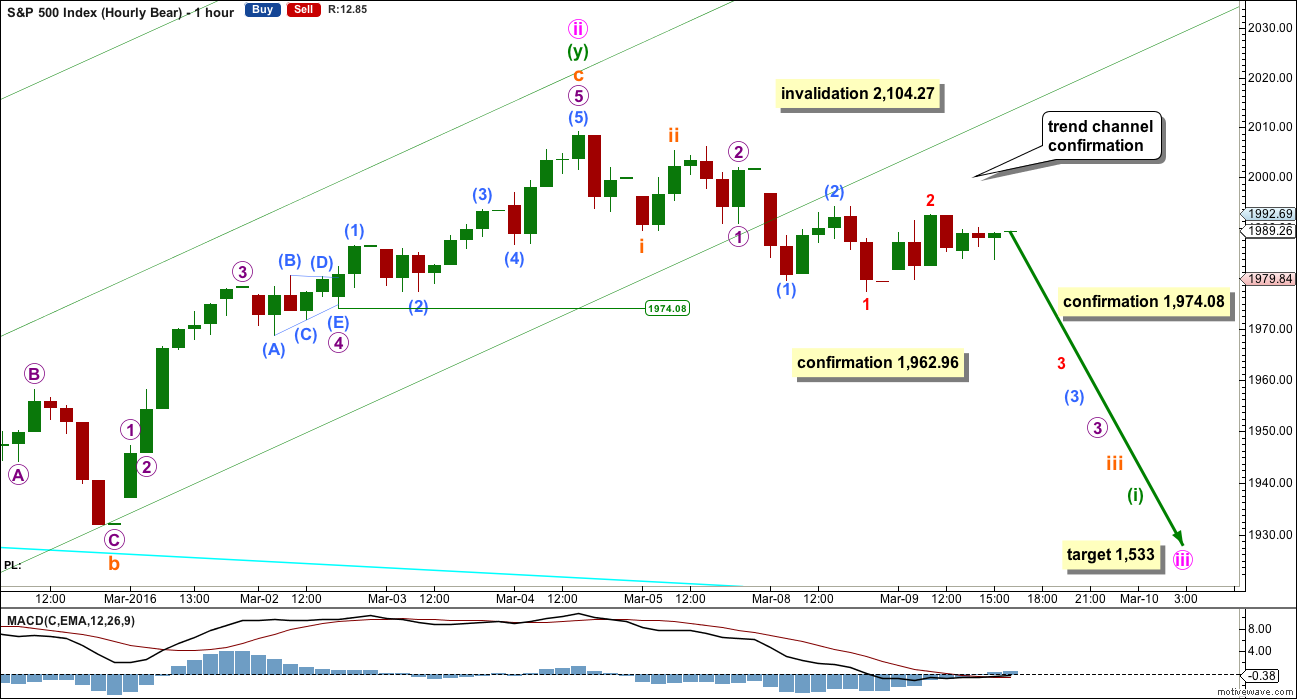
HOURLY CHART
There are two ways to see this upwards movement: as a double zigzag as shown here or as a single zigzag as shown for the alternate below. Both ways to label it work in the same way for this and the alternate wave count below.
Downwards movement from the high labelled minute wave ii subdivides as fives downwards and threes upwards on the five minute chart. This supports the idea that minute wave ii is very likely over, along with the now very clear breach of the channel containing minute wave ii.
For the S&P, within its impulses, it is very commonly (almost always) the third wave which extends and when that happens the third wave within each third wave is also extended. Like a series of Russian dolls, each lower degree third wave is an extension within the prior third wave. This necessarily begins with a series of overlapping first and second waves.
There is still no price confirmation of a trend change. Earliest price confirmation would come with a new low below 1,974.08. This is the start of micro wave 5. A new low below this point could not be a second wave correction within micro wave 5.
A new low below 1,962.96 would invalidate the alternate idea for the hourly chart below and provide final confirmation of a trend change.
At 1,533 minute wave iii would reach 1.618 the length of minute wave i. If this target is wrong, it may not be low enough. I may add further targets when a trend change is confirmed.
ALTERNATE DAILY CHART
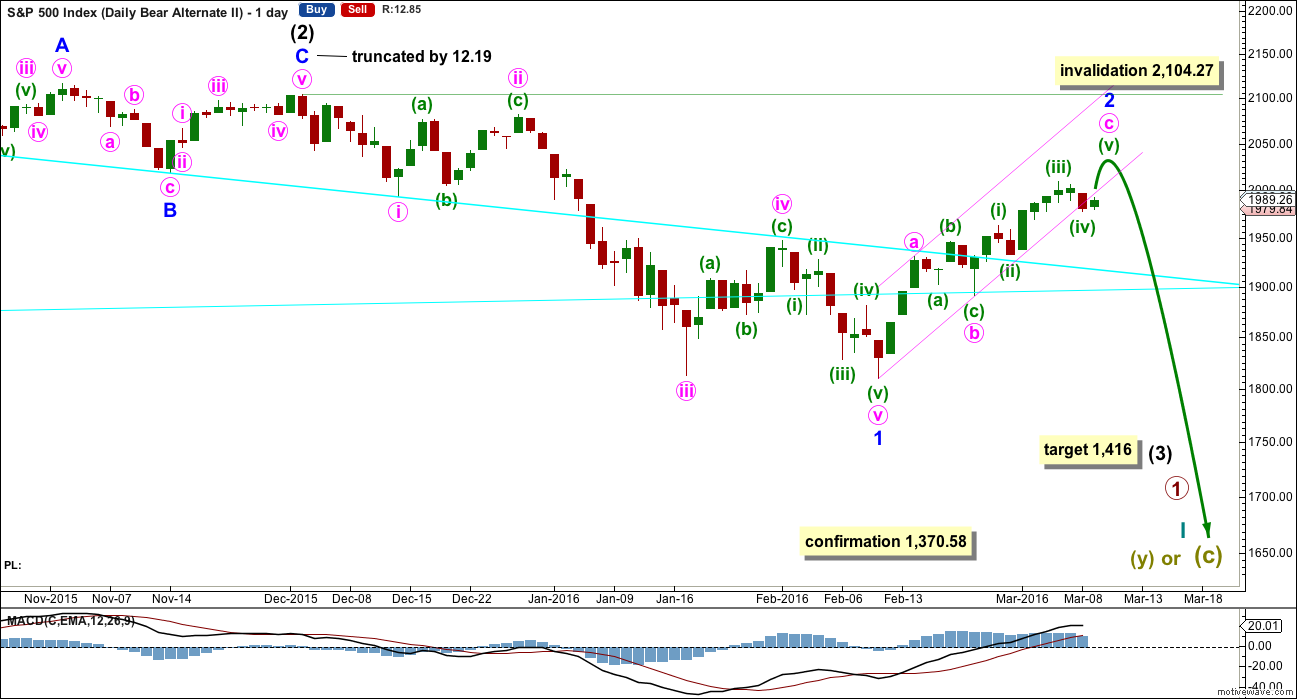
If intermediate wave (2) ends on 2nd December, 2015, then it will only fit as a zigzag with a truncated C wave. I have tried to see other ways of labelling this movement with the same end and so far I cannot find a better solution. The truncation is large at 12.19 points which gives this wave count a very low probability. But this now resolves the problem the main wave count has of proportion.
Intermediate wave (2) for this wave count is 45 days in duration. Minor wave 2 is now eighteen days in duration, so the proportions look good. It is also possible that minor wave 2 is a completed double zigzag lasting fifteen days as per labelling for this bounce with the main bear daily chart.
Minor wave 2 may not move beyond the start of minor wave 1 above 2,104.27.
This alternate makes a difference to the target. At 1,416 intermediate wave (3) would reach 2.618 the length of intermediate wave (1).
Upwards movement may be an incomplete single zigzag. At 2,086 minute wave c would reach 1.618 the length of minute wave a.
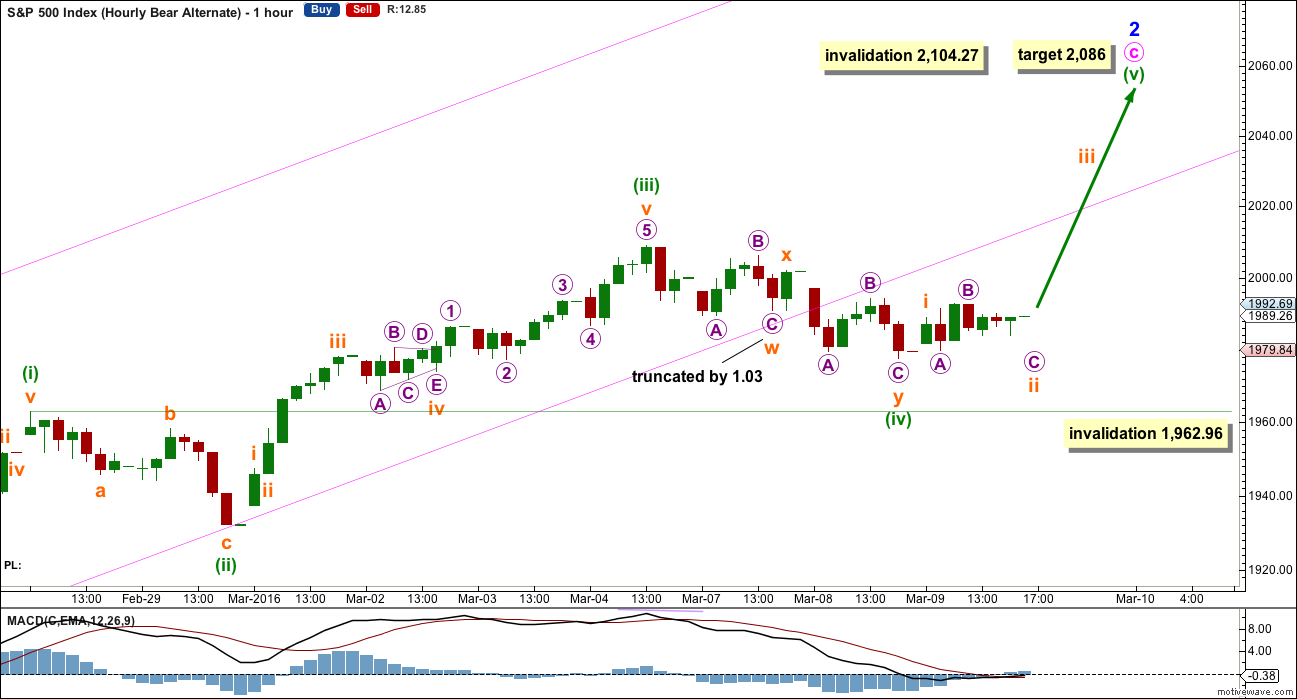
The idea presented with the first hourly bear chart also works in exactly the same way for this alternate. Upwards movement may also be a complete double zigzag.
Within minute wave c of the zigzag, minuette wave (iv) will only fit as a double zigzag if it is complete. But the first zigzag has a slightly truncated C wave. This reduces the probability.
If minuette wave (iv) is continuing lower, it may only do so now as a very rare triple zigzag. The rarity of this structure makes that a very low probability.
Minuette wave (iv) may not move into minuette wave (i) price territory below 1,962.96.
The breach of the channel is now substantial. This reduces the probability of this wave count, but does not eliminate it.
TECHNICAL ANALYSIS
DAILY CHART
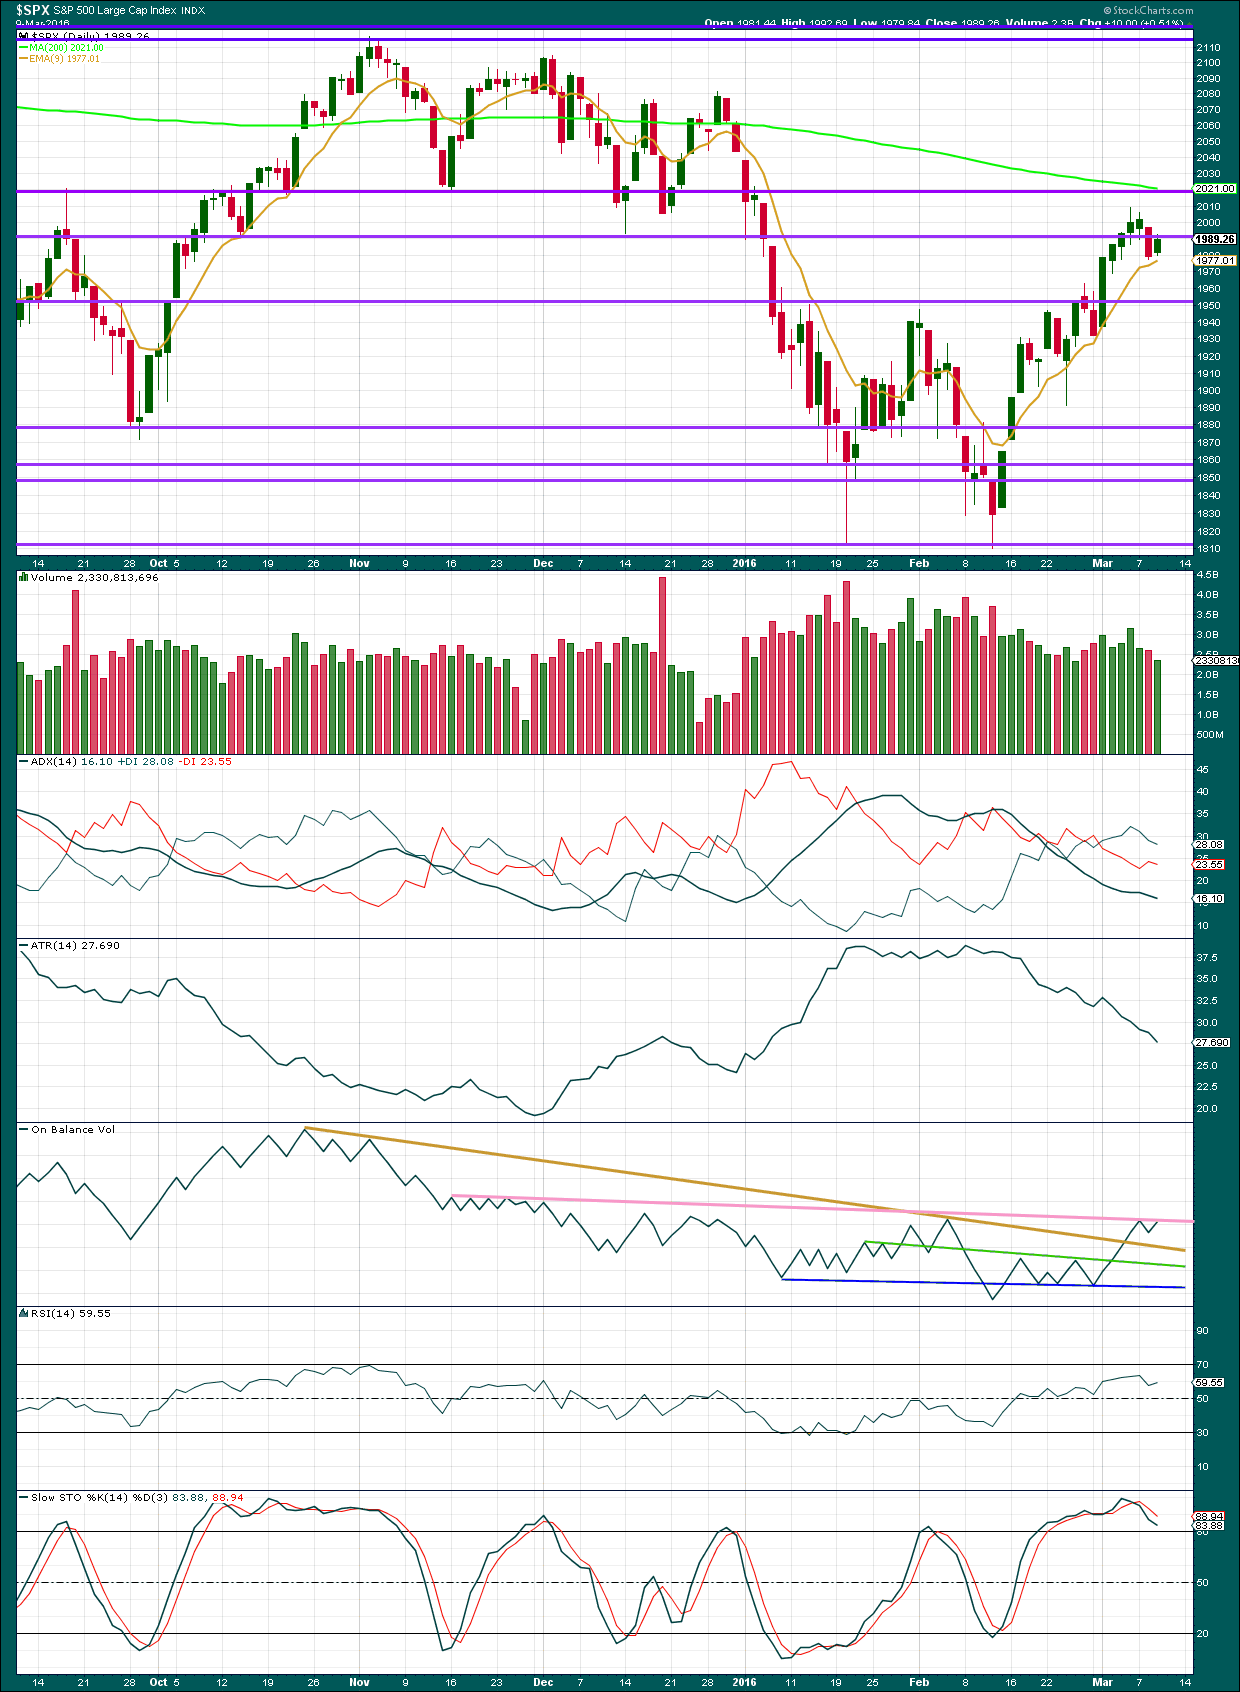
Click chart to enlarge. Chart courtesy of StockCharts.com.
Volume data on StockCharts is different to that given from NYSE, the home of this index. Comments on volume will be based on NYSE volume data when it differs from StockCharts.
The small upwards day for Wednesday comes with lighter volume from both StockCharts and NYSE. There was not support for the rise in price, so it is suspicious. This supports the wave count.
Price may have found some resistance today at the horizontal trend line about 1,990.
ADX and ATR are still in agreement. The market is not trending; it is correcting. At the least, this agreement between these two indicators puts doubt on any analysis which expects to see strong bullishness. If this upwards move in price for the last eighteen days is a new bull market, it is not supported by trending indicators.
On Balance Volume has come again to touch the pink trend line. This line is highly technically significant because it is long held, repeatedly tested and almost horizontal. This may assist to hold upwards movement here.
RSI is well above neutral. There is plenty of room for this market to fall.
Stochastics needs to return from overbought. A range bound approach would expect some downwards movement about here to continue until Stochastics reaches oversold and price finds support.
DOW THEORY
For the bear wave count I am waiting for Dow Theory to confirm a market crash. I am choosing to use the S&P500, Dow Industrials, Dow Transportation, Nasdaq and I’ll add the Russell 2000 index. Major swing lows are noted below. So far the Industrials, Transportation and Russell 2000 have made new major swing lows. None of these indices have made new highs.
I am aware that this approach is extremely conservative. Original Dow Theory has already confirmed a major trend change as both the industrials and transportation indexes have made new major lows.
At this stage, if the S&P500 and Nasdaq also make new major swing lows, then my modified Dow Theory would confirm a major new bear market. At that stage, my only wave count would be the bear wave count.
The lows below are from October 2014. These lows were the last secondary correction within the primary trend which was the bull market from 2009.
These lows must be breached by a daily close below each point. So far the S&P has made a new low below 1,821.61, but it has not closed below 1,821.61.
S&P500: 1,821.61
Nasdaq: 4,117.84
DJT: 7,700.49 – this price point was breached.
DJIA: 15,855.12 – this price point was breached.
Russell 2000: 1,343.51 – this price point was breached.
This analysis is published @ 08:13 p.m. EST.

They are already spending billions to keep European futures from going into free-fall. They don’t have the carrot of a Draghi announcement to keep the bulls fat and happy so they are going to have to dump tons of cash…and then dump lots more….
USD:CHF looks like it might be about to embark on a serious dive lower (in favour of CHF) for anyone thats interested in wealth preservation / diversification away from USD.
I’m expecting this is the start of a fairly long term trend downwards (over a year)
The bottom of a 15 year cycle has now also turned in favour of CHF so it might end up being a long term top – albeit I’m no expert on cycles.
I think USD will do pretty well against some other currencies (like GBP) so holding CHF might well be rocket fuel against currencies other than USD.
It would not suprise me to see GBP:USD close to 1:1 at some point looking at the long term EW chart. I’m also hoping NZD against USD continues downward so I can pick up a nice pad in NZ (when property cools down a bit) 🙂
NZ seems like it would be a good place to shelter from the coming global storm. It would be nice to find someone willing to part with a few acres. I could do my own pad building… 🙂
Loads of lots for sale online (lots of lots 🙂 )
Bit pricey though atm (albeit nothing compared to BVI). Few years will cool it off – plan to rent until then.
Renting also a good way to check out where I might want to buy / local bargains etc. In no rush to buy another place yet (though also in no rush to sell – would rather have an asset than the digits in a bank – even if it takes a hit (which it will), I can still enjoy living in it).
My pad in IoM in great location but still expect it to take a 50% haircut before this thing is over
You are right. In another year or so you are going to be able to pick up some nice properties for pennies on the dollar and that militates against new construction right now. I expect even in NZD properties will be available for below new construction cost. My problem is I am a stickler for privacy and would be interested in a lot that was not actually a part of a planned sub-division and that is extremely hard to find in most places for a reasonable sum. My property on the Ridge Road is wonderfully isolated so anyone within several hundred meters of my place would have to be somebody I knew or an interloper! 🙂
“Loads of lots for sale online (lots of lots ”
A lotta good that’s going to do me back in the US! 🙂
Put my toe in the water with UVXY again – 20% position.
Just in case Mr Market decides to gap straight through our confirmation points tomorrow.
Overhead invalidation not too far away from here and ‘all instruments are green’ (as we say in aviation during takeoff rotation)
Yeah…it’s still kinda hanging out in the weeds…waiting to see the explosive gap and go out the gates but the banksters are doing their utmost to hang on to DJI 17,000.00. This could go on for a few more days unfortunately….
That’s one really BIG DOJI on the daily chart!
The last time we had a DOJI like this on a daily chart was Jan. 11th, 2016. And very hard to find one similar before or after that… not sure though what it signifies…
On its own, it really doesn’t signify anything much.
A balance between bulls and bears. That is all.
A doji on its own is not necessarily a reversal indicator.
Joseph,
How is today’s volume compared to last few days?
Hmm… this is only a wave up II 3-3-5 or 5-3-5 right? Thoughts? I am still short NDX100 coz that’s a market behaving more rational and more bearish… 😉
See my comment below – exp. flat ??..
Testing the under side of the Trend Line drawn from ES 1802.50 to ES 1886.25…
Last Kiss?
Yep…. Goodbye! I think.
Three, three, five zig-zag off the bottom?
I think its the C wave of an expanded flat – which might now be over
These 5 wave moves from a low or a high (expanded flats with B making new high / low) used to catch me out every time…. not on my watch Mr Market!!!
Provided we close green their work for the day is done….
Olga,
It looks like you got your green day. But I am not sure why that makes a difference. Please elaborate. Thanks
They are paid to keep up appearances – was nothing more than that.
I got it. Thanks.
I don’t know that B wave sorta looks like has 5 waves within it… might be 3 but not good looking , but good news is I count 5 waves down from the futures high of 2011 today! :))) Just my 2 cents, a ii up now and tomorrow the real plunge lol…
I count the B as a pretty good zig zag with a small c wave within it on the 1 min
1min chart (zoomed in on the B wave). How much better looking yer want? 😉 🙂 🙂
A little lip stick maybe
Uhu… Could be, I had a micro i instead where you got the micro iii, if this dives down overnight you will be correct! Still holding ndx100 shooort as whatever happens I do not expect it to make new high! It already topped a week ago in 2nd and 4th of march with an almost perfect double top- just few points! 😉
NO fear in the market with a 300 point swing in DJIA from overnight through this afternoon!
VIX basically flat!
Bulls thing ECA and Fed have their back so they are not worried. People thing like that this time are FOOLS!
What happened to edit? Think ECB – Thinking
I hate to say it, but it looks like 5 up off the recent low. Could be the first wave of another 3 wave correction forming, but today’s low could have also marked the end of the fourth wave, with a final pop higher still to come.
Don’t forget that C waves are 5’s (and B waves of flats can make new highs / lows)
If we get a 3 wave structure down now then I’ll take a bit more notice.
Personally not too fussed either way as SOH right now albeit it’s getting boring again 🙁
Yes well looks that way on the sp500 but check the NDX100 where it does not! that went below any wave iv invalidation and so did the german DAX ! 🙂 Oh and also today the low at 1268 is below the high of 26/02 which was at 1271 if you count futures!
nooo! it’s only going up again!!
Hello Lara,
What preferred hourly count is the best to use?
Thank you very much!
Peter
Main bear.
Olga, I think the solution to the correction is a double zigzag. Within doubles there is no rule which states an X wave can’t make a new price extreme.
But TBH I think there should be such a rule.
But then I also don’t think that I should be a person to start writing new Elliott wave rules, making it even harder and more prescriptive.
Either way, the upwards wave we saw today looks like another deep second wave bounce. And now we have only two overlapping first and second waves, followed by new lows (five minute chart) and earliest price confirmation.
Todays whipsaw illustrates clearly why price confirmation and invalidation is important and needs to be made before making a call on direction or wave count. The deep upwards move did not make a new high so the alternate bear idea of a single zigzag moving higher was not confirmed (and I didn’t provide that price confirmation point, I’ve realised I assumed you’d all understand, sorry, my bad)
Then price turned around to provide earliest confirmation of the main bear count.
The alternate idea of this being a fourth wave and price still to make new highs has further reduced in probability today. It will be eliminated by price below 1,962.96.
Many thanks for the update Lara
Hi Olga –
Any view on the DAX? That looks like a market ready to implode, much more so than SP or FTSE.
Hi Alison,
I don’t follow / count DAX (I have enough trouble with S&P, PMs & Forex! 🙂 )
It would seem that DORIAN-CATALIN does??
I think that most (western) markets will take a dive together but that is pure speculation on my part.
Thanks Olga – Dax is interesting as it appears at to be at the epicentre of ECB V Deflation.
6% swing today… That is the type of trade I would like to be on the right side of.
Thank you
Ali
Well, I don’t trade the DAX that much just rarely coz the swings are much bigger then on the sp500 or ndx100 which i usually trade. I am thinking tho to trade this tomorrow 🙂 The DAX has a clear 5 wave down like a carbon copy of the sp500 till the low in 11th of february. AFter that a clear wedge correction which can be labelled in many ways from an elliot wave point of view which broke in a very nasty way today! However the wedge did not even retrace 50% of the decline that started last year, compared to US which went above 61,8 and the decline already retraced more then 38,2 compared to US – not even 23,6 today. So that’s a crazy market! On the 5min chart some 5 waves can be counted already. I think we get a wave (ii) up now-tomorrow on both US and german Dax…. unless it is a B but the DAX should continue correct even lower. SO basically look for a 50-62% up move now (if it goes more then 76,8 usually on dax it means something else so stop there is good ideea)… and then i would expect a continuation lower towards the 61.8% complete retrace which stands at about 9200!
Edit: DAX might still need a 5 of 5 down tomorrow before B or (ii) up tomorrow-next week…. 🙂 No confirmation, it did not move up much last 1-2hours while the US did!
Thanks dorian – You are a STAR!
Watching closely first thing to scope out a day trade.
Thank you
Ali
“But then I also don’t think that I should be a person to start writing new Elliott wave rules, making it even harder and more prescriptive.”
Any why not?! May I politely ask. There is no one I have seen more able imo. 🙂
I could I guess.
But I’d want to do a fair amount of research first, gather some numbers over a reasonable period of time.
I’m writing my own EW book which will have some guidelines. But I’ll not make them rules unless I have a sound evidence based reason to do so.
It’s the science geek in me. I need evidence, numbers, facts.
I just have 1 question, Lara. Before the US open, the sp500 did make a new at 2011 right where i put my stop for a very small position. Guess i was a bad trader today on sp500 or i can say: bastards! :))) Anyway i got back in action lower and today made a winning day. Now the question is: does not this high matter that was done in europe session? Also the DAX ended its uptrend at 10k at the same time which i think really matters, coz when US opened the dax was 1.3% lower already in like 5mins, after which the real plunge happened. I was thinking maybe we can consider that high as the last 5th wave of the C of the alternate bear count? And so, start the bear count from this high? What do you think? 🙂
No.
I’m only using the cash market data for the NY session. I get the data from the NYSE via BarChart.
After hours data does not factor into the wave count. Nor does futures data.
And it doesn’t matter what any other market is doing. Elliott wave sees each market as standing alone, even though they do often have correlations in reality. Those relationships change over time.
Each market has its own wave count.
Here we go as the folks digest the latest act of desperation by ECB.
http://www.marketwatch.com/story/the-fear-factor-in-global-markets-2016-03-10
I find it easier (less emotional) to totally stay away from news etc when I’m trading tbh.
Didn’t have a clue what all the fuss was about this morning until I saw some of the comments below LOL 🙂
Me too. I don’t normally look at it after the fact either.
I have better things to do with my time… like watch surfing videos if the waves here are flat 🙂
todays action brings a song to mind,,,” Slip slidin away,, Slip slidin away”
“You know the nearer your destination the more you’re slip slid-ing awa-ay!” 🙂
sing it Verne,, now lets all dance and have a whoop de doo
April 15 UVXY 56 strike calls with a delta of only .23 at under two bucks can help you pay your 2015 taxes! 🙂
(Targeted for my 10X upside trade with a conservative ten contracts.)
Yer pay tax???!!! Get back to BVI ! 🙂 🙂 🙂
(just noticed you wrote *your* taxes 😉 🙂 )
Bingo!!! 😀 😀 😀
(You gotta love those IBCs you can incorporate in the BVI!)
Ah right – nuff said!! 🙂
We play a similar game in IoM
Presume as you were born in BVI you never lose your ‘belonger’ status?
I wasn’t born in IoM so would lose it after 2 years of being non-resident (there it is called Manx Worker status). Takes 5 years of residency to get it back (or it did – not sure nowadays) – need a work permit without it.
Yep! Born and bred! I discovered I was also eligible to apply for an EU passport but with a possible Brexit, that may go the way of the Dodo bird. Not sure Europe is going to be a place I want to be anytime soon….
I had a similar offer of a US passport (well Green Card – but taxation wise it is the same thing).
I politely ran away screaming like my hair was on fire 🙂
(btw – absolutely no offence meant to any US people on here – I realise citizenship / patriotism is a subject very close to people’s hearts 🙂 )
Hyuk! Hyuk! 😀
But seriously, people are actually renouncing their US citizenship at a sky-rocketing rate. Even with the new 3000.00 application fee and an exit tax confiscation of 30% of your assets over 2 mil. All because of FATCA!
Yep ‘exit tax’ – totally baffles me.
And kinda proves my point….
Don’t get me started about FACTA!!!
I see that parts of US is becoming a tax haven because is now the only country in the world that doesn’t have to comply with FACTA (or anyone else’s rules).
Yer can’t make this stuff up.
O.K. I won’t. 🙂
OH! The irony of it all!!
New Jersey takes the cake. They don’t report nothin’ to nobody, including Uncle Sam…
May I ask what FACTA is?
Fair and Accurate Credit Transactions Act
Or (imho)…… a way for US government to blackmail financial institutions with large fines if they don’t report US persons on their books – so to ensure that people who have not lived in US for 20 years (but have not renounced their US citizenship) pay tax (and back taxes) to Uncle Sam.
But as usual it is used much more widely than that in the fight against ‘terror’. It has locked US persons (or anyone connected with US) out of alot of financial institutions as they do not want the hassle of compliance. I would argue it is a capital control in that regard.
US (naturally) does not comply with it nor with anyone else seeking information about their own citizens with funds in US institutions.
Only 2 countries in the world tax based on citizenship – the other country (Eritrea) most people have never heard of.
I did say “Don’t get me started about FACTA!!!” 🙂 🙂
Foreign Account Tax Compliance Act.
If you don’t know about it, odds are you don’t need to worry about it. 🙂
Yep – that as well. More than one way to skin a cat I guess 🙂
I get hassle from my bank just for having a US phone number
(which is a VOIP number – not geographically based anywhere near US).
I have a pad in Florida – but that address stays well away from my bank manager (and IB) otherwise the hassle would be immense (and I make sure I do not get caught out by the ‘significant presence’ test 🙂 – 4 months a year is enough for me)
That’s why I don’t know… I have no accounts outside of the USA nor have I lived outside of the USA.
I would agree… Its not right to have that tax. I pay close attention to new tax law and proposed tax law… but I don’t remember seeing that anywhere.
When did they sneak that into the tax code?
2010 (for FACTA) – US taxing based on citizenship has always been the case as far as I am aware??
see link for info straight from the horses mouth….
https://www.irs.gov/Businesses/Corporations/Foreign-Account-Tax-Compliance-Act-FATCA
If you ever choose to live or have assets outside US, this could become a very big deal (and possibly a big problem) for you.
Needless to say – as per my initial point, that’s why I avoided a green card like the plague (as the rules apply to US persons – including green card holders and citizens)
I had a long chat with my broker about the entire matter and it does appear as long as the funding for the account comes from an account in the name of the IBC, that is sufficient to avoid the blood sucking vampire squid, fondly knows as the IRS… 🙂
They are pretty good in the BVI about maintaining the privacy of owners of these instrument despite enormous pressure from the US and the UK…so far…
Many foreign banks will no longer accept US customers because of this statute. I read somewhere the global cost to institutions of compliance and it was in the multiple billions, and the “recovered” taxes a few hundred million. The Chinese along with the Russians are determined to give the global financial community an alternative to carry out international transactions without all this thuggery. Most folk don’t realize that this is what is really behind all the US sabre-rattling when it comes to our relationship with both countries. It is why they destroyed Libya. So sad! 🙁
Hourly ES has closed below it’s 200 DayMA of 1977.61 and is 1971.75 right now.
This tells me and it looks to me like ES will continue to fall this afternoon…
So SPX 1962.96 will be taken out!
Looking for a bounce at 1966ish…100 day SMA on SPX.
Sold my calls too soon…I am such a WUS! 🙂
I’ve sold 50% of my UVXY position from this morning. Will sell rest a bit closer to 1962, then go all in if we go below there.
Got a simple trendline from todays high to the top of that short bounce – if we go above it will cash in the rest of my chips.
Mr Market aint gonna do me no harm today 🙂
If we go below 1962 and stay below 2009, I’ll be riding this wave all the way down – the word pig doesn’t even come close.
Mr Market and I got some old scores to settle – yessir.
I got a few extra bazookas if you REALLY want to go postal with Mr. Market!
🙂 🙂 🙂
UVXY sneaking higher – we’re currently butting right up against that trendline I mentioned.
Seems someone is getting nervous – bout time indeed.
Was absolutely robbed on that initial 50% sale. At least Dick Turpin wore a mask…
It’s quite a ways to the top of the upper BB. Hanging on for the ride higher with rest of positions…
Sold remaining 50% – I’m now SOH awaiting 1962 price confirmation.
If we get a clear confirmed 3 wave bounce, I might take another scalp position.
The paint is getting wet again… time to get our hands dirty 🙂
Playing with paint is so much fun, ain’t it???
No! 🙂
This count would resolve why some indexes (and futures) made new highs (B in a flat can go beyond start of A).
I think it is lower probability as some of the subdivisions are a bit dodgy but deserves consideration if we start going higher before price confirmations are met.
Don’t jinx the bear pls! Just take a look at the DAX, that bull looks terminated 😛
Just keeping an eye out for y’all 🙂
Can you believe DAX was up over 2.5% overnight??!!
Those banksters are somethin’ else!!
I don’t think that works. Within your expanded flat the end of B must be minimum 90% of A. At its end I think that one is less. But part of the triangle moves beyond A so it can’t be a zigzag, has to be a flat.
I’m working on a solution.
Yeah – I agree
Some members noted that other cash markets and futures markets made new highs before the open.
I did the count to resolve that (assumed B was longer than shown in S&P cash), but I thought it might be a bit of a stretch.
Bounce a lot shorter than anticipated. Look for acceleration as the buy the dip crowd scramble for the exits. The banksters could still make a big cash dump to arrest the decline, but it looks as if the QE gamble is a bust…
Quick double on UVXY 30 strike calls picked up at UVXY @28.85…the disconnect between a healthy fear of what lies ahead and option pricing persists…..
Break of 1974.90 will confirm five down, three up…
Some caution is advised until we hit confirmations imho. This whole structure from 2009 could still prove corrective.
The blast dowwards today could be a C wave. Lower probability maybe but still very possible – todays high important in that regard.
I agree. UVXY will signal a more protracted move higher with a bearish engulfing candle, generally taking the two previous days’ lows…
WTI -0.95
Brent -1.21
Punching through cyan short term trendline.
New 5 day low. Looking very bearish…
Now bouncing up.
Probably will follow the trendline down.
Todays (cash index) high is now an important line in the sand imo – albeit it is so close to other invalidations that it doesn’t help much from a trading / stoploss standpoint.
If we get a 3 wave bounce then we might be able to place a stop a bit lower.
This rejection at SPX 200 with a strong downside move is really strong evidence of the main bear count. If 1977 breaks it will not be far to 1962 and strong confirmation the 3rd of the 3rd is underway.
I have opened a short position for about 1/3 of a full position. I am using TVIX.
That should have said the rejection of SPX 2000. Sorry.
VIX looks very complacent today. It’s time for them to bend over!
200 Day MA on the hourly just penetrated. Was 1977.26 on ES. ES low today 1974.75
ES Low now 1973.75
I do not think for one second that markets follow the news, but I would absolutely love for these CB jokers to be held responsible for crashing the market.
Just as they bask in the glory of the market blasting higher (when it would have anyway) – what goes around…..
Olga,
That will happen once the markets crash. These folks have been behind the curve and continue to deny that…time of reckoning is fast approaching…
One sign of waning bankster influence is when the crowd no longer buys the QE propaganda. It is evidence that folk have decided that the banksters are impotent.
The next phase is when joe-six-pack concludes that they are also stupid and begins to take the expected action attendant to such a conclusion. For the time being, it looks as if the buy-the -dip crowd are still buying the old play-book based on the muted volatility response…but not for long…I am expecting one more “bankster bounce”…
Yep… they still believe in the propaganda!
Very close to 1974.08 1st confirmation… I think this attempted bounce fails and will break below 1974.08… I think today but don’t hold me to that.
I think today because the ES looks like it will break lower this afternoon…
1974.08 1st confirmation passed and NEXT IS… 1962.96
The “bankster bounce” would serve to fill out the developing bearish engulfing candle and give it the right profile emblematic of the classic reversal pattern…
Line in the sand fast approaching. Best of luck everyone
This is “”IT”” folks!
It is going to be swift and painful for many folks. I feel for folks who should be on fixed income investments but are forced into the markets due to ultra low interest rate.
It is not fair to them and in fact disrespectful based on how central banks are ignoring their fragile situation. These irresponsible actions are going to cause significant damage to the social fabric that folks will for years to come stay away from stocks.
They have basically ***** the USA savers (mostly the middle class-upper middle class) the last 7 Years and if they have their way with negative interest rates they will RAPE everybody else except the elites who are already moving out of the way.
Central Banks have done it through inflation for over 100+ years and now they are doing it in plain sight with near ZERO Rates and negative interest rates.
*Edit: I’ve removed that word Joseph. I would prefer it to only be used in its proper context.
Triangle wave (b)? Or maybe something more complex. Thrust upwards looks like could be from a triangle.
Lines in the sand remain the same – nothing changed. Paint still drying…
I can now count a small degree 5 down from todays high on 1min chart.
Loaded up on UVXY with stop at 2009.20 – we will hopefully soon know what Mr Market has in store for us.
Hello… you know spx futures made a new high today, right? on that ECB announce, on my platform in fact it shows 1210.9 for the spot sp500! As it is open during european sessions and asian aswell. I think that just confirmed the alternate bear count, but no ideea what the target up is or if even that was all of it . It would make sense if the spike up was wave 1 of 5 and this is 2 of 5 now… Invalidation would only come below the low on 08 march close! Also the DJI made new high short time after the US open. So what do you think?
I only use cash index to count EW as I have seen futures create invalidations a few times before (particularly wave 4 running into wave 1 price) whilst the cash index hasn’t and the cash index has proven correct. Sometimes forex does the same (maybe something to do with leverage?).
Not counting DJI so don’t know if that count would have allowed for new high but is maybe cause for caution. I guess we’ll soon find out either way – as you say, going below 1977 (or above 2009) will confirm either way.
UVXY currently indicating that we might be heading higher.
Nvm what I said! It seems market declining, DJi already went below the 08.03 low and the DAX germany confirmed too! Wow… amazing, I am short too now… hope this is it… 🙂 But… i do believe the decline must be counted down from the spike up today before the US open, that is when DAX hit 10000 and now tis 9500 already and the SP futures and DJI hit new highs, only index who did not was NDX!
NO invalidation for any of Lara’s Charts!
Soon… SUB 1974.08
and
SUB 1962.96
Draghi is lost..how can you state that Eurozone inflation will remain ‘Negative’ for months to come and yet say we are not in deflation. Isn’t defaltion when the inflation goes negative?
These ECB folks are a bunch of wild cowboys shooting at everything and hoping something sticks and stops the bleeding… clueless
He is not lost…he is a liar… 🙂
Draghi’s assertion that bank debt is being excluded from the QE purchases is a spectacular display of brazen mendacity. The only reason European banks are still operating is because of trillions funneled to them under the table by the ECB. DB is trading at lower evaluations than during the height of the financial crisis and is insolvent. It is truly amazing how clueless the masses are about the true state of affairs. The presumption of people like Draghi and his ilk, is that the majority of the investing public are complete imbeciles. He of course has the complicity of all the media talking heads. They may be correct. It may be kinder to simply consider them gullible…. 🙂
DOW Future have given up over half of the gains so far. Watching…SOH 🙂
What FOOLS these ECB hacks are…
They are trying to say that without their measures bank profitability would have been lower. That is the argument they are using to say that negative interest rates will NOT effect bank profitability!
What kind of MORON is going to believe that argument!
Wow…….. These people are absolutely INSAINE!
SELL EVERYTHING!!!!!!!!!
Why isn’t the press NOT challenging these ECB hacks on this??????
They must have been given some Gold before they entered the room.
ECB Today is trying to “prove they are NOT out of ammo”!
They have proposed a “Long List Of Measures to prove otherwise”.
ECB showing their manhood! A “Long List”!
NO… it just shows how desperate the ECB is!
WTI has just turned down…
WTI -0.27
Brent -0.48
Hey world… get out of Stocks ASAP… the elite insiders have been and are getting out!
Don’t be the fools left holding the bag… AGAIN! Beat the elites to the punch!
Jobless claims sink to lowest leve in 5 months, come on FED practise what you were preaching….
More data that the Fed is suppose to follow… They keep saying they are data dependent.
Therefore the Fed must follow the data dots that they themselves put out which show 4 increases in 2016… and act as they say which is Data Dependent and will raise Fed Funds Rate to 0.75% next week!
Looks like Alternate daily is in play.
We have no guarantee that either oil or equity prices will fall today. The Draghi induced ebullience may well last a few days and there are some SPX gaps in the 2000- 2050 area that may get filled. Probably a good idea to unload upside hedges at the open to be safe as an intra-day reversal is also entirely possible.
The Dollar gets stronger as the euro falls… Oil will fall… stocks will follow!
The dollar vs euro gets stronger… US multinational stock profits will fall further… stocks will fall!
That’s a fact!
Negative interest rates will be a disaster… stocks will fall!
More debt bailing out economies on top of the unsustainable debt that is already out there is a disaster = worldwide depression… stocks will fall!
Joseph,
Ditto, folks are not realizing that the earnings picture just got worst by this devaluation of EURO. Now I expect US FED to make no change but the damage is done and markets will react to it pretty fast as the assets are priced 6-8 months in the future.
Oil prices should start to fall this morning and stocks will follow after this brief spike up on ECB.
Negative interest rates are coming in a wide spread way… go get your cash out of the bank now… before everyone else figures out they are going to get screwed!
The ECB theatre of the absurd continues. Instead of “Whatever it takes”, Senor Drahghi now is assuring us that there will be “No limits” to ECB stimulus. Tell it to the Chinese. Mr Draghi may be convinced that he can usher in a no limits stimulus era, but he is about to learn that there is indeed a limit, imposed forcibly, if not voluntarily, to monetary insanity…
Vern,
This is a clear show of desperation by the ECB. Interesting to note that we have not heard from German’s on the latest ECB move. This is going to fail and push the economies further along the path of destruction.
Joseph,
I am waiting on GOLD to drop into this manic excitment to start add to my little physical holdings as this is getting very scary now.
Overall, if the markets starts to drop despite this complete non sense move by ECB, that will be a clear message to ECB “GAME OVER”.
Draghi’s actions is a perfect example of the definition of insanity; too bad he has apparently never read Einstein’s famous quote in this regard… 🙂
Lara
The subminuette wave i–from the hourly bear count on march 5th– doesn’t subdivide into a five or leading diagonal nor does the micro wave 1 on march 1st yet the overall form of subminuette c from the start of micro wave 1 does have the right look. My only conclusion is that when a count does not adhere to the rules perfectly do you look for form or the right look to achieve the correct count particularly on intraday charts where this seems to occur more often?
Subminuette i on March 5th does fit as a leading contracting diagonal. The only thing atypical about it is it lacks a small overshoot of the 1-3 trend line.
I stand corrected here. The subdivisions on micro wave 1 within subminuette i where unclear for me. Yet even though there is a lack of overshoot isn’t undershoot for the 5th wave also acceptable for a leading diagonal?
It meets all the rules. The important one for a leading diagonal is that the fifth wave may not be truncated. This one is slightly below the third, no truncation.
The overshoot of the 1-3 trend line is a guide line not a rule, not always met. That’s okay.
Micro 1 on 1st March also does subdivide as a quick short impulse.
All my wave counts will always meet all rules.
Elliott wave rules are inviolate. Which is why I have a big question mark about the ending diagonal to complete submicro (1) (first chart above, not this one). I think I need to consider submicro (1) ending earlier, or recheck those trend lines.
Why did you label February 29th as Micro 0 instead of c? Is that simply to indicate Micro wave 0 as the start of Micro wave 1? Since Micro wave 1 on March 1st gaps the subdivisions aren’t clear for me. Do I need to start counting the March 1st wave from the 29th low? How does Micro wave 1 subdivide into an impulse?
Ivy, don’t worry about the tiny subdivisions down to one minute chart level. It will drive you nuts.
Not all waves will have the perfect look at all times on all time frames. Especially for the S&P. The proportions between second and fourth waves within its impulses are not always even, sometimes one is bigger than the other which gives a five a three wave look.
Go with the time frame that looks clearest.
The 0 is because that chart only looked at that portion. It is the start of micro 1. That’s all.
I do not always keep a running copy of analysis of all subdivisions at the five minute chart level. I used to and came to the conclusion that it does not add anything of real value to the analysis and often is a big time waster.
I will often make a check of subdivisions at the five minute level if the hourly is not clear.
ok thank you Lara for taking the time to help me on this you have helped to clear things up for me. 😀
Over the last couple offsets leading into the ECB decision, things have been sort of quite. Volume dropping, VIX acting weird, frankly I was expecting markets to sell off into the decision so a bounce from the decision can happen and look natural. This is too quite but things are about to change tomorrow morning..,
Something unusual and interesting is happening in candlestick land. The number of new positive signals across all the markets is at a very low level for the past few days, and still decreasing. For instance, there were only 10 new positive signals across the whole AMEX today. Something going on here.
Hi 🙂
I missed it again 🙁
and I’m the turd in third
And I’m the froth in fourth…
Ok I just made that up 🙂
Tomorrow at 7:45 eastern we’ll get a clue how the day may turn out. That’s when the ECB announces… guessing overnight futures will be quiet until then…