The bounce continued higher towards the target as expected.
Summary: The bounce is continuing higher as a double or single zigzag. The target for it to end is 2,002 or 2,004. Confirmation the correction is over will first come with a clear breach of the channel containing it, and thereafter a new low below 1,931.88. The preferred wave count expects the next wave down to be very strong.
To see how each of the bull and bear wave counts fit within a larger time frame see the Grand Supercycle Analysis.
To see detail of the bull market from 2009 to the all time high on weekly charts, click here.
Last published monthly charts can be seen here.
If I was asked to pick a winner (which I am reluctant to do) I would say the bear wave count has a higher probability. It is better supported by regular technical analysis at the monthly chart level, it fits the Grand Supercycle analysis better, and it has overall the “right look”.
New updates to this analysis are in bold.
BULL ELLIOTT WAVE COUNT
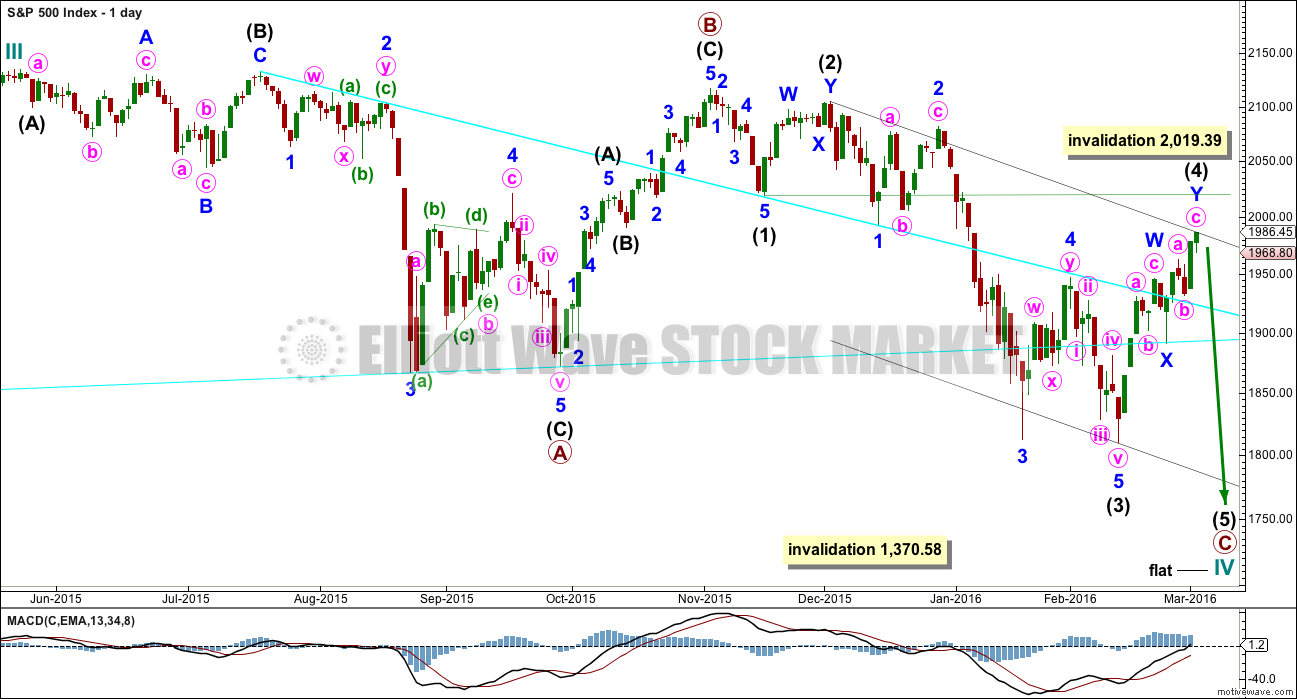
DAILY CHART – FLAT
This wave count is bullish at Super Cycle degree.
Cycle wave IV may not move into cycle wave I price territory below 1,370.58. If this bull wave count is invalidated by downwards movement, then the bear wave count shall be fully confirmed.
Cycle wave II was a shallow 0.41 zigzag lasting three months. Cycle wave IV should exhibit alternation in structure and maybe also alternation in depth. Cycle wave IV may be a flat, or combination. This first daily chart looks at a flat correction.
Cycle wave IV may end within the price range of the fourth wave of one lesser degree. Because of the good Fibonacci ratio for primary wave 3 and the perfect subdivisions within it, I am confident that primary wave 4 has its range from 1,730 to 1,647.
Primary wave C should subdivide as a five.
Within the new downwards wave of primary wave C, intermediate waves (1), (2) and now (3) may be complete. Intermediate wave (4) is continuing higher and may not yet be complete. Intermediate wave (2) will subdivide either as a single or double zigzag (as will intermediate wave (4) ). There is inadequate alternation between these two corrections, which reduces the probability that the current correction is a fourth wave.
When intermediate wave (4) may again be seen as complete, then a target may be calculated for intermediate wave (5) to end. It should move at least slightly below the end of intermediate wave (3) at 1,810.10 to avoid a truncation.
The idea of a flat correction for cycle wave IV has the best look for the bull wave count. The structure would be nearly complete and at the monthly level cycle wave IV would be relatively in proportion to cycle wave II.
HOURLY CHART
Again, there are two different ways to see this upwards movement. I will use the hourly bull and hourly bear charts to show both ways, and both ways work the same for both bull and bear wave counts (the degree of labelling is two higher for this bull wave count).
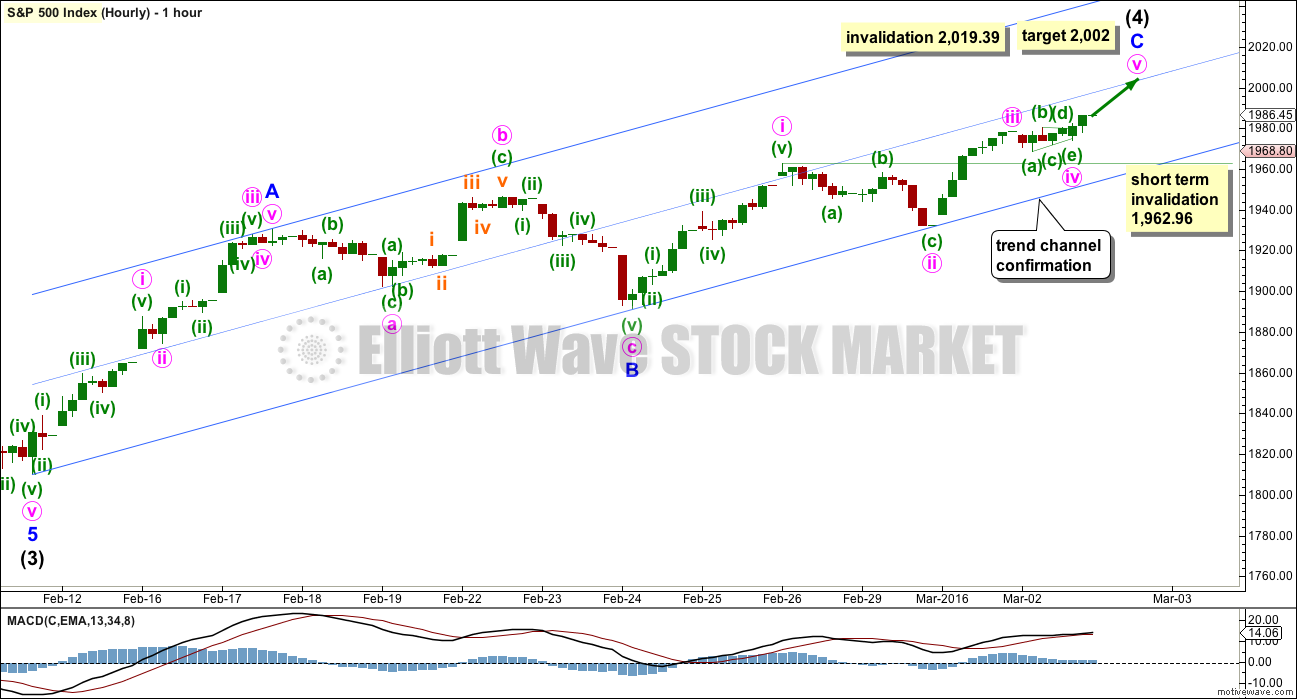
Upwards movement may be an almost complete single zigzag.
Within the zigzag, minor wave A subdivides as a five. Minor wave B subdivides as a three, an expanded flat correction.
Minor wave C is an almost complete five wave structure. Within minor wave C, minute wave ii is a zigzag and minute wave iv exhibits alternation as a triangle which fits perfectly on the five minute chart. This is a barrier triangle, which are often followed by short fifth waves.
Within minor wave C, minute wave iii is shorter than minute wave i. This limits minute wave v to no longer than equality in length with minute wave iii, so that the third wave is not the shortest and the core Elliott wave rule is met. The limit for minute wave v for this wave count would be at 2,020.62. This is above the invalidation point for the bull wave count, but not for the bear.
Within minor wave C, minute wave iii is just 2.07 points longer than 0.618 the length of minute wave i. At 2,002 minute wave v would reach 0.618 the length of minute wave iii.
On the five minute chart, there is a lot of overlapping within minute wave v. This indicates some more upwards movement as likely to resolve the structure of minute wave v as a five wave impulse.
If minute wave iv continues further, it may not move into minute wave i price territory below 1,962.96.
DAILY CHART – COMBINATION
This idea is technically possible, but it does not have the right look. It is presented only to consider all possibilities.
If cycle wave IV is a combination, then the first structure may have been a flat correction. But within primary wave W, the type of flat is a regular flat because intermediate wave (B) is less than 105% of intermediate wave (A). Regular flats are sideways movements. Their C waves normally are about even in length with their A waves and normally end only a little beyond the end of the A wave. This possible regular flat has a C wave which ends well beyond the end of the A wave, which gives this possible flat correction a very atypical look.
If cycle wave IV is a combination, then the first structure must be seen as a flat, despite its problems. The second structure of primary wave Y can only be seen as a zigzag because it does not meet the rules for a flat correction.
If cycle wave IV is a combination, then it would be complete. The combination would be a flat – X – zigzag.
Within the new bull market of cycle wave V, no second wave correction may move beyond the start of its first wave below 1,810.10.
I do not have any confidence in this wave count. It should only be used if price confirms it by invalidating all other options above 2,104.27.
BEAR ELLIOTT WAVE COUNT
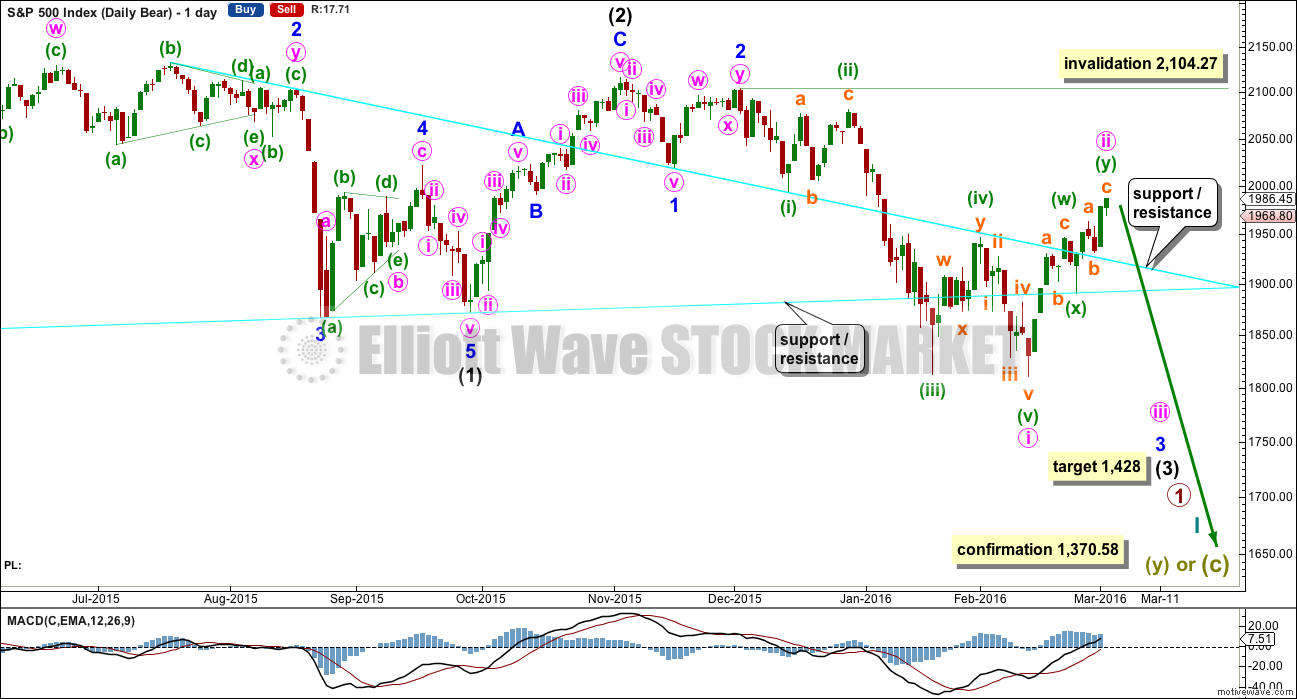
DAILY CHART
This bear wave count fits better than the bull with the even larger picture, super cycle analysis found here. It is also well supported by regular technical analysis at the monthly chart level.
Importantly, there is no lower invalidation point for this wave count. That means there is no lower limit to this bear market.
Downwards movement so far within January still looks like a third wave. This third wave for intermediate wave (3) still has a long way to go. It has to move far enough below the price territory of intermediate wave (1), which has its extreme at 1,867.01, to allow room for a following fourth wave correction to unfold which must remain below intermediate wave (1) price territory.
Intermediate wave (2) was a very deep 0.93 zigzag. Because intermediate wave (2) was so deep the best Fibonacci ratio to apply for the target of intermediate wave (3) is 2.618 which gives a target at 1,428. If intermediate wave (3) ends below this target, then the degree of labelling within this downwards movement may be moved up one degree; this may be primary wave 3 now unfolding and in its early stages.
Intermediate wave (2) lasted 25 sessions (not a Fibonacci number) and minor wave 2 lasted 11 sessions (not a Fibonacci number).
Minute wave ii has now lasted thirteen sessions, two longer than minor wave 2. This still allows the wave count to have the right look even though it is not longer perfect.
Minute wave ii may not move beyond the start of minute wave i above 2,104.27.
HOURLY CHART
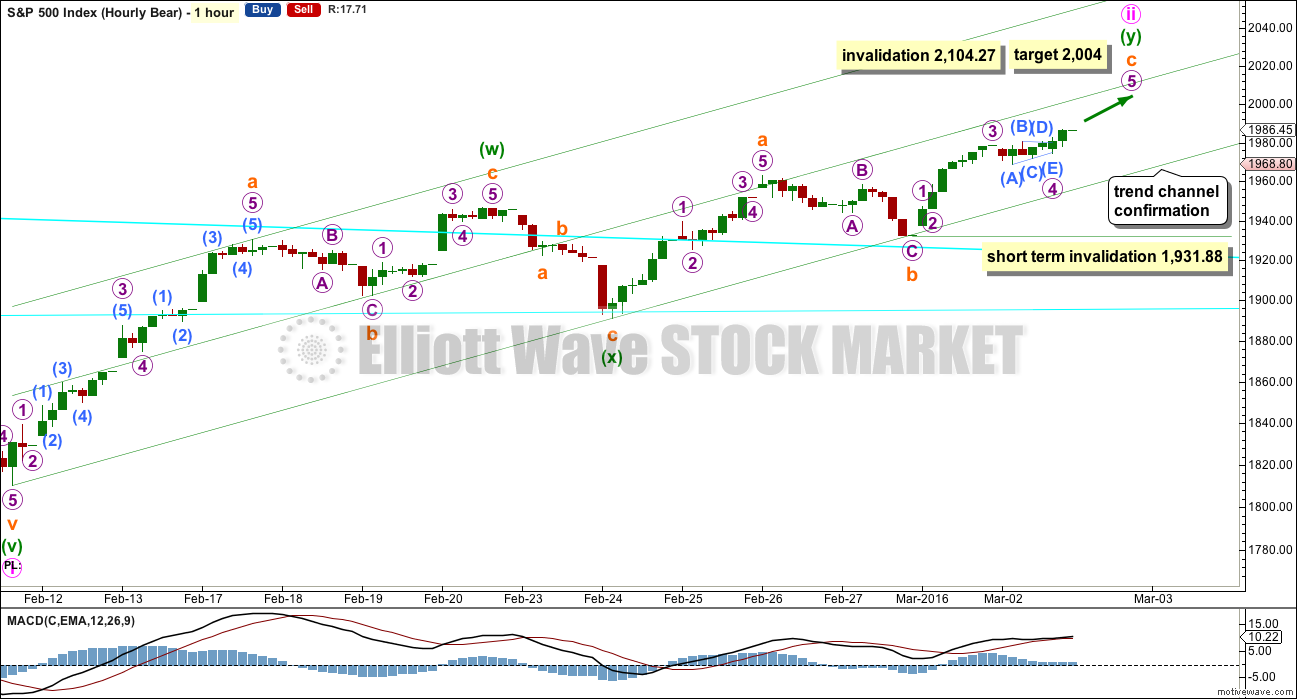
The first idea outlined on the hourly bull chart also works in the same way for this bear wave count, and vice versa.
At 2,004 subminuette wave c within the second zigzag would reach equality in length with subminuette wave a.
Within subminuette wave c, no second wave correction may move beyond the start of its first wave below 1,931.88.
When the trend channel about this correction is clearly breached by at least one full hourly candlestick below and not touching the lower trend line, that shall indicate the correction may be over. A new low below 1,931.88 could not be a second wave correction within subminuette wave c, so at that stage subminuette wave c would have to be over. A new low below 1,931.88 would provide price confirmation of a trend change.
At that stage, the only way that the correction could continue would be a very rare triple zigzag. The rarity of triples (I have only ever seen three) means the probability of more upwards movement at that stage would be very low indeed.
Within subminuette wave c, the final fifth wave of micro wave 5 looks incomplete. On the five minute chart, there is too much overlapping at this stage for it to look complete, so more upwards movement is likely to resolve the overlapping into an impulse.
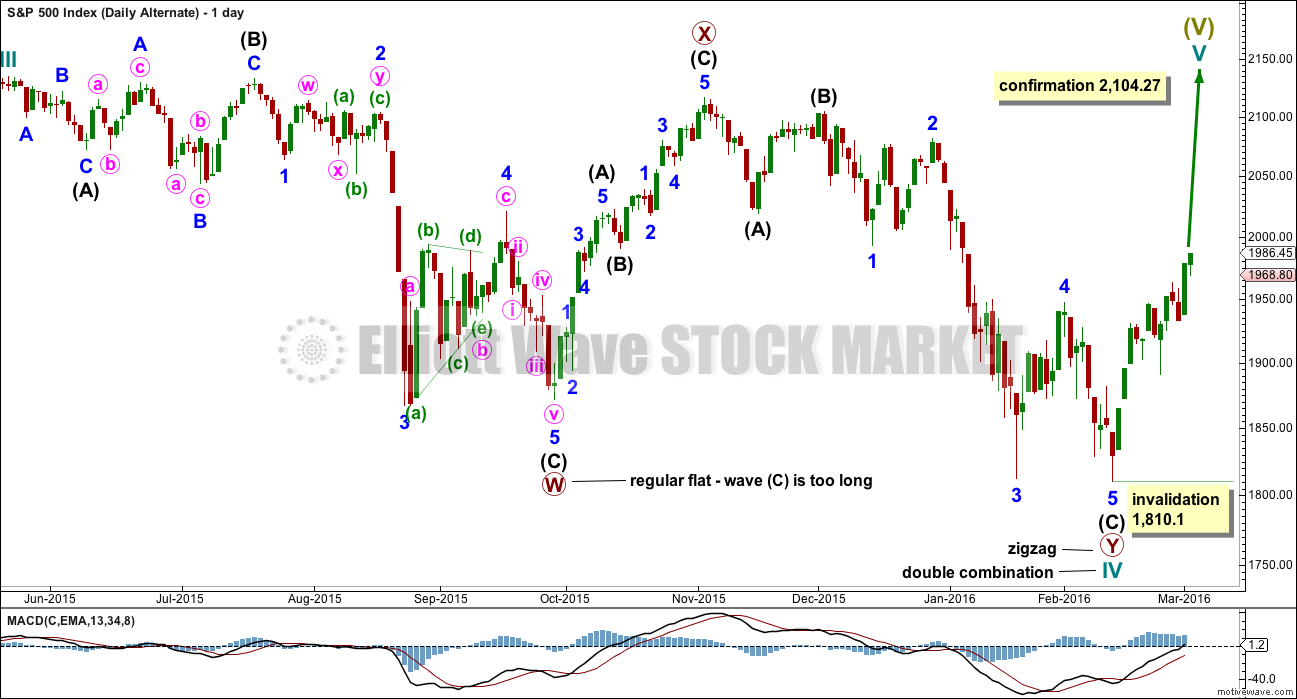
ALTERNATE DAILY CHART
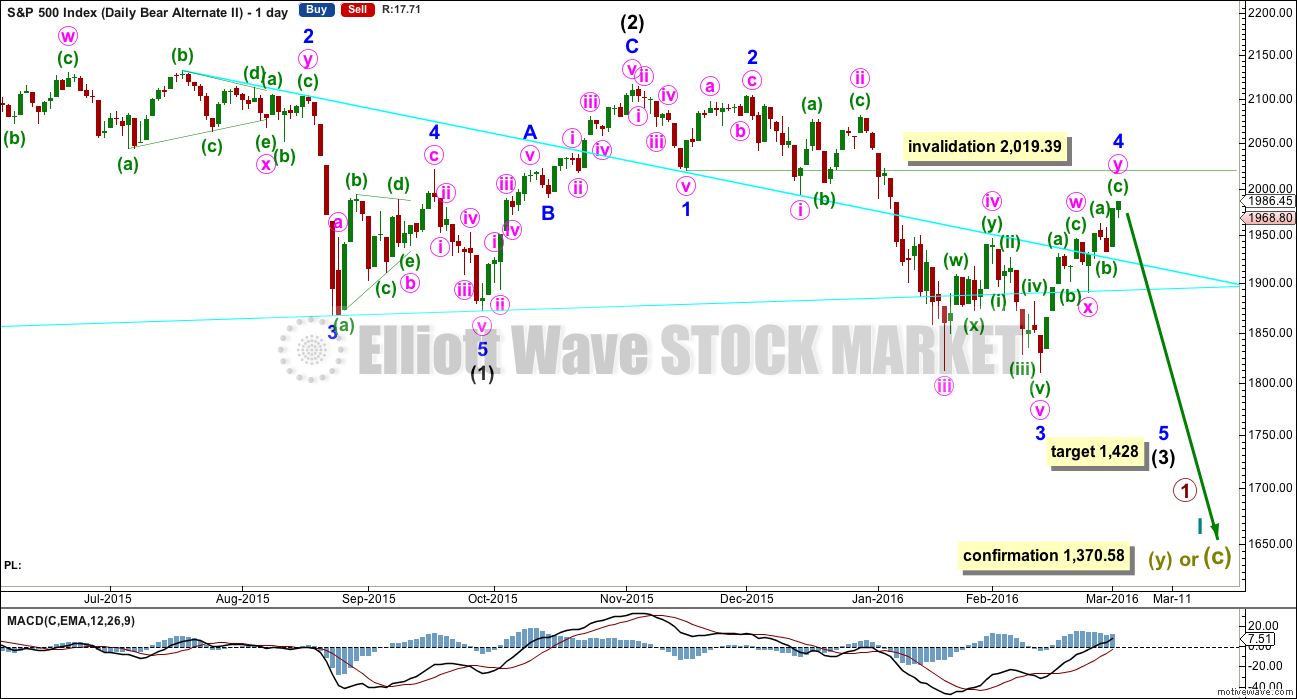
I have previously noted this idea in the text and now it is time to chart it, so that the implications are clear.
Within the downwards impulse unfolding, it may be that intermediate waves (1) and (2) are complete and now minor waves 1, 2 and 3 may also be complete within intermediate wave (3).
This wave count expects minor wave 5 to be extended within intermediate wave (3). Minor wave 5 should also show a strong increase in momentum, so that at its end intermediate wave (3) has clearly stronger momentum than intermediate wave (1).
There is no difference to the target for intermediate wave (3). This wave count makes a difference to the invalidation point. Minor wave 4 may not move into minor wave 1 price territory above 2,019.39.
This wave count also has a lower probability than the main bear wave count. This wave count would be more typical of commodities than the S&P.
Minor wave 2 lasted eleven days. So far minor wave 4 has lasted thirteen days and it may be incomplete.
TECHNICAL ANALYSIS
DAILY CHART
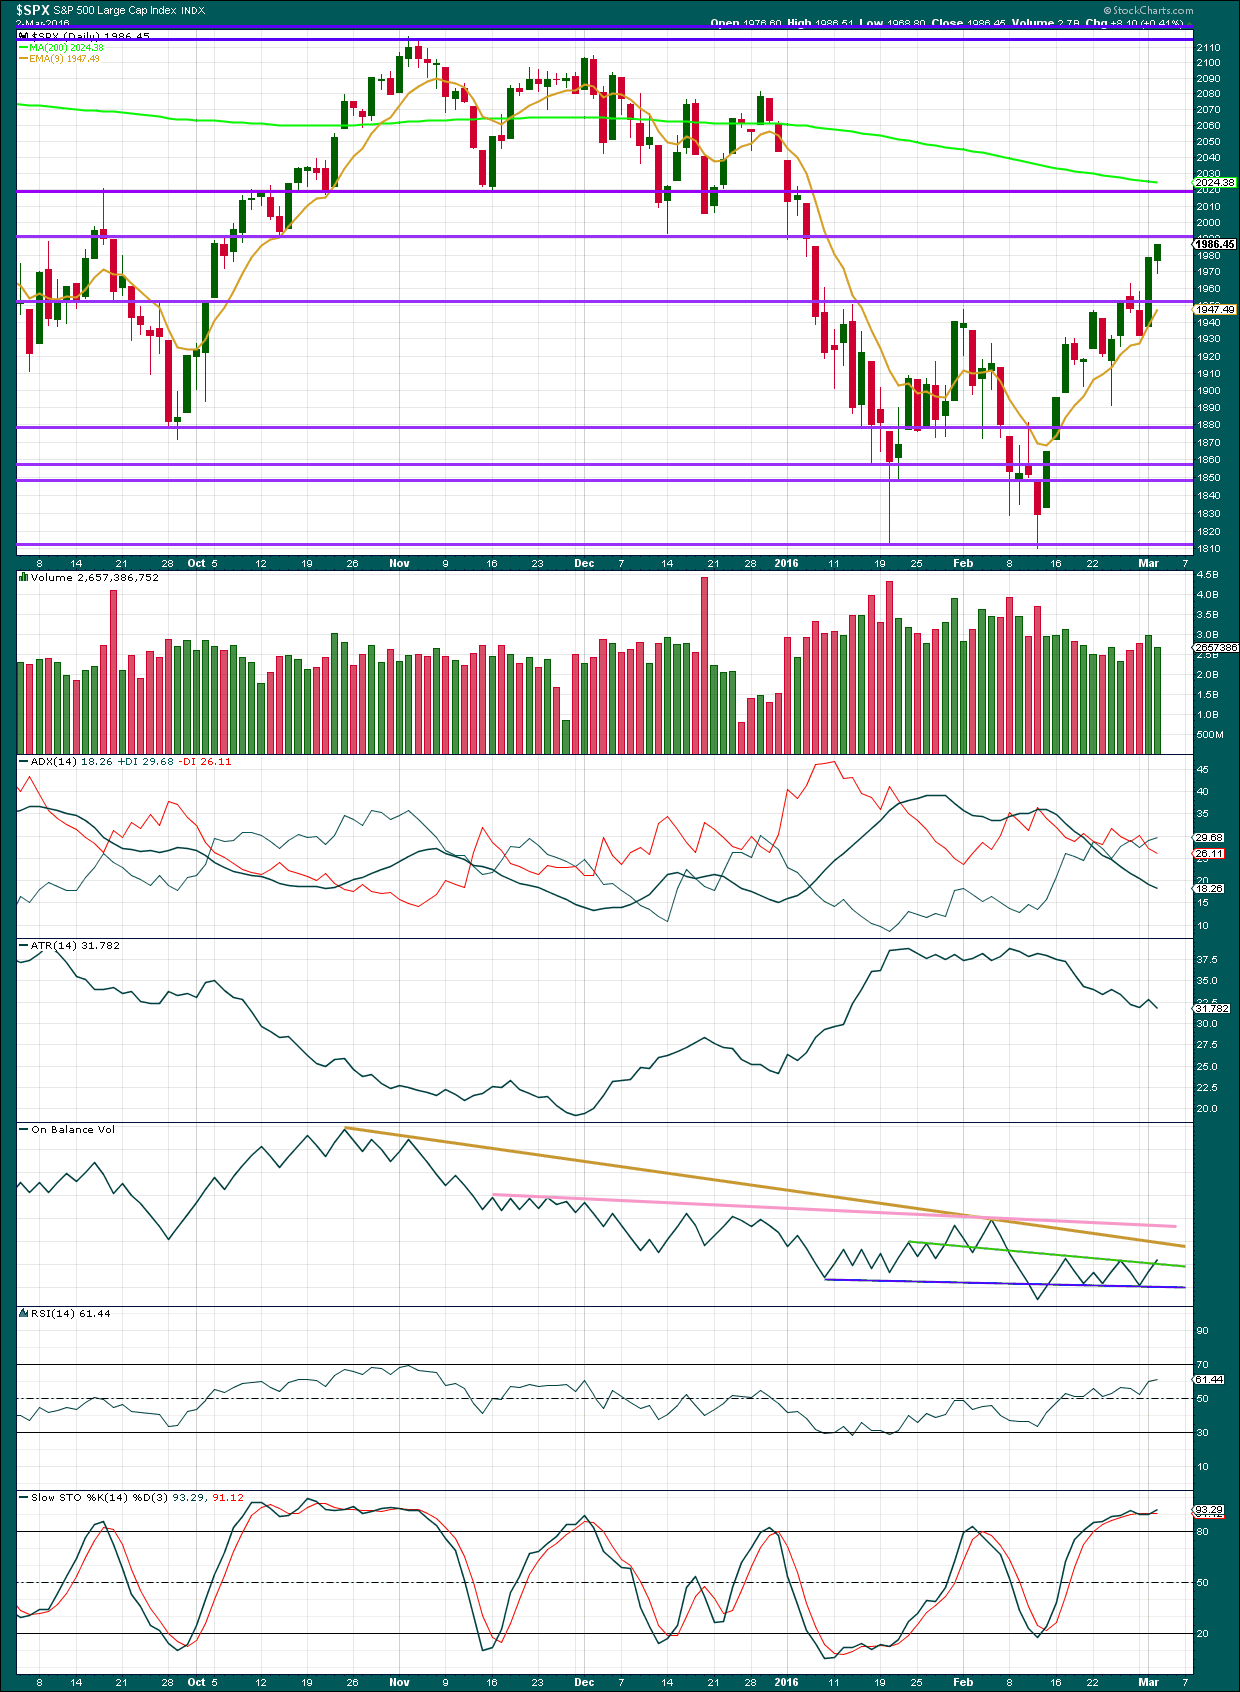
Click chart to enlarge. Chart courtesy of StockCharts.com.
Volume data for today on StockCharts is suspicious. This volume is not the same as that given from NYSE, the home of this index. Therefore, I will go with source data from NYSE. I will check volume data from NYSE daily from here on.
Price has moved to new highs on declining volume for two days in a row now. The rise in price is not supported by volume. Each time we see this a bear market rally is in progress and not the start of a new bull market. This supports the Elliott wave count. It does not tell us that the rally must end here and now, but it does tell us the rally is weakening and should end.
Overall, from the start of this rally to today, volume is declining.
The next line for resistance is about 1,990. 2,000 should also offer some resistance as a very round number.
ADX still indicates the market is not trending; it is consolidating. If a new trend resumes here it would be upwards: the +DX line is now above the -DX line.
ATR is still overall in agreement. It is flat to declining overall. This indicates the market is consolidating.
On Balance Volume is breaking above the green trend line, which is not serving to hold price down as expected. The next line to offer resistance has more technical significance. The brown line is longer held and should offer stronger resistance. A new pink line is drawn which is also long held, tested more often, and almost horizontal. This line offers the strongest technical significance. If OBV comes up to touch that line, it should bounce down from there.
This bounce has returned RSI to above neutral allowing plenty of room for price to fall. There is no divergence with RSI and price.
The slight weak divergence with price and Stochastics disappeared. This is why I don’t give much weight to Stochastics divergence unless it is large and obvious. Stochastics is overbought, so so upwards movement may be expected to end soon.
DOW THEORY
For the bear wave count I am waiting for Dow Theory to confirm a market crash. I am choosing to use the S&P500, Dow Industrials, Dow Transportation, Nasdaq and I’ll add the Russell 2000 index. Major swing lows are noted below. So far the Industrials, Transportation and Russell 2000 have made new major swing lows. None of these indices have made new highs.
I am aware that this approach is extremely conservative. Original Dow Theory has already confirmed a major trend change as both the industrials and transportation indexes have made new major lows.
At this stage, if the S&P500 and Nasdaq also make new major swing lows, then my modified Dow Theory would confirm a major new bear market. At that stage, my only wave count would be the bear wave count.
The lows below are from October 2014. These lows were the last secondary correction within the primary trend which was the bull market from 2009.
These lows must be breached by a daily close below each point. So far the S&P has made a new low below 1,821.61, but it has not closed below 1,821.61.
S&P500: 1,821.61
Nasdaq: 4,117.84
DJT: 7,700.49 – this price point was breached.
DJIA: 15,855.12 – this price point was breached.
Russell 2000: 1,343.51 – this price point was breached.
This analysis is published @ 08:45 p.m. EST.

http://timeandcycles.blogspot.ro/2016/03/raj-time-and-cycle-review-and-forecast.html
Hi guys, I think we get a top soon maybe tomorrow-today! Check the diference between the UStech100 and the sp500,dija,dax even. You will find the Ustech100 already has a bear pattern I am counting 1-2-1-2 in a series of lower lows and lower highs unless that brakes up tomorrow and ends up being another wave b…… On the sp500 however, there is some kinda weird looking ending diagonal for last wave 5 I think which stil has some waves to go up…. This is my chart, what do you think Lara? Am finding alot of truncations lately just like on gold… 😛 I am already short starting with a small position but on UStech100 only with stop at m2… Should I worry or keep it till tomorrow? Thank you!
Oh btw, I am not Raj! Just follow his work for some time now, he usually gets the timing CITs right, but not always, he had 2 misses last year and 1 huge miss this year as he called for a bottom around 10january and it came 10 days later lol . However, when he posts a date, things usually happen within a few days if not that day. Check his last post, that turned out to be right. So I am hoping this time we have a major high +-2 days > take care all! 🙂
As long as you manage risk in that you’ve set your stop to allow this market room to move, and you’re not risking any more than 3-5 % of your equity on the trade, it should be okay. However, what you are doing is trying to pick the top. Not a good idea generally. Waiting for confirmation is much better.
Thank you, Lara. I know but I’m risking barely 1% or so for this trade till tomorrow so yea… 🙂 However, not only my analysis but my intuition too tells me I am right. If that ever works… :))) And I made some profit on gold today anyway so I can afford a small loss. But … I’ll try close it at brake even if I don’t see a magnet down to a lower low till tomorrow after the open on nasdaq that is which as I said behaves more bearish then sp500 for past 2days…. At today’s close , position has a very small loss tho…. 🙁
Brilliant.
Sometimes intuition is on track. Particularly when it feels.. unemotional. If that makes sense.
My warning about risk is always given, mostly because this membership has a wide range of trading experience. And so for the more experienced traders if I give that warning it is general only. I must give it regularly, to try and get the most important message across to less experienced traders amongst us.
That chart looks good.
Since I cannot post charts, I will attempt to explain what I am seeing so you can check it out. All my comments are regarding the SPX on the daily charts.
The period of time from the end of August 2015 to the first of November is being mirrored by the period of time starting from the middle of January. The price patterns are strikingly similar. The MACD seems to be playing out the same course now as it did back in August-November 2015.
A couple of implications are presented, if this is actually going to play out fully. First of all, notice the histogram on the MACD has not peaked. It appears to me in most recent situations, the histogram peaks before MACD peaks and turns down. The implication for today is that since the histogram has not peeked, the MACD has a ways to go to the upside. In addition, if the Aug-Nov 2015 the pattern is being replayed today, price has a ways to go on the upside as well.
We are now above several daily moving averages which have some cross over to the upside. The 100 day ma is roughly 2000. The 200 day ma is roughly 2025. It is possible that this second wave correction will touch and kiss good-bye to the 200 day ma.
We also have the open gap on the daily chart at roughly 2050.
Importantly, we have no channel line breach on the hourly and certainly not on the daily.
I suspect tomorrow will be more of the same thing.
Hi, in my opinion 2050 is possible but I expect a plunge down 1st in wave X and then up in wave Y. I see 1900-1910 1st then maybe a chance for 2050-2060 why not? Np we can short better from those levels, no? I do doubt this scenario however and favour a major plunge to new lows starting right about tomorrow… But right now the charts show a very nice and almost completed pattern of wolve waves! The target for that is around 1900ish, unless the pattern fails( would have to blow thru 2020 for that like tomorrow… ) Whatever happens, 1880-1900 seems a major support for bulls right now! 🙂
Rodney,
What do you think about the action of SQQQ today? Nasdaq was up 0.09%, and SQQQ was also up 0.58%, where it should have actually gone down about 0.3%…
Also the Ask prices on call options for September expiration shot up from $3.50-$3.60 on $22 and $23 strike prices to $5.90-$6.00 from yesterday to today! I tried to bid on some Sept calls, and didn’t get any. Instead I got some June 22 calls… But I rather give myself more time…
Just wondering your thoughts…
Hi ari.
SQQQ is based on QQQ not the nasdaq. QQQ was down 0.19%. SQQQ is a three times leverage inverse ETF. So the fact that it was up 0.58% is right on target.
I do not trade options and have little experience with them. Verne is the expert on options and such.
Good luck.
A close above 2000 in SPX and 17000 in DJI would be imo quite bullish in the immediate term. If that happens I am going to assume the minute two count will be firmly invalidated and that we are in a higher degree correction; particularly since minute two has now exceeded the time duration of minor two. A close more than 3% above those round numbers could mean an even higher than minor degree move up underway. UVXY also signaling bigger correction than minute degree. Futures providing no insight so far but might before the the open.
Right up to the infamous round number pivots. I was actually expecting a slight penetration to the upside…
I can see now submicro (4) and (5) complete.
Submicro (5) a nice perfect impulse too.
That could be it, but we need confirmation.
I have done Nasdaq. It will be proofed and published shortly (to remove my grammatical errors and make sure I’m making sense!)
I have to travel today up to Russell in the Bay of Islands. So analysis will be early. I’m starting as soon as Gold is done. I’ll update the regular TA when I arrive in Russell.
Do you offer a bundles of your services?
? combined with Gold?
No. That’s the first FAQ
Be safe in your travels. Have fun too.
Thanks for the updates and as many say, for intraday updates. In many ways, I really appreciate these slow and somewhat uneventful days.
Is that it???!! A peck and a promise?? I got robbed on those calls I tell ya! (Even if I’d held onto ’em). 🙂 🙂
It was till yer said that! 🙂
Ooopsie! 🙂
about 400 million in volume on the S&P as of right now
Well… this is really a nothing day isn’t it.
Very light volume so far. I still can’t see micro wave 5 up completed. I still think it needs one slight new high…. and as I type there we have it.
Okay, now the structure could possibly be complete. This is what I have so far for the five minute chart.
The big green question mark ? is because I’m not convinced submicro (4) is over. It would be very brief in comparison to submicro (2). But (2) was a double combination and (4) is a zigzag. Zigzags are normally quicker than combinations. And this is the five minute chart. Proportions just aren’t always right.
I just love that barrier triangle for micro 4. It’s perfect.
Fifth waves to follow barrier triangles are either very short and quick, or very long extensions.
In this instance with overbought signals and weakness in upwards movement I’d expect it to be short and quick.
And to add further to my comment with the chart…
The last high could have been submicro (3). Move it up to the next small high on the five minute chart. And so now submicro (4) and then (5) to one final high…. also fits.
and that depends on whether or not one counts the small correction I have on my chart as minuscule 4 within submicro (3); if it’s counted then it’s all over now. if it’s not counted then we need a fourth and fifth wave to complete the structure.
A nice price point for the absolute earliest confirmation could be the high of submicro (1) on my five minute chart at 1,982.38. A new low below this point couldn’t be a fourth wave correction within the final upwards fifth wave, and so at that stage the fifth wave should be over. Especially if we accept the barrier triangle and a short fifth wave out of it.
Many thanks for the timely update Lara!
You are all most welcome.
Watching the end of this bounce is very exciting 🙂
I’m such a geek.
You’re a EW Ninja!
https://www.youtube.com/watch?v=NGhyL8zg3_I
Yep! Yep! Yep! Nice move up out of the wedge. Need to spike out then reverse immediately. This is the moment of truth. Too bad I got stopped out of those calls. Needed to give a bit more wiggle room. No worries; was a small stake… 🙂
UVXY is not playing along so much with this currently upwards movement atm.
Just bought a small amount at 29.02 and still in profit even though market now moved a bit higher
I may be a bit early but scooping up June 30 strike calls…. 🙂
I’m monitoring the structure of this next move down like a hawk 🙂
Above 1990.03 right now and we’re probably still heading higher imo.
Should be able to exit again with no woulds if I was too early.
By the look of UVXY people seem to be a tad more nervous right now
Perhaps….
Think I might have rushed it a little…
BTW – I think yesterdays high could be (i) in the above chart – poss in (b) of (iii) now or (maybe (iv) already), but giving it plenty of time.
Nearly burnt once with this today. If it’s correct we should get a nice 1-3 trendline throwover as per the above.
And here’s the one at Gold’s recent low. The overshoot was really small.
In my experience I notice that contracting diagonals often have a really small overshoot of the 1-3 trend line.
It’s surprised me before. I’ve expected a bigger overshoot which didn’t come.
Here’s one from the S&P at the all time high.
I’ll find the other one on Gold that was the low….
Wow – Tricky!
Suppose the first you know is when it has took off and left you in the dust.
Could we have just had a tiny wave 4 and 5 otherthrow – or is that a bit too small?
I’ve jumped the gun once already today!…
(members might wanna take note of that gold chart – Lara just shared something mega important with you there imho – he he 🙂 )
With the S&P after that ending diagonal it just kinda moved sideways in a horrible chop for over 60 days. By the time that chop was done I had it figured out, and expected that sharp drop down which happened.
And so when I saw the same thing on Gold (the tiny overshoot) after a little while I accepted it. Problem there was alternate wave counts, and I couldn’t see a resolution for a bullish wave count. That came from a member sharing someone else’s chart and when I looked into it more deeply it all fitted and resolved problems.
That came in time to publish before it was confirmed with a new major swing high (the bull market that is for Gold)
Hyuk! Hyuk! Let’s keep it just between us dwarves! 🙂
Market really coiling. The size and shape of this wedge portends an explosive move….
BB bands on UVXY NOT contracting so when the move up starts and the bands explode, price is going to have to travel a ways to break through the top…
More on negative interest rates…I think 3rd wave is approaching real fast
Here’s how Bill Gross views it:
The negative interest rates dominating 40% of the Euroland bond market and now migrating to Japan like a Zika like contagion, are an enigma to almost all global investors. Why would someone lend money to a borrower with the certainty of getting less money back at a future date? Several years ago even the most Einsteinian-like economists would not have imagined such a state but now it seems an everyday occurrence, as central banks plumb deeper and deeper depths like drilling rigs expecting to strike oil, if only yields could be lowered another 10, 20, 50 basis points.
What is one to make of volatility price action that is decided bullish but not being borne out by a corresponding upward move in the market? Irrational Exuberance?!
I cannot remember ever seeing this kind of decline in the VIX in the absence of strong upward movement in the indices. So far NYSE only one in the green and that barely.
Yep – market down 0.5% – UVXY down 2.5%.
Either someone knows something we don’t or someone is very stupid
I loaded the truck at UVXY 30, with a stop at 1985.75. We might just be going sideways atm.
Looking for initial takeout of 1974.06 – albeit this still might morph into a larger corrective structure so still wary atm
Short term RSI divergence – took profits on half my earlier UVXY position. Gonna wait for 1974 to be taken out and things to clear up. Want to at least fall out of todays channel.
If this is still the same upwards wave then things are starting to look a bit out of proportion although S&P often forms wide tops.
UVXY divergence making me ultra cautious (when I possibly should be buying it with both hands???)
I can count 5 up in an ending diagonal (with quite short 4th wave, and classic 5th wave overthrow) from yesterdays low. Line in the sand is now 1985.75.
Current move might be a 1,2 or could be a 335 flat. Hard to tell if the first move down from todays high was a 3 or a 5 imo
Current move up looks corrective to me – added to my position with same stop.
PMs doing pretty well today (so far!).
GLD, GDX, and GORO calls doing quite nicely!
I am truly baffled by what is happening with volatility. UVXY is telling us that we should be looking right now at a fairly major corrective top. Considering the lows in January, it suggests a higher degree than minute. I have seen volatility and market price both move to the upside which is generally very reliably bearish. This kind of complacency in a declining market is something new. It could be they know something the rest of us don’t…then again…it could be hallmarks of GSC sentiment…
I was putting the price down to ‘2 x ETF slippage’ rather than the degree of labelling being wrong. I’ve not looked, but have a feeling that VIX itself is not lower than back then?
Market testing my nerve atm – this last move up sure looks corrective to me, but is it correctively gonna still make new highs (larger ending diagonal maybe)???
Stopped out – fortunately didn’t lose any money on this occasion.
Back to watching and waiting – gotta feeling I might be rushing an ending diagonal – maybe in W3 of ED now?
Verne,
I am thinking the upward sloping wedge / diagonal, is showing a distribution phase. The smart & big money is trying to unload in an orderly fashion. Perhaps this gives some explanation to the divergence in VIX and SPX etc. In fact, I am viewing most of 2015 as a distribution phase by the smart & big money.
Insiders have indeed been quietly exiting the last year or so. It really is amazing the indices are still trading at these highs. Lots of air pockets in the indices’ future I think…
Wedge formation still intact. On 5 min chart no real break evident imo…should come soon though…
Volume to 11:00AM is the lowest today… since Monday.
Due to the VIX being this low, it may be a good time to layer on more Leap options on the S&P, DJIA and/or other indexes to play a big longer-term move down. If you believe in the Bear counts.
Unless, you think the VIX will go materially lower than here. I don’t think it will go materially lower.
Just something to consider at this time for a strategy.
Hi Joseph. My view of the upper limits is 2050 or so. But I am not sure that is what you mean by materially higher. For anyone using options, I think your idea about using LEAPS is a good strategy and I do think we are early in a bear market price wise.
Materially Lower from here in the VIX… is what I meant.
Meaning option premiums in general have come down… good time to buy leaps on the equity indexes playing them short (inverse etf’s) before VIX moves higher again and premiums get expensive.
I have added June UVXY 30 calls at 8.50
UVXY approaching January lows and doing so on tepid upward price action. Makes one wonder if the implied bullishness is warranted. Resolution should come in the AM today.
Volatility really heading South…big move ahead?
Very interesting VIX in the green, UVXY in the red. We should see a final move higher…
On the SPX daily chart, the 13 day ema has crossed over, moved above, the 34 day and 50 day moving averages. This is bullish at least short term and gives me some concern. I guess one could say, I am moving back into the short term (from days to a few of weeks) neutral to bullish camp.
We may see one more downward correction to the 1960’s with a final sharp upwards move to 2020-2050 range. This plays well with the wedge scenario. Perhaps even a false break out below 1960 exciting the bears only to see it evaporate once again as the final leg up materializes. The gap at 2050 and the 200 day moving average right around 2040 seem to be acting like magnets.
Yep. I can see that scenario…I think the move down is a head fake…
I agree, I think up to a reversal zone around 2020 then down.
This weeks Hurst cycles show the peak around March 9th. Not anything to pin your hat on but it fits with the other technicals.
Stopped out. Wanna bet it turns right around and heads higher? 🙂
Lose a battle, win the war. Good job sticking to your plan and cutting the loss!
Punching through the upper Bollinger as we speak 🙂
Who? What? Where?
If there is any BB punching going on I want in! 🙂
UVXY still looking for a bottom. We should see some green shortly. I will be happy with a 15% pop on those calls. 🙂
Heck…I’ll even take 10% 😀
Oops! On five minute chart we actually have five down. May be time to ditch SPY calls at 45% haircut. Below 1977.40 will do it. 🙁
Three waves down. Close to stop but not quite.
Break of 1978.10 means mini five down.
Of late, triangles of one form or another has been a recurring theme. If the pattern holds, we should expect another thrust up out of the current formation to complete the move, with a swift reversal. Here’s hoping I can redeem my SPY 199 calls on the last pop.
Top o’ the morning! 🙂
Didn’t see you picked those up – savvy trading my friend!
Here is some technical analysis on the wedge:
http://slopeofhope.com/2016/03/possible-fail-area-just-above.html
Thanks David! A good read.
Regarding the StockCharts.com volume for $SPX, below is a response I got from their support team when I asked about the apparent discrepancy. Not sure what to make of this answer. Intuitively I would expect there should be some type of market cap weighted formula to calculate volume for the index, since the index price itself is a weighted average calculation using the prices of the component stocks.
Cole replied
Mar 2, 8:29pm
Hi Joshua,
There is no “official” volume data reported by S&P for the S&P 500 index. Many sites simply report some other market volume value. We actually take the time to add up the volume values for all of the individual stocks that make up the index.
Thank you,
Cole Johnson
http://stockcharts.com
http://stockcharts.com/support
Joshua Barnett replied
Mar 2, 6:31pm
I am trying to understand the volume data for the $SPX. The volume numbers that are reported on your site seem to be much different than what I see on many other websites. Your data is typically in the range of 2.6 billion, and other sites report the volume to be around 700 million roughly. Can you please explain this?
Thank you
Josh Barnett
Thank you very much Josh for looking into that!
I agree. If price can be accurate then surely volume can be too? A cap weighted formula applied in the same way?
At the end of the day I think I’m going to have to keep referring to NYSE. It is after all their index and so I am making the assumption that their volume data should be the most accurate.
But I see what StockCharts are doing. A simple arithmetic addition of all volume.. not weighted… may be why their data is different.
Folks,
There are others who are noticing the trading volume carefully
Full story http://www.marketwatch.com/story/wall-street-trading-volume-signals-stock-rally-isnt-sustainable-trader-says-2016-03-02
Sadly, quite a lot of the trading we are seeing is being done by machines that are increasingly focusing on high valuation , high momentum stocks (like PCLN), as volume elsewhere dried up . We had a preview of what this leads to with the thousand DJI point decline last August. Among them are the so-called FANG stocks. You can literally buy a put contract on any one of these time bombs a year out and walk away, returning one year later to collect ten to fifty times your investment. They are going to ultimately crash the hardest when the algos turn themselves off or start shorting ’em.
Ditto Vern,
Hence the reason I keep pestering Lara for EW on NASDAQ as can not ask for specific ones 🙁
Hoping that she is able to accommodate it sooner for us
These recent days with no price discovery are likely dominated by machines – we’ve seen that recently with price following a perfectly straight line up with abnormally uniform bid ask spreads. Humans are way more erratic than that. Hard to say when or where the cards get flipped and profit taking begins.
I have noticed the same thing with the recent price action. You can bet the switch is going to be sudden. It is a very dicey situation. I expect the downside moves to eventually become extremely violent for this reason.
Doing it now, charts only.
Okay, I think I need a few words too 🙂
I am reminded of something Elliott Wave International said some time ago.
Apparently a large brokerage house fired all their technical analysts just prior to 2000.
They used fundamental analysts only after that. Probably to their detriment.
This is because apparently in bull markets, and especially at their peaks, technical analysis declines in popularity. In bear markets it increases in popularity.
My theory is this: at the peak of a bull market over optimism and irrational exuberance dominate. Technical analysis is based in logic, numbers, it is rational. It is directly opposed to the mood of a bull market peak.
At this time the bull market still holds sway despite two strong falls and the Chinese markets crashing. I see irrational exuberance in the local NZ media, and I see many calls that stocks are cheap and to buy.
As technical analysts we are following the signals from volume. But I do think that overall we are still in a minority.
Lara,
Can you please explain what you mean by short term invalidation on the hourly charts?
Short term the price points on the hourly chart allow for the structure to continue to unfold upwards.
For the single zigzag (presented with the bull count) it allows for minute iv to move lower.
For the double zigzag (presented with the bear count) it allows for a second wave correction within subminuette c to move lower. This allows for the degree of labelling within subminuette c to be moved down one.
Short term if those price points are passed then the structure of the waves can’t be continuing higher, so must be complete.
The short term invalidation points therefore become confirmation points for a trend change.
Does that make sense?
Thank You… Yes
Where’s Doc? 🙂
Lagging,, (according to Lara),, that’s New Zealands version of late?
LOL
Yes, late.