Downwards movement for FTSE continues as expected.
Upwards corrections remain within the base channel as expected.
Summary: There may now be five overlapping first and second waves for FTSE. This indicates an explosive downwards movement may be ahead. The mid term target remains the same at 4,296. The risk is at 6,115.10, or the upper edge of the green channel on the daily chart. The Elliott wave count is supported by technical analysis.
To see monthly and weekly charts and the bigger picture see last analysis here.
New updates to this analysis are in bold.
WEEKLY WAVE COUNT
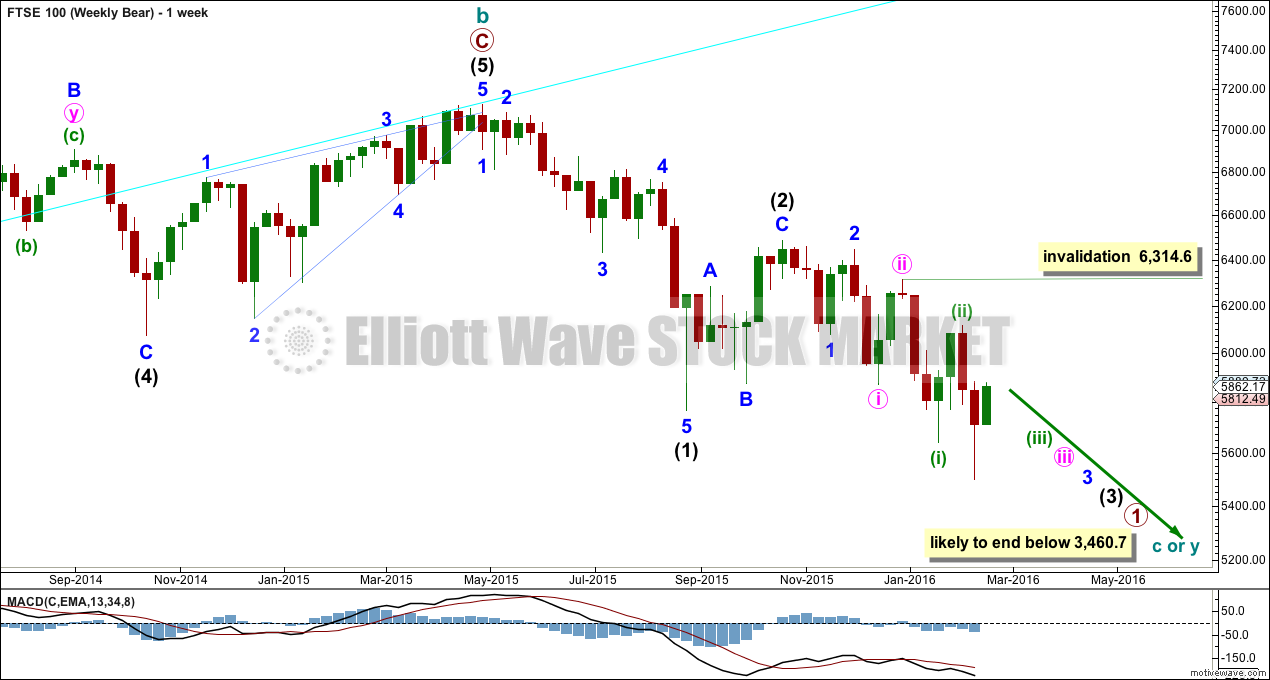
From the all time high in April 2015, FTSE has a five down and a three up. This current fall should move well below the end of intermediate wave (1) at 5,768.22 and then remain below that point. Intermediate wave (3) must move beyond the end of intermediate wave (1), far enough below to allow room for a subsequent fourth wave which may not move back into intermediate wave (1) price territory.
Price has now made a new low below the August low at 5,768.22. Downwards movement should continue.
DAILY WAVE COUNT
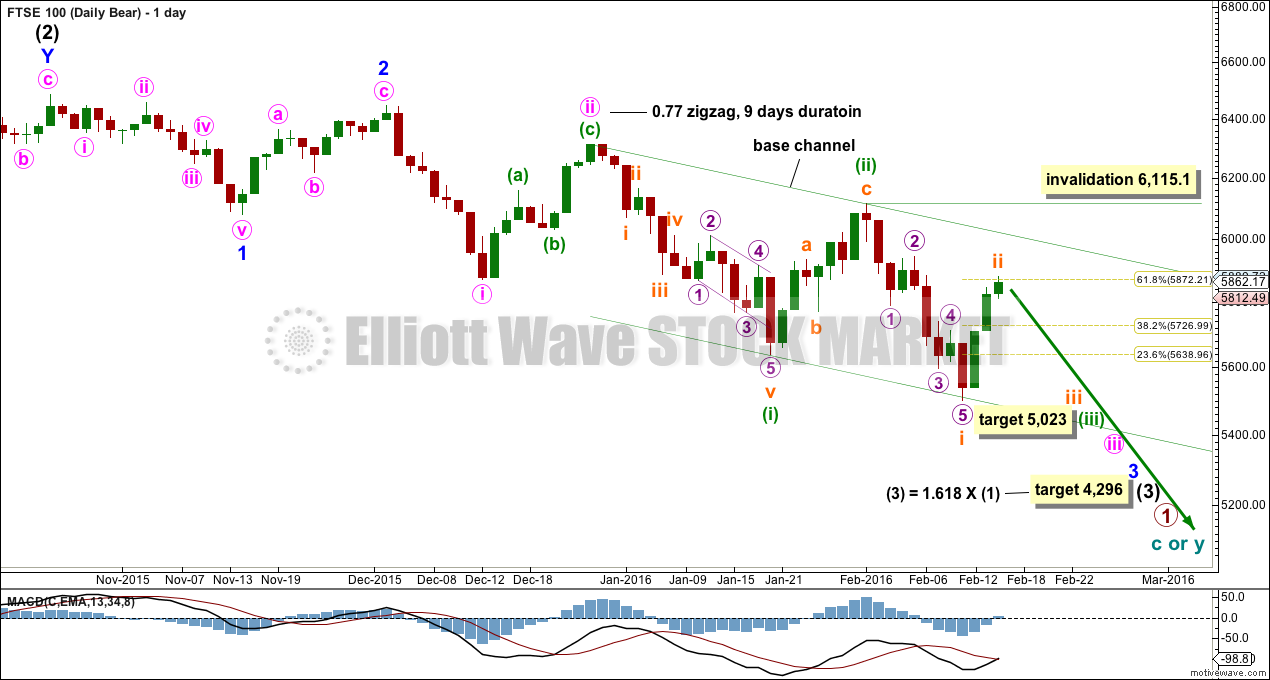
So far the middle of the third wave cannot have passed for FTSE. Upwards movement labelled minuette wave (ii) is back in minute wave i price territory. This cannot be minute wave iv, so it may only be yet another second wave correction if this wave count is correct.
Intermediate wave (2) lasted 42 days. Minor wave 2 lasted 11 days. Minute wave ii lasted 9 days. Each subsequent second wave is shorter in duration than its predecessor giving the wave count the right look. None of these waves are exhibiting Fibonacci durations.
Minuette wave (ii) may have completed in a Fibonacci 8 days total, reaching a little above the 0.618 Fibonacci ratio. A lower degree second wave correction should not breach a base channel drawn about a first and second wave one or more degrees higher.
Within minuette wave (iii), yet another first and second wave may be complete for subminuette waves i and ii. Again, subminuette wave ii is in the price territory of the first wave one degree higher, so this upwards movement may not be minuette wave (iv). If this wave count is correct, then this may only be yet another second wave correction.
Subminuette wave ii has reached up to the 0.618 Fibonacci ratio of subminuette wave i which is about 5,872. It would be very likely to end here. If it does end here, then it would have taken a Fibonacci three days duration. The pattern of each successive second wave correction being more brief than its predecessor should be expected to continue.
If subminuette wave ii continues any higher, then it should find resistance at the upper edge of the base channel drawn about minuette waves (i) and (ii), one degree higher.
So far the lower edge of the base channel is providing support. If price manages to break below this support line, then it would be confirming a big third wave should be underway.
The target for intermediate wave (3) remains the same at 4,296 where it would reach 1.618 the length of intermediate wave (1).
A shorter term target is calculated for minuette wave (iii). At 5,023 it would reach 1.618 the length of minuette wave (i).
If targets are wrong, they may not be low enough.
Of all the indices I follow with Elliott wave counts, FTSE remains the clearest bear.
TECHNICAL ANALYSIS
DAILY CHART

Click chart to enlarge. Chart courtesy of StockCharts.com.
There is no volume data on either the FXCM feed or StockCharts. Volume analysis is done from Yahoo Finance data.
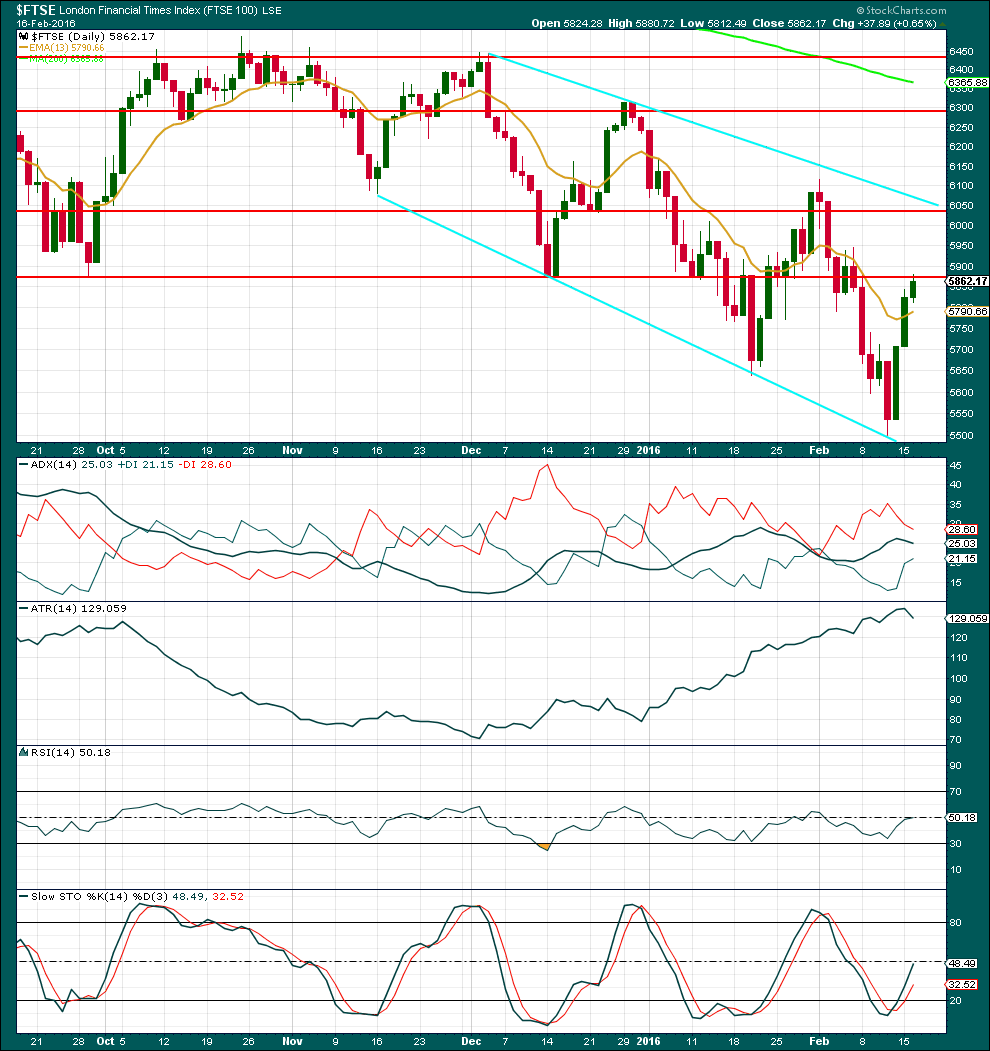
The volume profile for FTSE continues to be more bearish than bullish. As price fell to the last low of 11th February, it came with some increase in volume. The fall in price was supported by volume. As price rose on 12th and 15th February, it came with declining volume (Yahoo Finance volume data for 16th February is not yet available). This indicates the rise in price was not supported by volume. This supports the Elliott wave count.
The last three daily candlesticks complete a stalled pattern, a variation of three white soldiers. While three white soldiers is a reversal pattern, when the third candlestick is small and follows two tall white candlesticks (here they are green) then it indicates the power of the bulls is weakening. This pattern sometimes precedes a decline. This supports the Elliott wave count.
ADX is declining, so it indicates the market is no longer trending. It does not indicate there has been a trend change though; the -DX line remains above the +DX line, so if the trend returns it should still be down.
ATR is overall still increasing. This indicates the market is still likely trending.
The last three days of upwards movement from price has bought RSI back up to neutral. There is plenty of room for this market to rise or fall.
Stochastics is returning from oversold. There is some divergence between the last two swing lows in price and the corresponding lows on Stochastics: while price made a new low Stochastics made a higher low. This indicates some weakness in price. I have learned the hard way though to not give this divergence between price and Stochastics too much weight. On its own, it is just a weak bullish signal. There is no divergence between the high of 16th February and the last swing high of 1st February; as price made a lower high, so did Stochastics.
This analysis is published @ 10:17 p.m. EST.


In my analysis I’ve noticed the retraces have been around the 78.6% in each of the pull backs.my chart from Monday (I don’t have my software at hand) put this around c.6970.lara there have been successive 1,2s ,there seems to be a lot have you experienced anything like this before?
Sorry for the messy chart,it’s my personal trading chart for work time
Target should of been 5983 sorry ,I am on my mobile
Thanks Funky – just above that now.
Looks as though we may need to go back to the drawing board on this one.
Yes. This is exactly how third waves begin.
The middle of the third is extended, the middle of that third is extended, and so on like Russian Dolls.
And so it will necessarily begin with a series of first and second waves.
And every single time it does that members ask exactly this question and doubt it will happen.
It may not. I may be wrong. But for FTSE that is almost the only explanation I can see for now.
The only other explanation is a leading diagonal has finished and this upwards movement is a deep second wave correction. But the diagonal would have to be expanding and leading expanding diagonals are not very common.
Extending third waves are very common.
So based on probability that is still what I am expecting.
Hi Lara this is how I see it, however I don’t have much experience with leading diagonals, but this does fit far better with my crude outlook imo .
My WTI chart which I mentioned , this still has far more upside left with this idea if im right
Hi Lara
Thank you, however, these charts have really confused me as they seem to differ greatly from the recent price action.
Are these based on the latest activity or from historical moves?
Ali
I am so sorry Ali, my code wasn’t updated 🙁
It is now.
Thanks Lara
Appreciated.
Reading through the analysis you have highlighted that price should remain below intermediate wave (1) at 5,768.22. As this is no longer the case I am unsure what this has invalidated in terms of waves?
Looking now for price to remain within channel.
No. When intermediate (3) is over then intermediate (4) must remain below intermediate (1).
Intermediate (3) is not over.