
A breach of the channel on the hourly Elliott wave chart provides some confidence the bounce is over.
Summary: There is earliest confirmation of a trend change today. The probability that the bounce is over has increased. Further confidence may be had with a new low below 1,872.7, and full and final confidence with a new low below 1,812.29 on a downwards day with an increase in volume. At this stage, the downwards trend has likely resumed and the short term target is at 1,511. If this target is wrong, it may not be low enough. Look out for surprises to the downside; this could be the middle of a big strong third wave approaching.
To see how each of the bull and bear wave counts fit within a larger time frame see the Grand Supercycle Analysis.
To see detail of the bull market from 2009 to the all time high on weekly charts, click here.
Last published monthly charts can be seen here.
If I was asked to pick a winner (which I am reluctant to do) I would say the bear wave count has a higher probability. It is better supported by regular technical analysis at the monthly chart level, it fits the Grand Supercycle analysis better, and it has overall the “right look”.
New updates to this analysis are in bold.
BULL ELLIOTT WAVE COUNT
DAILY CHART – COMBINATION OR FLAT
Click chart to enlarge.
This wave count is bullish at Super Cycle degree.
Cycle wave IV may not move into cycle wave I price territory below 1,370.58. If this bull wave count is invalidated by downwards movement, then the bear wave count shall be fully confirmed.
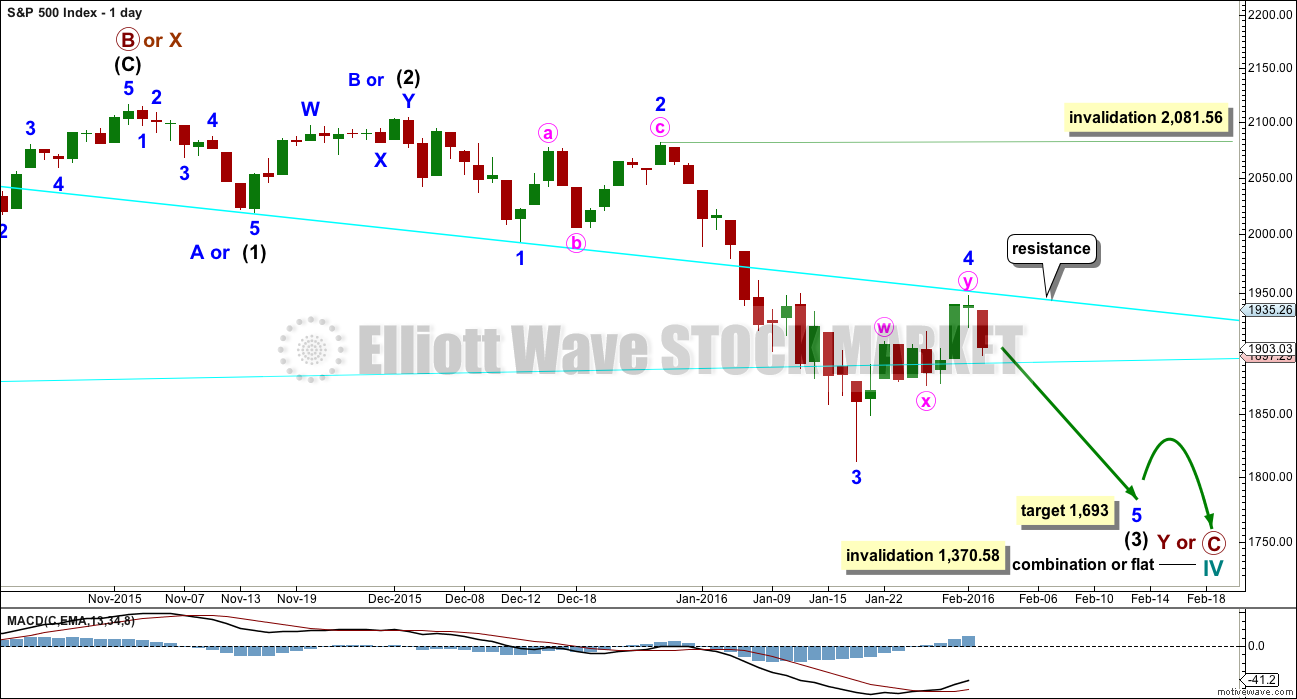
Cycle wave II was a shallow 0.41 zigzag lasting three months. Cycle wave IV should exhibit alternation in structure and maybe also alternation in depth. Cycle wave IV may be a flat, or combination.
Cycle wave IV may end within the price range of the fourth wave of one lesser degree. Because of the good Fibonacci ratio for primary wave 3 and the perfect subdivisions within it, I am confident that primary wave 4 has its range from 1,730 to 1,647.
Primary wave C should subdivide as a five and primary wave Y should begin with a zigzag downwards. This downwards movement is either intermediate waves (1)-(2)-(3) of an impulse for primary wave C or minor waves A-B-C of a zigzag for intermediate wave (A). Both these ideas need to see a five down complete towards the target, so at this stage there is no divergence in expectations regarding targets or direction. When and if these two ideas diverge, I will separate them out into two separate charts. For now I will keep the number of charts to a minimum.
Primary wave A or W lasted three months. Primary wave C or Y may be expected to also last about three months. It is now in its second month at this stage and may not be able to complete in just one more. It may be longer in duration, perhaps a Fibonacci five months. That would still give a combination the right look at higher time frames.
Within the new downwards wave of primary wave C or Y, a first and second wave, or A and B wave, is now complete. Intermediate wave (2) or minor wave B lasted a Fibonacci 13 days exactly. At 1,693 intermediate wave (3) would reach 4.236 the length of intermediate wave (1).
This daily chart and the hourly chart below both label minor wave 3 as complete. It is also possible that the degree of labelling within minor wave 3 could be moved down one degree, because only minute wave i within it may be complete. The invalidation point reflects this. No second wave correction may move beyond its start above 2,081.56 within minor wave 3. If this bounce is minor wave 4, then it may not move into minor wave 1 price territory above 1,993.26.
Price has come up to find resistance at the upper cyan trend line. This line goes back to 20th July, 2015, (its first anchor) and is reasonably shallow, has been repeatedly tested, and has reasonable technical significance. It should be expected to offer reasonable resistance and this may end the upwards correction here.
HOURLY CHART
Click chart to enlarge.
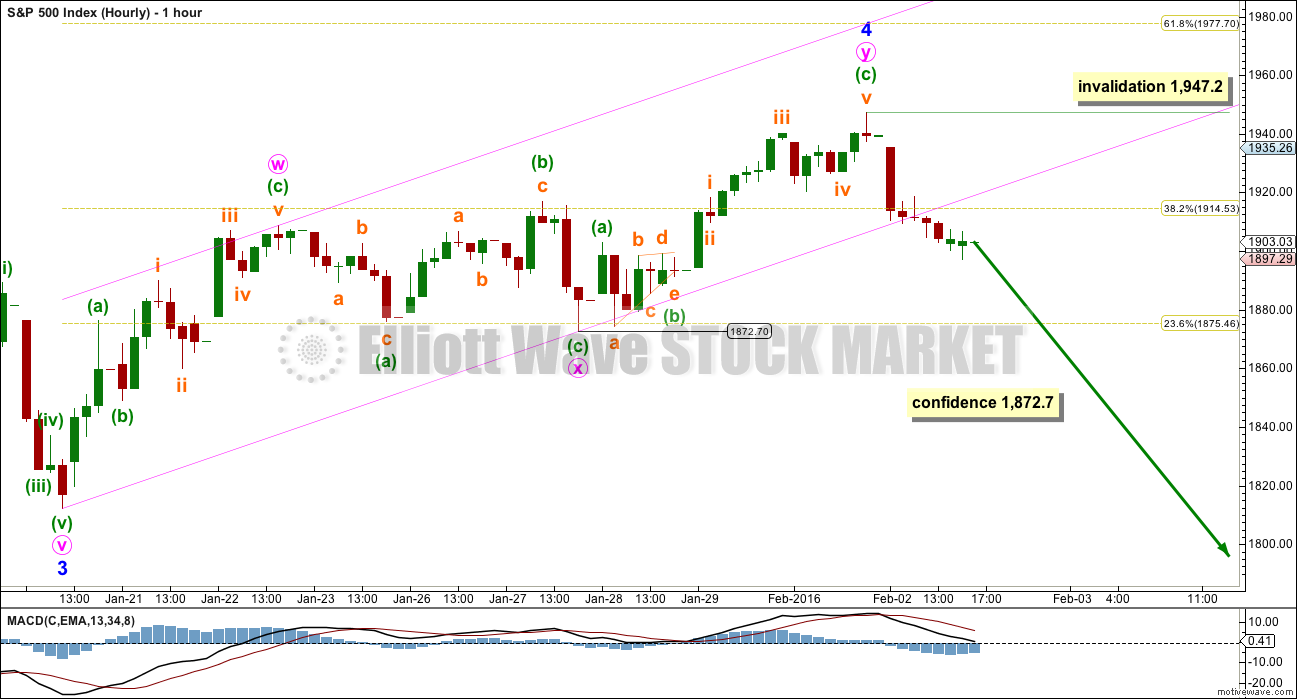
At this stage, the corrective structure which has the best fit is a double zigzag. This movement now has a clear three wave look to it on the daily chart.
If this is a fourth wave correction, then the least likely structure for it would be a zigzag or zigzag multiple. That would not provide adequate alternation with the second wave zigzag.
However, alternation is a guideline, not a rule, and it is not always seen.
The probability that a fourth wave is unfolding has reduced. The probability that this bounce is a second wave has increased.
Because both bull and bear wave counts see this structure in the same way on the hourly chart, further comment will be with the bear wave count.
BEAR ELLIOTT WAVE COUNT
DAILY CHART
Click chart to enlarge.
This bear wave count fits better than the bull with the even larger picture, super cycle analysis found here. It is also well supported by regular technical analysis at the monthly chart level.
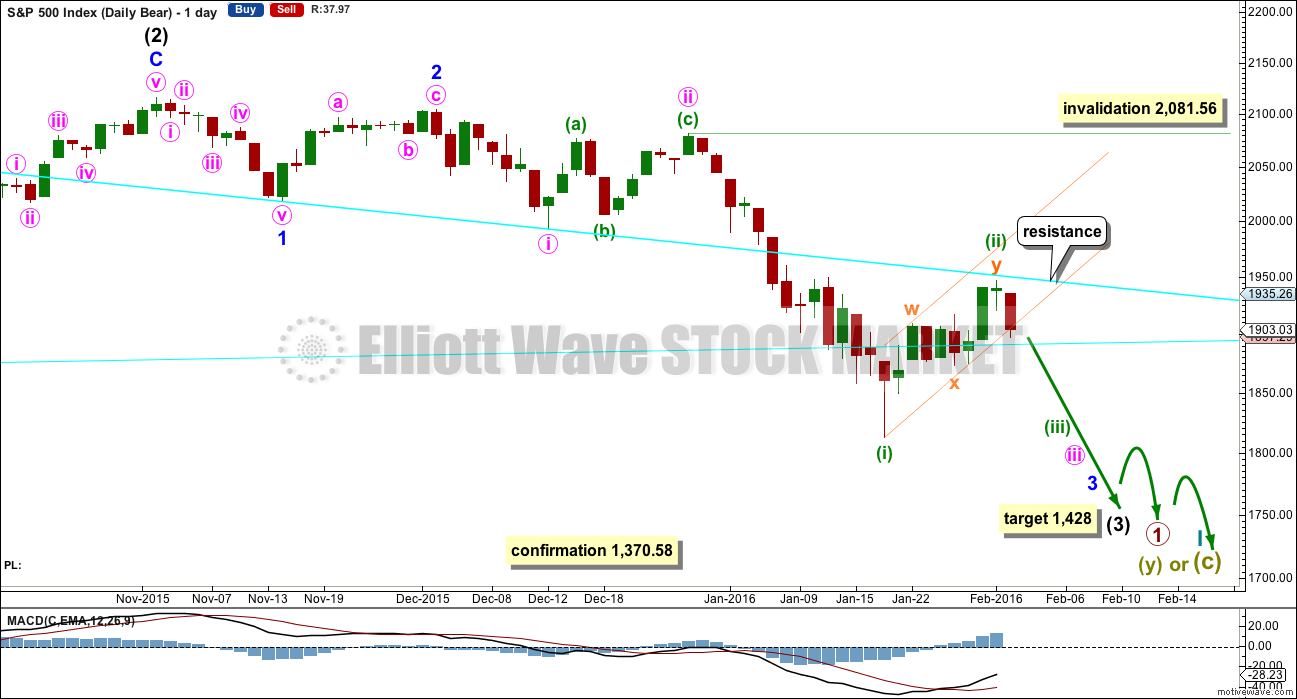
Importantly, there is no lower invalidation point for this wave count. That means there is no lower limit to this bear market.
Downwards movement so far within January still looks like a third wave. This third wave for intermediate wave (3) still has a long way to go. It has to move far enough below the price territory of intermediate wave (1), which has its extreme at 1,867.01, to allow room for a following fourth wave correction to unfold which must remain below intermediate wave (1) price territory.
Intermediate wave (2) was a very deep 0.93 zigzag. Because intermediate wave (2) was so deep the best Fibonacci ratio to apply for the target of intermediate wave (3) is 2.618 which gives a target at 1,428. If intermediate wave (3) ends below this target, then the degree of labelling within this downwards movement may be moved up one degree; this may be primary wave 3 now unfolding and in its early stages.
The correction for minuette wave (ii) may be over totalling a Fibonacci eight sessions and finding resistance at the upper cyan trend line. A small channel may now be drawn about this correction. This channel is now breached at the hourly chart level. Depending upon risk appetite, members may like to wait to see a clear breach at the daily chart level before having confidence that this correction is over. Price is finding support on the way down at the lower cyan trend line. This may be preventing a strong increase in downwards momentum. Momentum may increase when price breaks below this line.
Intermediate wave (2) lasted 25 sessions (no Fibonacci number), minor wave 2 lasted 11 sessions (no Fibonacci number), minute wave ii lasted 10 sessions (no Fibonacci number) and now minuette wave (ii) may have lasted a Fibonacci 8 sessions. Each successive second wave correction of a lower degree has a shorter duration which gives the wave count the right look, so far.
If minuette wave (ii) continues any higher, it may not move beyond the start of minuette wave (i) above 2,081.56. When the channel about minuette wave (ii) is breached by a full daily candlestick below it, then the invalidation point may be moved lower at the daily chart also.
The degree of labelling within minute wave iii may also be moved up one degree. This correction may be minute wave iv. I will wait to see how momentum behaves for the next wave down to make a final decision on which degree of labelling is correct. For now I will leave the labelling as the most likely for a second wave due to the duration and the structure of a double zigzag.
If the next wave down shows a strong increase in momentum, then it would be the middle of a big third wave.
If the next wave down shows weaker momentum than minuette wave (i), then it would be a fifth wave to end minor wave 3.
HOURLY CHART
Click chart to enlarge.
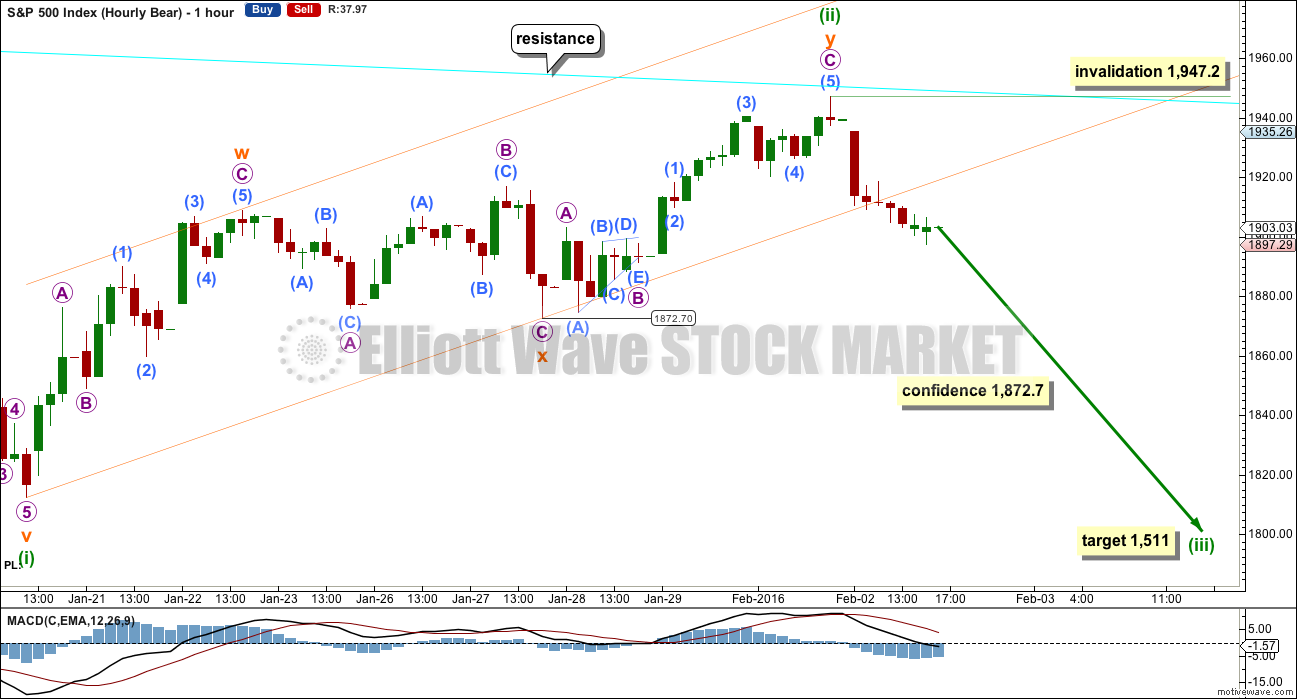
The structure of this correction fits neatly as a double zigzag.
The simplest method to confirm a trend change is a trend channel or trend line.
The channel about minuette wave (ii) is today breached at the hourly chart level, so the invalidation point is moved lower at the hourly chart level. This is earliest confirmation of a trend change. No second wave correction may move beyond its start above 1,947.2 within minuette wave (iii).
A new low below 1,872.7 could not be a B wave nor second wave correction within subminuette wave y, so at that stage minuette wave y would have to be over. This would provide further confidence in a trend change.
At 1,511 minuette wave (iii) would reach 1.618 the length of minuette wave (i). For this bear wave count, if this target is wrong, it may not be low enough; expect surprises to be to the downside.
A new low below the start of minuette wave (ii) at 1,812.29 on a downwards day with an increase in volume would provide classic technical confirmation of a breakout.
TECHNICAL ANALYSIS
DAILY CHART
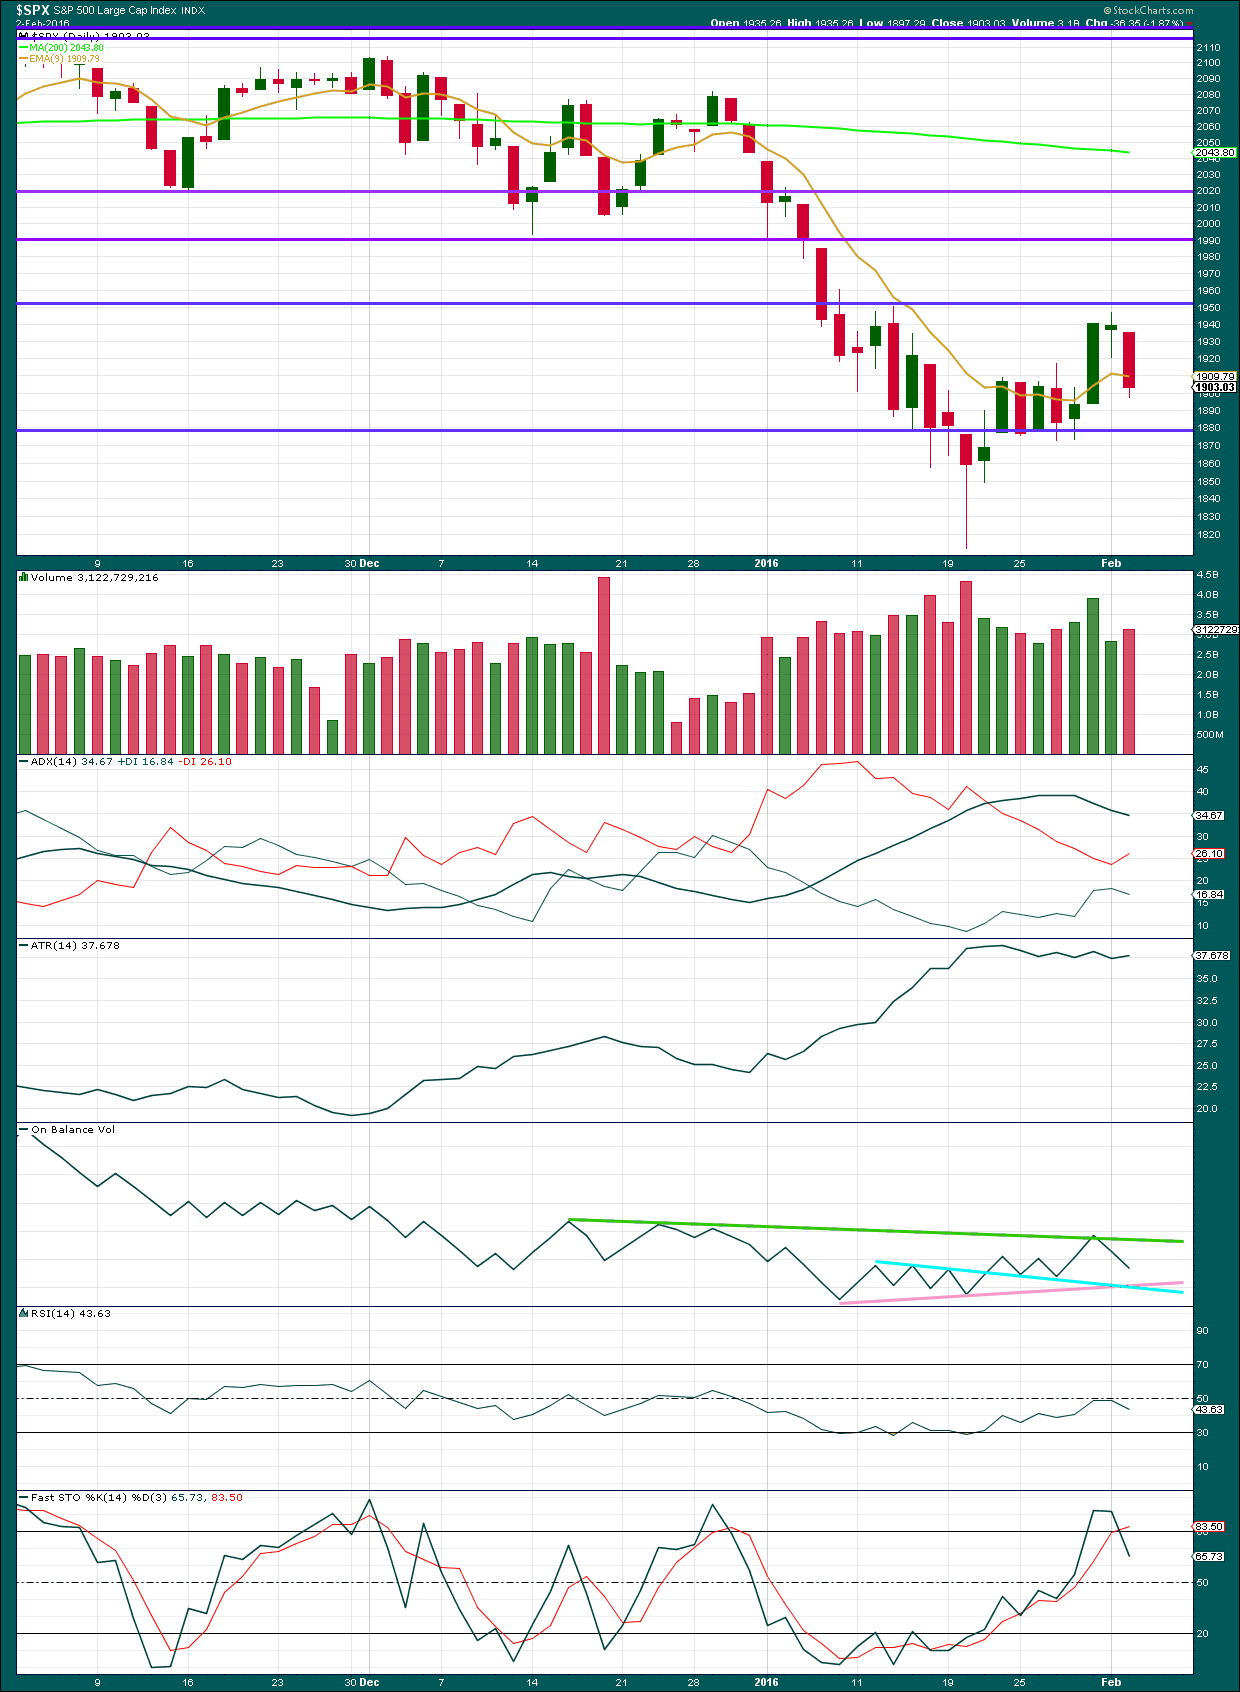
Click chart to enlarge. Chart courtesy of StockCharts.com.
A reasonable downwards day with an increase in volume supports the fall in price. Concerns over the high volume for the strong upwards day of 29th January are further alleviated.
ADX and ATR still indicate that the market is not trending. Both these indicators are necessarily lagging as they are based upon 14 day averages. If the market remains range bound, as these two indicators suggest, then more downwards movement would be expected to continue until price finds support and Stochastics reaches oversold at the same time. The next support line for price is about 1,878.
On Balance Volume has found resistance at the green trend line and turned down from there. This is a bearish indication. If OBV breaks below the light blue or pink lines that would be a further bearish indication.
The bounce has resolved RSI being oversold. There is again room for price to fall.
DOW THEORY
For the bear wave count I am waiting for Dow Theory to confirm a market crash. I am choosing to use the S&P500, Dow Industrials, Dow Transportation, Nasdaq and I’ll add the Russell 2000 index. Major swing lows are noted below. So far the Industrials, Transportation and Russell 2000 have made new major swing lows. None of these indices have made new highs.
I am aware that this approach is extremely conservative. Original Dow Theory has already confirmed a major trend change as both the industrials and transportation indexes have made new major lows.
At this stage, if the S&P500 and Nasdaq also make new major swing lows, then Dow Theory would confirm a major new bear market. At that stage, my only wave count would be the bear wave count.
The lows below are from October 2014. These lows were the last secondary correction within the primary trend which was the bull market from 2009.
These lows must be breached by a daily close below each point. So far the S&P has made a new low below 1,821.61, but it has not closed below 1,821.61.
S&P500: 1,821.61
Nasdaq: 4,117.84
DJT: 7,700.49 – this price point was breached.
DJIA: 15,855.12 – this price point was breached.
Russell 2000: 1,343.51 – this price point was breached.
This analysis is published @ 09:37 p.m. EST.
[Note: Analysis is public today for promotional purposes. Member comments and discussion will remain private.]