Again, sideways movement continues exactly as expected.
Summary: This bounce is either another second wave correction or a fourth wave correction, and it should continue for a further two (more likely) or seven (less likely) trading sessions. If price moves higher from here, then look for resistance at the downwards sloping cyan trend line on the daily charts.
To see how each of the bull and bear wave counts fit within a larger time frame see the Grand Supercycle Analysis.
To see detail of the bull market from 2009 to the all time high on weekly charts, click here.
Last published monthly charts can be seen here.
If I was asked to pick a winner (which I am reluctant to do) I would say the bear wave count has a higher probability. It is better supported by regular technical analysis at the monthly chart level, it fits the Grand Supercycle analysis better, and it has overall the “right look”.
New updates to this analysis are in bold.
BULL ELLIOTT WAVE COUNT
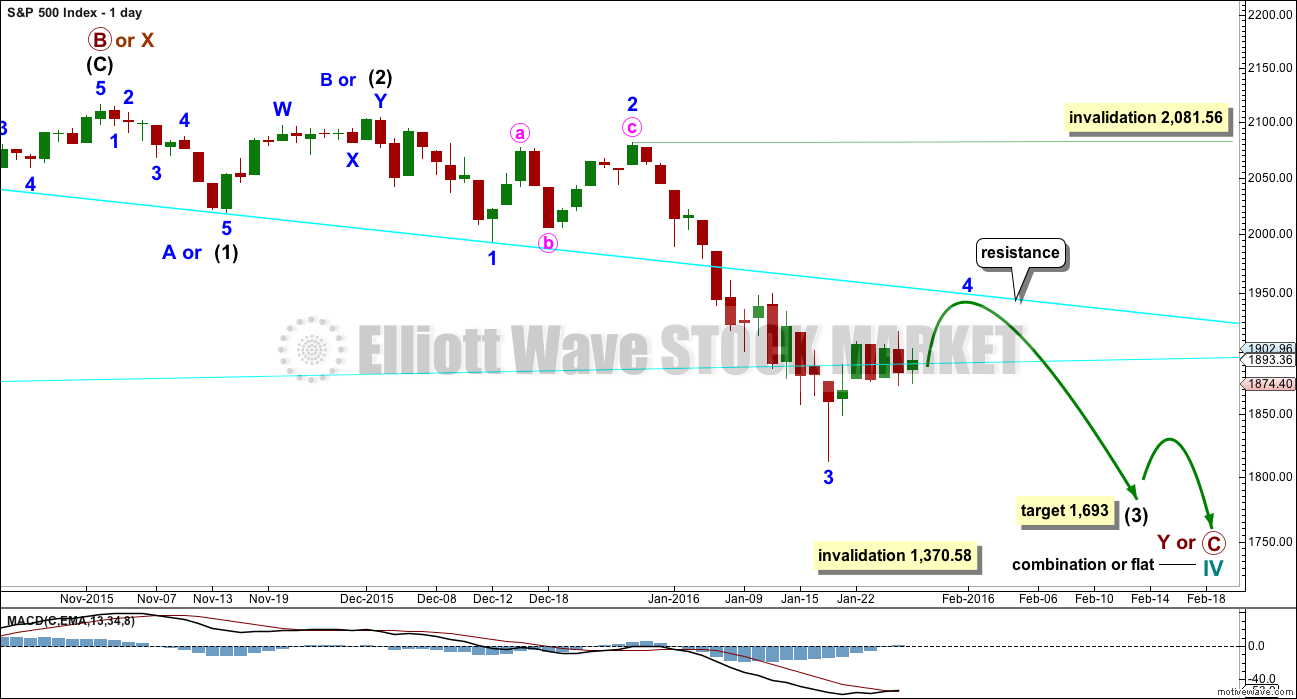
DAILY CHART – COMBINATION OR FLAT
This wave count is bullish at Super Cycle degree.
Cycle wave IV may not move into cycle wave I price territory below 1,370.58. If this bull wave count is invalidated by downwards movement, then the bear wave count shall be fully confirmed.
Cycle wave II was a shallow 0.41 zigzag lasting three months. Cycle wave IV should exhibit alternation in structure and maybe also alternation in depth. Cycle wave IV may be a flat, or combination.
Cycle wave IV may end within the price range of the fourth wave of one lesser degree. Because of the good Fibonacci ratio for primary wave 3 and the perfect subdivisions within it, I am confident that primary wave 4 has its range from 1,730 to 1,647.
Primary wave C should subdivide as a five and primary wave Y should begin with a zigzag downwards. This downwards movement is either intermediate waves (1)-(2)-(3) of an impulse for primary wave C or minor waves A-B-C of a zigzag for intermediate wave (A). Both these ideas need to see a five down complete towards the target, so at this stage there is no divergence in expectations regarding targets or direction. When and if these two ideas diverge, I will separate them out into two separate charts. For now I will keep the number of charts to a minimum.
Primary wave A or W lasted three months. Primary wave C or Y may be expected to also last about three months. It is now in its second month at this stage and may not be able to complete in just one more. It may be longer in duration, perhaps a Fibonacci five months. That would still give a combination the right look at higher time frames.
Within the new downwards wave of primary wave C or Y, a first and second wave, or A and B wave, is now complete. Intermediate wave (2) or minor wave B lasted a Fibonacci 13 days exactly. At 1,693 intermediate wave (3) would reach 4.236 the length of intermediate wave (1).
This daily chart and the hourly chart below both label minor wave 3 as complete. It is also possible that the degree of labelling within minor wave 3 could be moved down one degree, because only minute wave i within it may be complete. The invalidation point reflects this. No second wave correction may move beyond its start above 2,081.56 within minor wave 3. If this bounce is minor wave 4, then it may not move into minor wave 1 price territory above 1,993.26.
Price broke through support at the cyan trend line which is drawn from the August lows to September lows. This line is no longer providing resistance. The next line to offer resistance may be the downwards sloping cyan line.
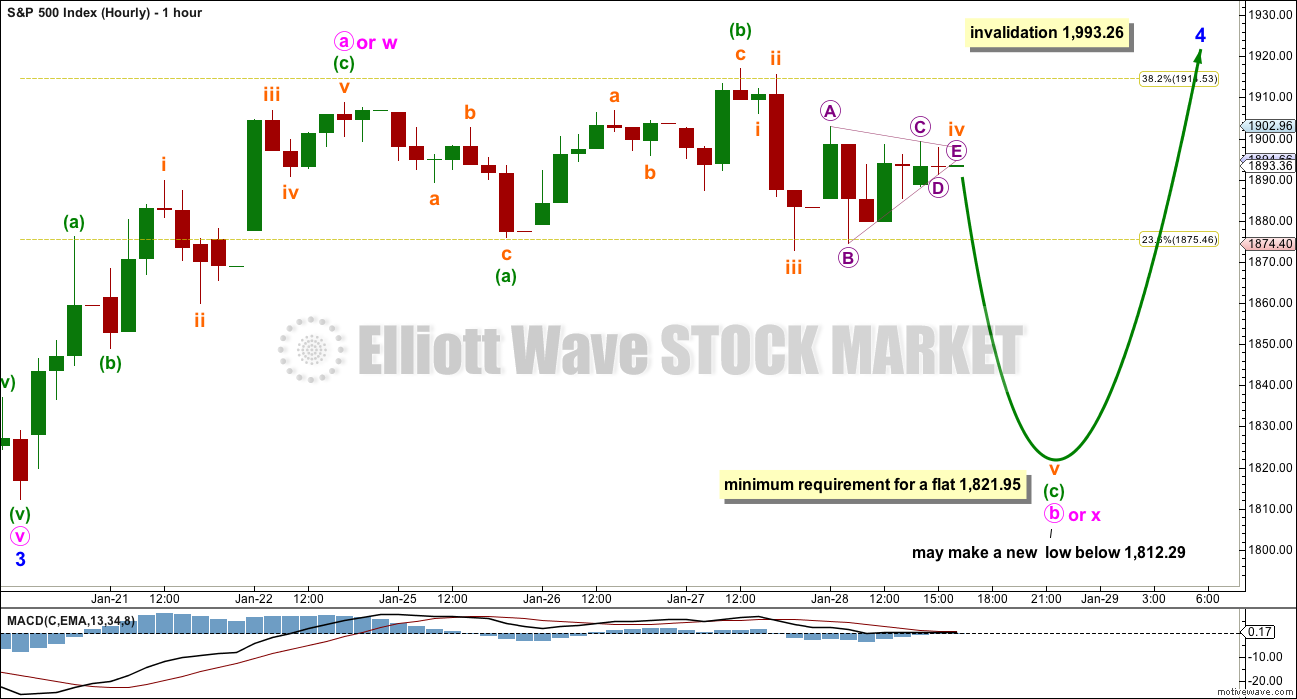
HOURLY CHART
At this stage, the bull and bear wave counts are essentially the same at the hourly chart level. Commentary will be with the bear wave count.
BEAR ELLIOTT WAVE COUNT
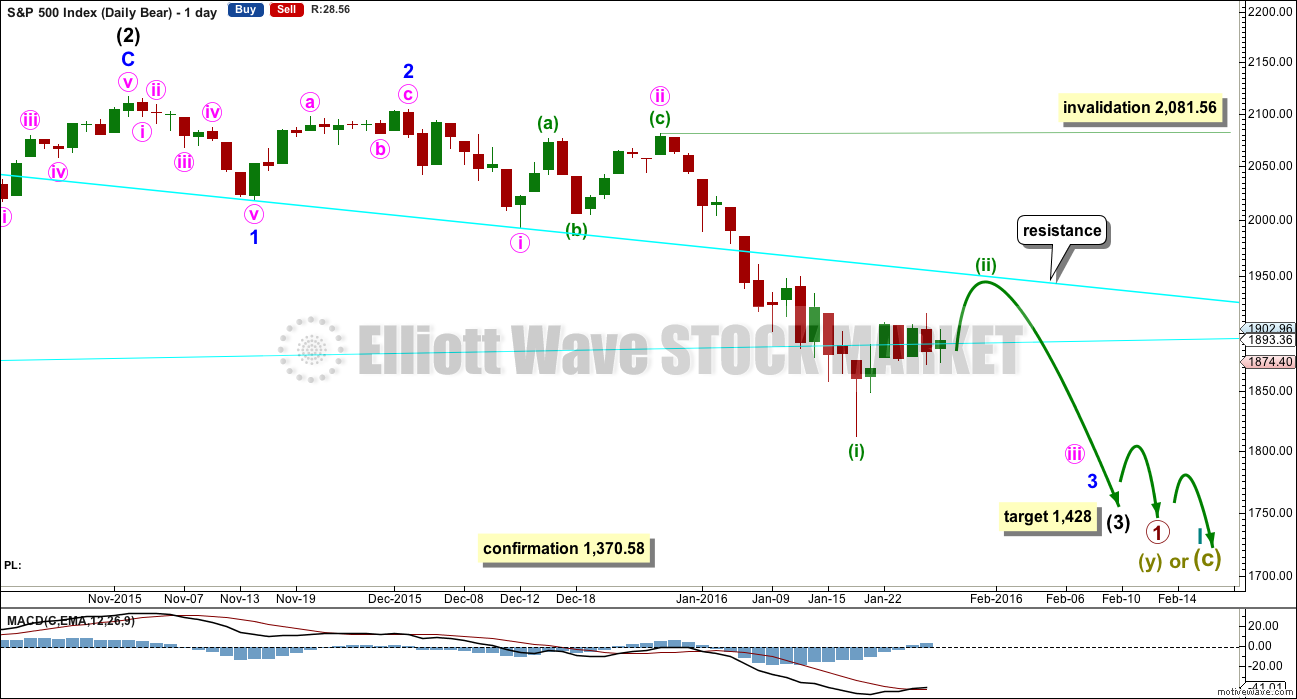
DAILY CHART
This bear wave count fits better than the bull with the even larger picture, super cycle analysis found here. It is also well supported by regular technical analysis at the monthly chart level.
Importantly, there is no lower invalidation point for this wave count. That means there is no lower limit to this bear market.
Downwards movement so far within January still looks like a third wave. This third wave for intermediate wave (3) still has a long way to go. It has to move far enough below the price territory of intermediate wave (1), which has its extreme at 1,867.01, to allow room for a following fourth wave correction to unfold which must remain below intermediate wave (1) price territory.
Intermediate wave (1) subdivides as a five wave structure with a slightly truncated fifth wave.
Ratios within intermediate wave (1) are: minor wave 3 is 7.13 points short of 6.854 the length of minor wave 1, and minor wave 5 is just 2.82 points longer than 0.618 the length of minor wave 3. These excellent Fibonacci ratios add some support to this wave count.
Intermediate wave (2) was a very deep 0.93 zigzag. Because intermediate wave (2) was so deep the best Fibonacci ratio to apply for the target of intermediate wave (3) is 2.618 which gives a target at 1,428. If intermediate wave (3) ends below this target, then the degree of labelling within this downwards movement may be moved up one degree; this may be primary wave 3 now unfolding and in its early stages.
I have two scenarios for the correction which began a few days ago. It may be either a second wave or a fourth wave. Looking at how far down intermediate wave (3) still needs to go on the weekly chart, I would favour the second wave scenario. That will be the main hourly wave count for that reason.
If this correction exhibits a Fibonacci number, it would most likely complete in a Fibonacci eight or thirteen sessions total. So far it has lasted six sessions.
HOURLY CHART
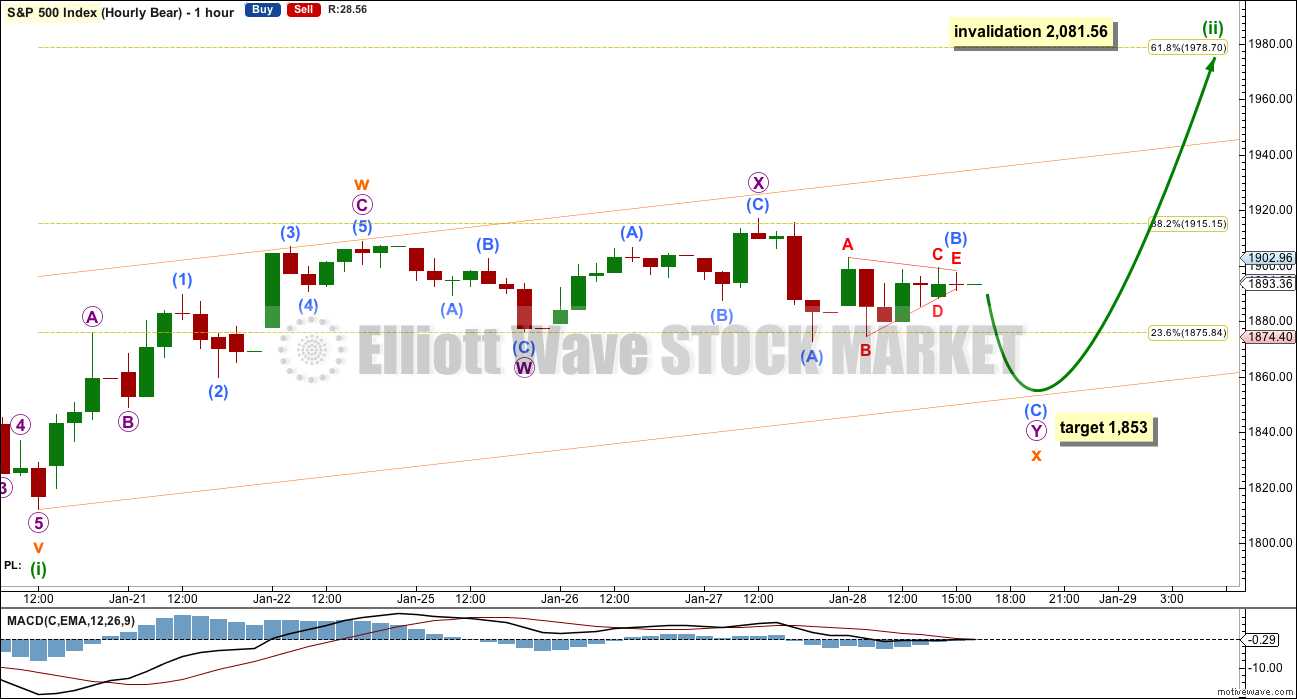
If this correction is a second wave, then it would most likely be a single or double zigzag. Because the first wave up subdivides best as a three, a zigzag, then minuette wave (ii) may be unfolding as a double zigzag.
Double zigzags normally have relatively shallow X waves that do not make new price extremes beyond the start of the first zigzag labelled here subminuette wave w.
Sideways movement may be a continuation of subminuette wave x as a double zigzag.
X waves may be any corrective structure, including a multiple. It is W, Y and Z which may only subdivide as single corrections each, so that the maximum number of corrective structures in a multiple is three.
Within micro wave Y, at 1,853 submicro wave (C) would reach equality in length with submicro wave (A).
If a double zigzag is unfolding upwards for a second wave, then when the X wave within it is complete the second zigzag should move price higher. The 0.618 Fibonacci ratio at 1,979 would be a reasonable target for this structure to end.
Minuette wave (ii) may not move beyond the start of minuette wave (i) above 2,081.56.
ALTERNATE HOURLY CHART
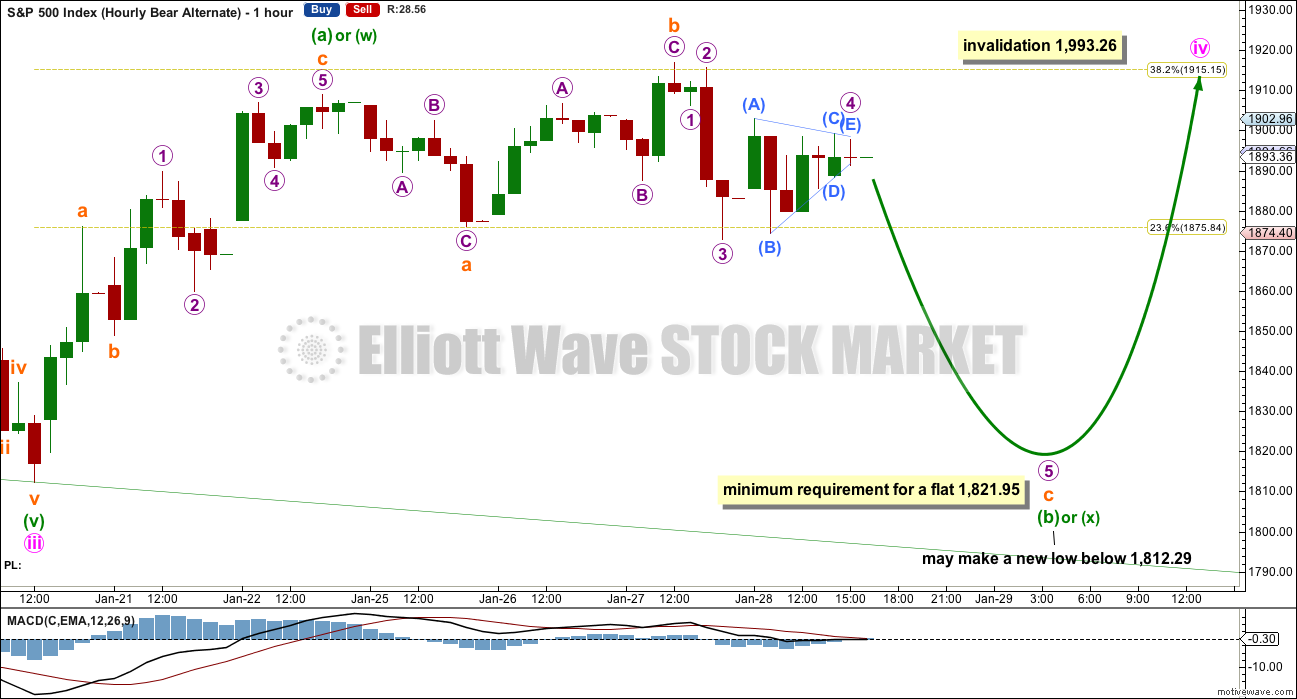
If the degree of labelling within the last wave down is moved back up one degree, then this correction may be a fourth wave.
This wave count expects that the middle strongest part of intermediate wave (3) is over. This may be the case; an extended fifth wave down to follow this correction may be able to take intermediate wave (3) down to the target.
Minute wave iv may not move into minute wave i price territory above 1,993.26.
The first wave up of minuette wave (iv) subdivides best as a three, a zigzag. This means that minuette wave (iv) may be unfolding as either a flat, triangle or combination. It could also be a double zigzag as per the labelling in the first bear hourly chart.
Within an expanded flat, running triangle or combination, minuette wave (b) or (x) may make a new price extreme beyond the start of minuette wave (a) or (w) below 1,812.29. There is no lower invalidation point for this wave count.
Minuette wave (b) or may be unfolding as an expanded flat correction.
If minute wave iv is unfolding as a larger flat correction, then within it minuette wave (b) must retrace a minimum 90% of minuette wave (a) at 1,821.95.
If minute wave iv is unfolding as a combination, then there is no minimum requirement nor maximum limit for minuette wave (x).
If minute wave iv is unfolding as a triangle, then the high of subminuette wave b could possibly be the end of an A wave within a triangle, as a double zigzag. This would expect a lot more sideways movement to last several more days. It is possible at this stage, but I still judge it the least likely structure to now be unfolding.
Overall, it must be understood that when price is within a consolidation as it is now it is impossible to tell which Elliott wave structure will unfold. A fourth wave may be any one of 23 possible structures. The labelling will change as the structure unfolds. It is impossible to tell what pathway price will take during the correction due to the great variety of corrective structures. My focus will be on determining when it could be over. It is still unlikely to be over today.
TECHNICAL ANALYSIS
DAILY CHART
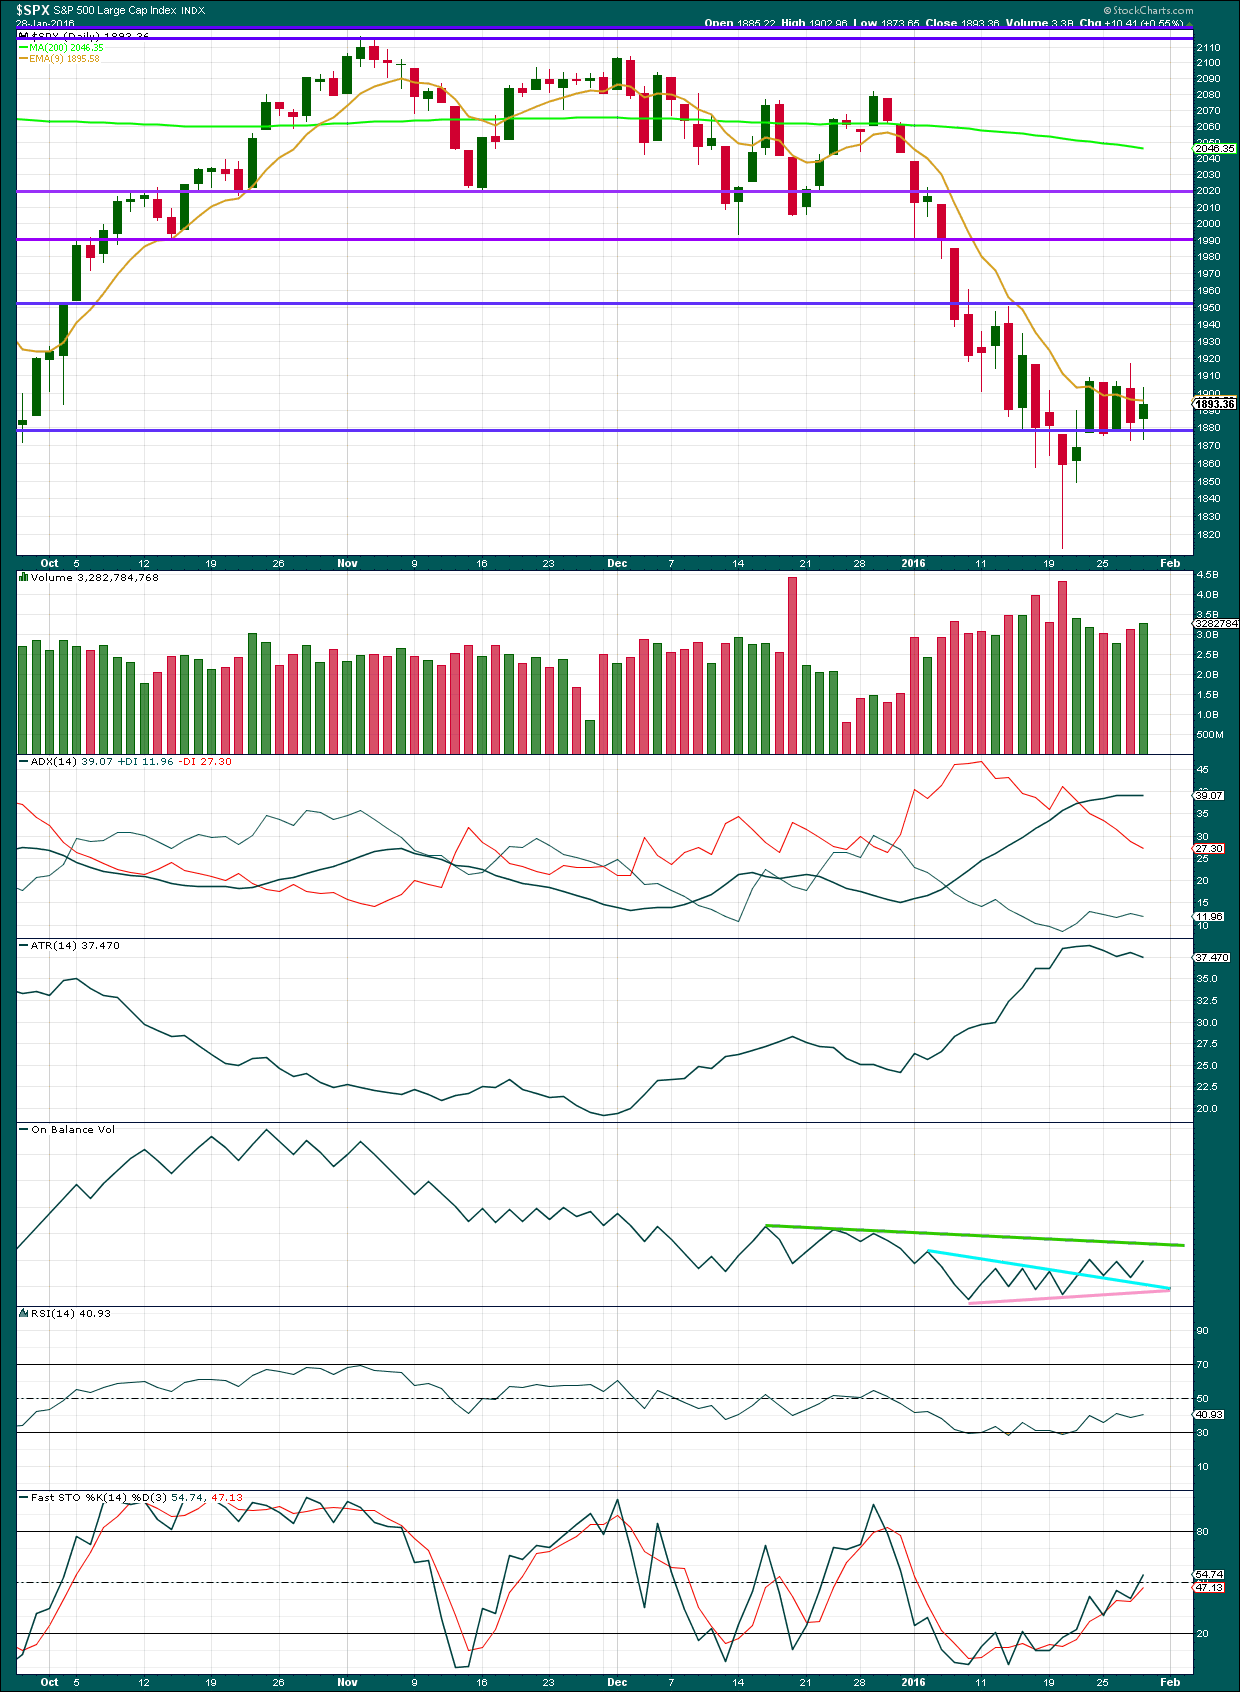
Click chart to enlarge. Chart courtesy of StockCharts.com.
As price fell to the last low, it came on increasing volume. The fall in price was supported by volume.
As price has moved higher then sideways for the last six days, overall volume remains lighter than 20th January, but it is not so clearly declining with the last two days showing an increase in volume. Today’s volume is still lighter than the first day of the correction on 21st January, so overall volume is not increasing. This remains mostly corrective.
ADX is flat and ATR is declining. Price is range bound. The market is consolidating.
On Balance Volume may find resistance at the green line and support at the blue line. A break out of this range may indicate the direction of price to break out.
If the market is consolidating at this stage, then it should be expected that price will swing from support to resistance and back again. Stochastics may be used to show when each swing ends. When Stochastics reaches overbought, then expect price to find resistance and turn down. With Stochastics not yet overbought and increasing further, upwards swings from price should be expected within this consolidation.
DOW THEORY
For the bear wave count I am waiting for Dow Theory to confirm a market crash. I am choosing to use the S&P500, Dow Industrials, Dow Transportation, Nasdaq and I’ll add the Russell 2000 index. Major swing lows are noted below. So far the Industrials, Transportation and Russell 2000 have made new major swing lows. None of these indices have made new highs.
At this stage, if the S&P500 and Nasdaq also make new major swing lows, then Dow Theory would confirm a major new bear market. At that stage, my only wave count would be the bear wave count.
The lows below are from October 2014. These lows were the last secondary correction within the primary trend which was the bull market from 2009.
These lows must be breached by a daily close below each point. So far the S&P has made a new low below 1,821.61, but it has not closed below 1,821.61.
S&P500: 1,821.61
Nasdaq: 4,117.84
DJT: 7,700.49 – this price point was breached.
DJIA: 15,855.12 – this price point was breached.
Russell 2000: 1,343.51 – this price point was breached.
This analysis is published @ 09:53 p.m. EST.

I find the updates during market hours very helpful, and thank you Olga for your fine analysis.
I agree. Thanks Olga (and others!)
Verne
I try not to look at twitter on days like today. For instance now folks are talking about spx entering into another distribution with a target at 2030-2060 in the cards. That sounds like to much. It would totally mess up the structure of this decline we are looking at…
Next week should give us a clue on what Mr. Market will do…
That does seem to be quite optimistic to me as well. It’s hard to believe people are completely ignoring the economic data that came out today, but frankly the persistent bullishness is understandable. In the past, the market has always recovered and gone on to new highs. Unless you are looking under the hood, its easy to believe what was, always will be. If this rise breaks SPX 2000, I will be the first to concede that I was mistaken in my near-term bearish outlook. Until then this market in my view is running on empty… 🙂
And 1,940 is met and slightly passed.
I would still expect a little more upwards movement so that this correction lasts a Fibonacci 8 days total. So more up on Monday.
I’ll need to calculate a new target, but I’m not going to do that until I’ve spent some time on the five minute chart.
Thanks. It will be interesting to see what the numbers are…
The move up today is parabolic and almost certainly terminal.
Former fourth wave high of 1950.33 is a likely target. It has been quite some time since SPX has been able to post upward days of more than two or three at a time. All the bullish talk notwithstanding, I expect this move out of the triangle to be the final move up and if it is a second wave, would have admirably accomplished its purpose. 🙂
Lara,
Since the trend is confirmed down. What implications does that have on the monthly candle continuing to be red. The question about the candle in detail was – should we anticipate a red candle for months in a row or a pause “bullish candle” and then continuation red candle lower?
I tried to go back to the last bear markets but I dont see which part of the bear market we fit best in?
On the way up from 2009, you have had month after month of increases.
I suspect this will be an old fashion Bear Market… month after month of decreases followed by more month after month of decreases. It will be just as frustrating on the downside as it was to a bear on the upside.
Especially if SuperCycle Bear and Grand Supercycle Bear. If you follow EW these are the two on deck!
If you see what is occurring fundamentally worldwide those two are on deck for sure!
Thanks Joseph. I am trying to visualize a red candle in the form of a hammer or bearish engulfing for Feb but it seems hard to see it draw down to 1550. See my point?
Intermediate (2) shows as a green candlestick on the monthly chart. So the next green candlestick shouldn’t be until intermediate (4).
In the last bear market it was primary degree corrections mostly that produced monthly green candlesticks.
But for the bear count this bear market is bigger so intermediate degree corrections should be expected to produce green candlesticks.
The actionary waves of 1, 3 and 5 are down and should produce red candlesticks.
So I wouldn’t expect January or February to be green, they both should be red.
Look back at the bear market of 2007 – 2009. You will see red candlesticks with long lower wicks and small upper wicks. Yet price kept falling.
This long lower wick doesn’t mean anything is wrong with the bear wave count and it doesn’t indicate a green candlestick should turn up for February.
Thank you. I am learning so much here from everybody. It is great to learn from very dedicated technical folks here in the community!
Rodney
This is the SPX weekly. I haven’t done any research on 2 hammers in a row for a continuation higher or decline but just check it out. The middle Bollinger band is around the daily chart 50DMA at 2008/”2010″. So, if this has strength VIX should push lower in the mid teens and the market should grind and rise slowly. Ideas only – not to be taken as trade advice…
Ace,
The bull flag you pointed out a couple of days ago looks like it has completed its breakout. It also looks like it may be nearly complete.
That ramp in the last 30 sec of trade has got to be one of the most desperate acts of ‘window dressing’ I’ve ever seen. Is everything so great that we just must hold over the weekend.
Someone wasn’t prepared to let it close even 5 points off the high!
Did someone say “recession”? They have got to do something to distract from those fourth quarter GDP revisions…and that was the quarter that included “Black Friday” …Ouch! 🙂
I took a look at the one minute chart and you can see some huge and repetitive cash dumps to keep the market from declining. An awful lot of capital was deployed during this run-up. Let’s see how deep the pockets be, and more importantly, how long they can influence market sentiment…! 🙂
Rodney,
Thanks. For open market direction ideas only. No advice at all. The only concern from my perspective is that unless we can get rejected right here right now come Monday or +20 to 40 points oh say 1978ish maybe 1993. The market has voted higher for the time being. It remains to be seen if we tag SPX 2008 level now. That is the first 50 DMA. I remain open but I got to tell you with 2 weekly hammers in a row could be a clue or a false flag…
I was reading another blog – we have corporate buy backs in Feb. This could get interesting!
If this ends on Monday it would have lasted exactly a Fibonacci 8 days.
And that will be my expectation. About 1,940 on Monday.
But I will be following exactly the same procedure as Olga outlines below for trading. I’ll wait for a channel about this correction to be breached before I enter short. That limits my risk. And my stop will be at the end of the correction.
Ah yes! What an incredible fat pitch right over the center of the plate. Keeping in mind that triangles so often show up as the penultimate wave in a movement, I’m definitely jumping the gun with a few open stink bids to catch the final pop (don’t tell anybody I snuck away from my annual check-up to take a peek!) 🙂
Vern– you great guru of volatility–given Lara’s SPX projection of about 1940 what’s the correct entry price for UVXY? How low does UVXY go on this final SPX move up?
I originally had set a stop at 40 for UVXY but lowered it to 37.5 after the break-out from the triangle as I figured we were in the final wave up. I have been gobbling up as much as they will let me have with open stink bids. Got a a nice haul today as it hit the 38.5 area a few times.
Trading it is a bit tricky. You have to have high tolerance for….well… volatility!!! 🙂 🙂 🙂
(Anything under 40 in a final wave up is a go in my book and I am also talking about short term. Sitting pat on mid and long term trades )
Thanks .
Closed at 1940.24….. So Monday at some point wave 3 down begins.
Or is it starting in ES after hours today/Sunday night/Monday pre market?
Looking good atm, but still might want to wait for a little more confirmation imho. At least trend line confirmation, ideally price also.
Invalidation of both counts (wave iv and a wave ii) are still quite a bit above current levels. Shorting too early is gonna really hurt if the market continues higher and invalidates both counts.
If we were closer to invalidation then I would take a punt, but we’re not even half way toward wave (ii) invalidation atm. Mr Market might have some further upside suprises in store for us yet. That’s why I consider it a gift when the market bounces very close to invalidations.
Just my thoughts – everyone clearly has different risk tolerance.
What are the exact two points where you are drawing your channel so that I can draw the same. I thank you in advance.
Please see my chart below – I don’t have my charts open right now, but lower channel starts at the low (around 1812?) from a week or so ago, and touches the low from yesterday with a copy on the (w) high.
Lara will almost certainly put a channel on her update later, so you may be better waiting to see how she draws it.
I’ll be drawing that channel on daily and hourly charts today.
I expect the partying to continue on Monday…think Wile E. Coyote running a few yards past the edge of the cliff… 🙂
I imagine the banksters will spend a lot of capital on overnight futures Sunday to try and maintain a sanguine outlook. There is also positive seasonal bias for the start of a new month. Depressed futures overnight would be very surprising, and very bearish…
I am personally on the lookout for a bearish engulfing candle…
I had that little triangle wrong. It was a small B wave, but it began later than I saw and so the entry was up, the breakout was up.
The second wave double zigzag will be favoured at this stage. And I see this structure so close to completion now.
A channel can be drawn about it. Price is still in the channel. When the channel is breached, exactly as Olga says that is when we have some confidence that this bounce is over.
The second zigzag is unfolding, the triangle was the B wave within it. The C wave has moved above the end of A, there will be no truncation.
The second zigzag has so far deepened the correction, its purpose is met.
This structure could end very soon.
Within the second zigzag at 1,940 C will be 1.618 X A. That seems a reasonable target.
This is very likely a wave (ii) up imho – looks like a classic wave 2 zig zag atm, which is the best case we could have hoped for (as means a huge third is still ahead of us). This makes much more sense to me than a 4th wave unfolding.
I make the move up to w (orange) to be about 97 points in length, therefore I calc:-
y = 0.618 * w @ around 1932
y = w @ around 1969
As soon as the orange lower trendline is breached I’ll be back in fully short. I might also have a nibble at the above targets if we see an impulsive reversal and divergent technicals.
There are also a few other markets I am watching (inc. Gold & USD:GBP) which are completing a final pop higher right now short term then they should continue to new lows. So a few markets would appear to be in lock step with S&P atm.
I’m expecting an upcoming third to take most other markets down with it.
Patiently waiting and watching! 🙂
Thanks Olga. I just exited all my long positions and like you, looking to find a good entry for the short position. If the next wave down is the 3rd, it will be exciting to watch and participate in it.
Oil and USD:GBP seem to be already rolling over – will stay disciplined and stick to the plan – they might be just correcting down with one final push higher. Would like to see S&P at least reach 50% retrace (1946) really.
In theory we could still be in wave A of a 4th wave, but that would be seriously dragging on now imho.
If we are about to see a third at this degree then there should be ample downwards movement to get very high probability confirmation and still surf most of the wave so no need to gamble here.
BTW – for anyone fairly wounded by previous market volatiity, looking for fairly high probability confirmation – the low at around 1873 with a stop at the (still in progress) swing high would be a good place to go short imho.
For even better confirmation enter only after we drop below 1873 and a (fairly) small degree 5 wave down, 3 up structure has unfolded.
Very astute and articulate Olga… Thank you…
Hey Olga: Welcome back. Missed ya! 🙂
Thanks Buddy – tbh had nothing constructive to post until today. Was awaiting a breakout of the sideways volatility one way or another. Could have gone either way.
Was expecting (and hoping) it would resolve upwards but still not counting my chickens quite yet.
Thank-you Olga for this post!
Interesting. It could be that while DJI and SPX are falling in third waves Russell and NDX could be simultaneously completing fifth waves down. If the latter two have completed only first waves down so far the third wave is going to be a doozy. The first scenario would set up nicely for NDX and RUT to lead the way higher in a second wave bounce while the other guys were making primary one lows, with all indices rising synchronously for the big re-trace in primary two up. Just thinking out loud…
Not looked at the Russell, but I’m inclined to think that the fourth wave on the NDX will turn out to be a second, to bring it inline with the S&P.
To me it has the same issue as we had with S&P if this is a 4th wave – that the 3rd has not took price low enough, nor did it feel like a 3rd.
For sure I’ll be on the lookout just in case. It’s possible that the 5th will be explosive in NDX whilst we have the 3rd in S&P, but then what will NDX do whilst the S&P completes it’s 4th & 5th waves?
I get that NDX could lead the way for a few days, but I cannot imagine such devergence at this degree whilst S&P completes a time consuming 4th wave and a final 5th down??
When all said and done, it is not even certain we are in a (ii) up – hopefully time will provide enough clues and the market will give us enough setups to earn a decent crust even if things end up turning out totally different to what we expect.
Excellent observations. It may be that the economic news cycle is also starting to align with the potential start of a third wave decline. 0.7 % growth in the fourth quarter of 2015 does not augur well for equities in 2016 ihmo.
Classic thrust from a triangle today. I would not chase it.
Unloading hedges. Adding volatility. Take care everybody! 🙂
Thanks Vern!
What are the views of China PMI’s due early Monday gmt and it’s effect?could shift the markets quite easily.
Steady fade of elevated futures overnight. It will be interesting to see how long opening bounce lasts. Look out for bull trap going into week-end if index ends at day’s high. DAX gap open almost filled already. Another possibility is another outside reversal day on Monday to meet Fib correction time. Have a great week-end everyone!
Hi All,
Something that’s interesting about the present chart situation is that there may be another very long term trend line in play. Pretzelcharts has identified a 30 year trend line for the SPX, one which the average has on occasion been both over and below during that period, and is presently below. Today that line crosses right about at the 1910 point, the point that the SPX seems to be having trouble surmounting. It may act to suppress this correction.
Speaking of interesting charts. Dent Research uses demographic trends to make economic forecasts and favor Lara’s bearish count. Retest of underside of long-term trend-line noteworthy.
Dent Research was very accurate through the last decade. I am convinced we are getting very close to the start of the next wave down that will crush the markets. Monthly and weekly indicators are all pointing down. All we need is to have the daily oversold condition relieved. Once that is done, it is look out below.
Look at the ftse monthly too from 2000,that going back to c.4000
Thanks for sharing this Verne, i hadn’t heard of Dent, but will be sure to check them out.
Interesting to see this idea presented by another research company. I’ve had a bit of a crush on this idea for a while as – assuming it plays out – it would look very much like a fractal on the DJIA price action from 1966-1974.
Interesting stuff!
This long term trendline also seems to work as a parallel copy, which roughly sits on the market tops of the early 80ies and is re-tested form the upside in 2012 (black line). This would give some more room for a W4 support of the Bull count.
Hi
Great work, I like the bear alternate. It is inline with my analysis. I think that is the best fit. No jinx!