
Last Nasdaq analysis expected downwards movement which is exactly what has happened.
New updates to this analysis are in bold.
BULL WAVE COUNT
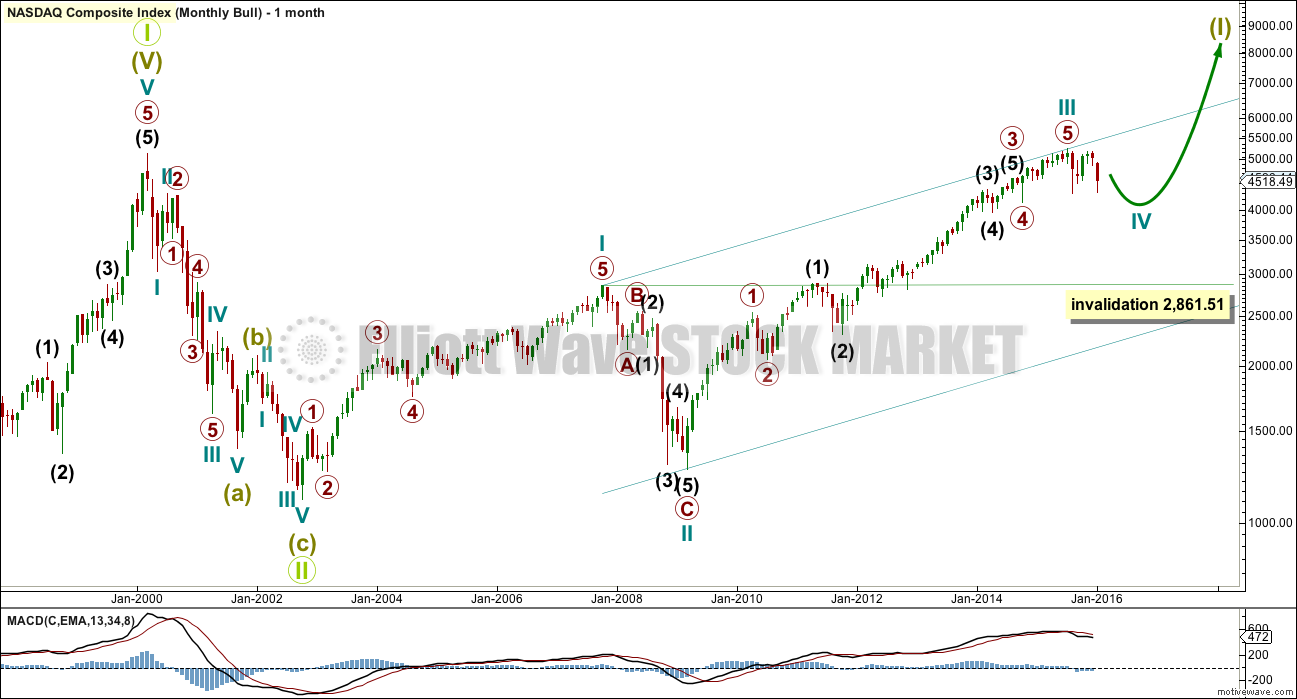
MONTHLY CHART
Click chart to enlarge.
Grand Super Cycle wave II is seen here as over in just 31 months. This is possible, but it is more likely it would last longer than this.
This wave count sees Nasdaq in a Grand Super Cycle wave III upwards.
There is no Fibonacci ratio between cycle waves I and III.
Super Cycle wave (I) is an incomplete impulse. Within Super Cycle wave (I), cycle wave IV is underway.
Cycle wave II was a very deep 0.91 zigzag lasting 17 months. Cycle wave IV should exhibit alternation, so is most likely to be a flat, combination or triangle. These are more time consuming structures than zigzags, so cycle wave IV should last at least 18 months and may last a total Fibonacci 21 or more likely 34 months. So far it is in just its sixth month. The degree of labelling within it at the weekly and daily chart level may need to be moved down one degree.
Cycle wave IV may not move into cycle wave I price territory below 2,861.51.
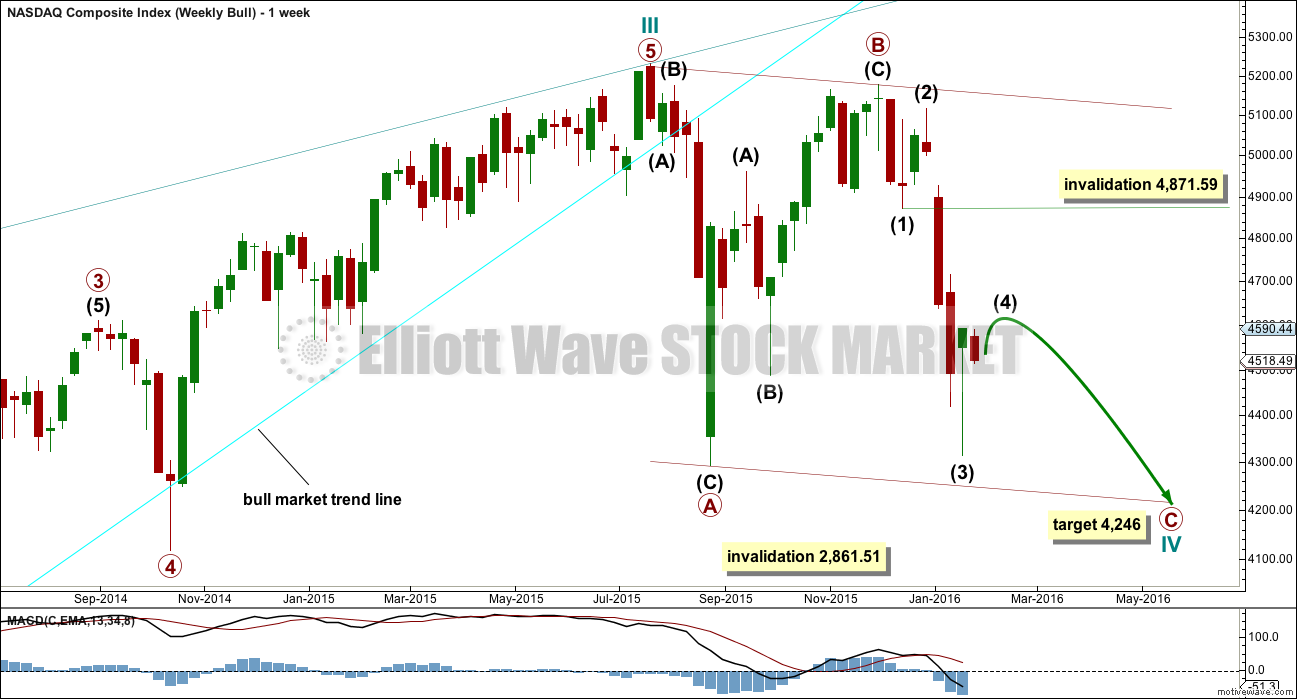
WEEKLY CHART
Click chart to enlarge.
Cycle wave IV may end about either the 0.236 or 0.382 Fibonacci ratios of cycle wave III at 3,748 or 3,042.
The bull market trend line is drawn from the end of cycle wave II in March 2009, to the end of minuette wave (ii) in November 2012. This trend line has been breached by a close of more than 3% of market value indicating a market change from bull to bear.
Cycle wave IV is most likely to be a flat, combination or triangle to exhibit structural alternation with the zigzag of cycle wave II. So far the first wave down may be a zigzag for primary wave A. This may also be a zigzag for primary wave W of a combination.
Primary wave B is over 90% the length of primary wave A. This may be a regular flat correction.
Regular flats fit well within trend channels. Their C waves normally are about even in length with their A waves. At 4,246 primary wave C would reach equality in length with primary wave A. Primary wave C may find support at the lower edge of the channel.
When a possible regular flat is complete, depending on the complete duration of the structure, then the degree of labelling within cycle wave IV may be moved down one degree. This flat correction may be only primary wave A of a larger flat, or a triangle, or primary wave W of a double flat or double combination. A judgement based upon the overall look at the monthly chart level would be made at that stage. For now I will leave the labelling as it is.
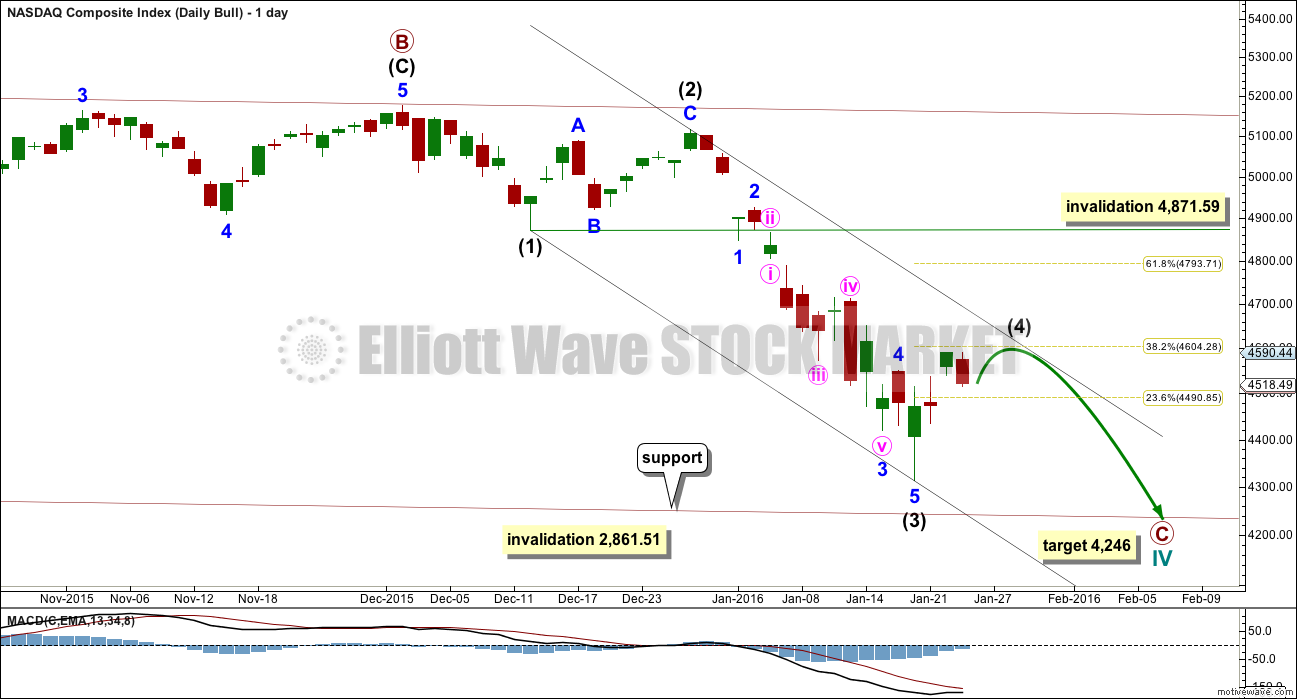
DAILY CHART
Click chart to enlarge.
Cycle wave IV would most likely be a flat correction, or at least the first structure within it would most likely be a flat.
Primary wave C must complete as a five wave structure. So far intermediate wave (4) is probably incomplete. It may end close to the 0.382 Fibonacci ratio at 4,604. It may find resistance at the upper edge of the channel drawn about primary wave C.
Intermediate wave (2) was a deep 0.8 zigzag lasting 10 days. Intermediate wave (4) would most likely be a shallow flat, combination or triangle. It may last a little longer than 10 days as these kind of structures tend to be more time consuming than quicker zigzags.
Intermediate wave (4) may not move into intermediate wave (1) price territory above 4,871.49.
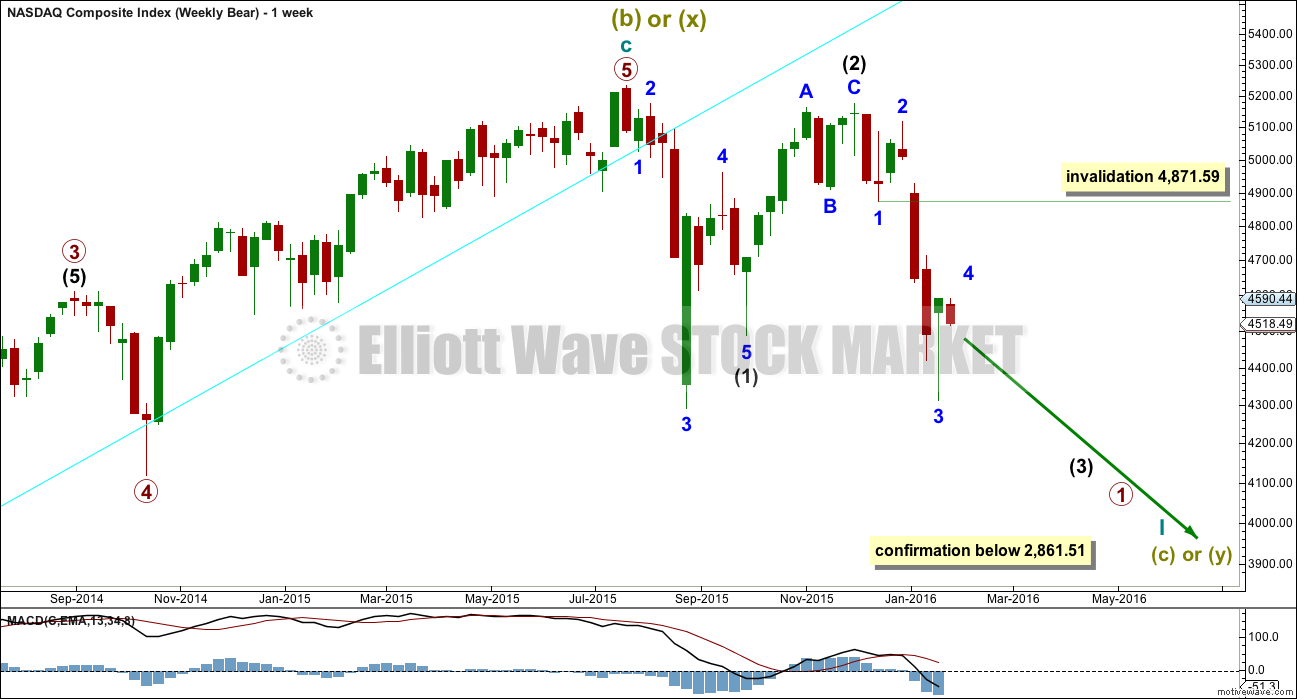
BEAR WAVE COUNT
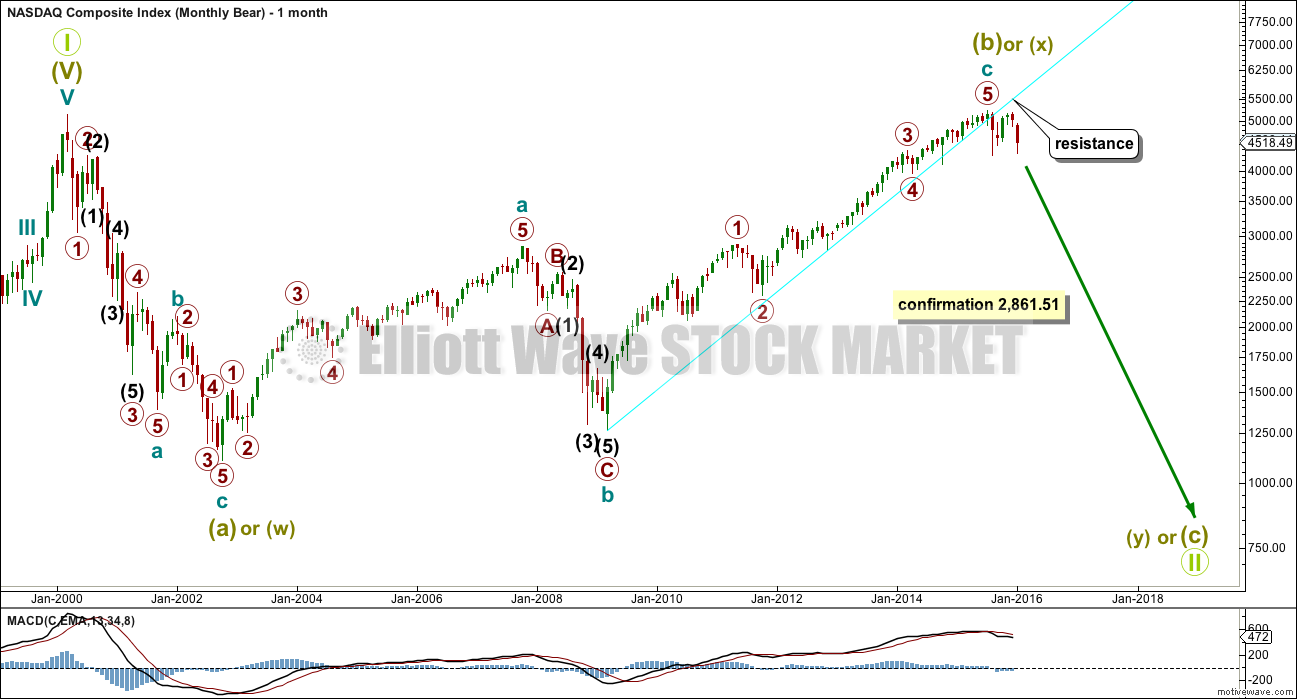
MONTHLY CHART
Click chart to enlarge.
The bear wave count just moves everything from the all time high at 5,132.52 all down one degree. Grand Super Cycle wave II may be an incomplete flat, combination or double flat.
A new low below 2,861.51 would invalidate the bull wave count and confirm a huge market crash.
All subdivisions are seen in exactly the same way, only the degree of labelling is different.
If Grand Super Cycle wave II is a combination, then super cycle wave (y) would be a zigzag or triangle.
If Grand Super Cycle wave II is a double flat, then super cycle wave (y) would be a flat correction ending about the same level as super cycle wave (w) at 1,160.
If Grand Super Cycle wave II is a regular flat, then super cycle wave (c) would be a five wave structure to end below super cycle wave (a) at 1,160 to avoid a truncation.
WEEKLY CHART
Click chart to enlarge.
The labelling of this upwards impulse is exactly the same as the bull wave count at the weekly chart level because 1-2-3 of an impulse subdivides 5-3-5, exactly the same as a zigzag. Here the bull market from March 2009 is seen as a zigzag for a super cycle wave (b). Super cycle wave (b) was a 101% length of super cycle wave (a).
Downwards movement from the all time high may be a first wave for intermediate wave (1), a deep second wave correction for intermediate wave (2), and now an incomplete third wave for intermediate wave (3).
Intermediate wave (1) may have ended with a truncation. This is possible after the prior move of minor wave 3 moved “too far too fast”.
With intermediate wave (1) seen as over with a truncation, the structure of intermediate wave (2) now fits better as a zigzag. It looks like a three.
Intermediate wave (3) must move far enough below the price extreme of intermediate wave (1) to allow for room for the following correction of intermediate wave (4) to unfold and not move back into intermediate wave (1) price territory.
DAILY CHART
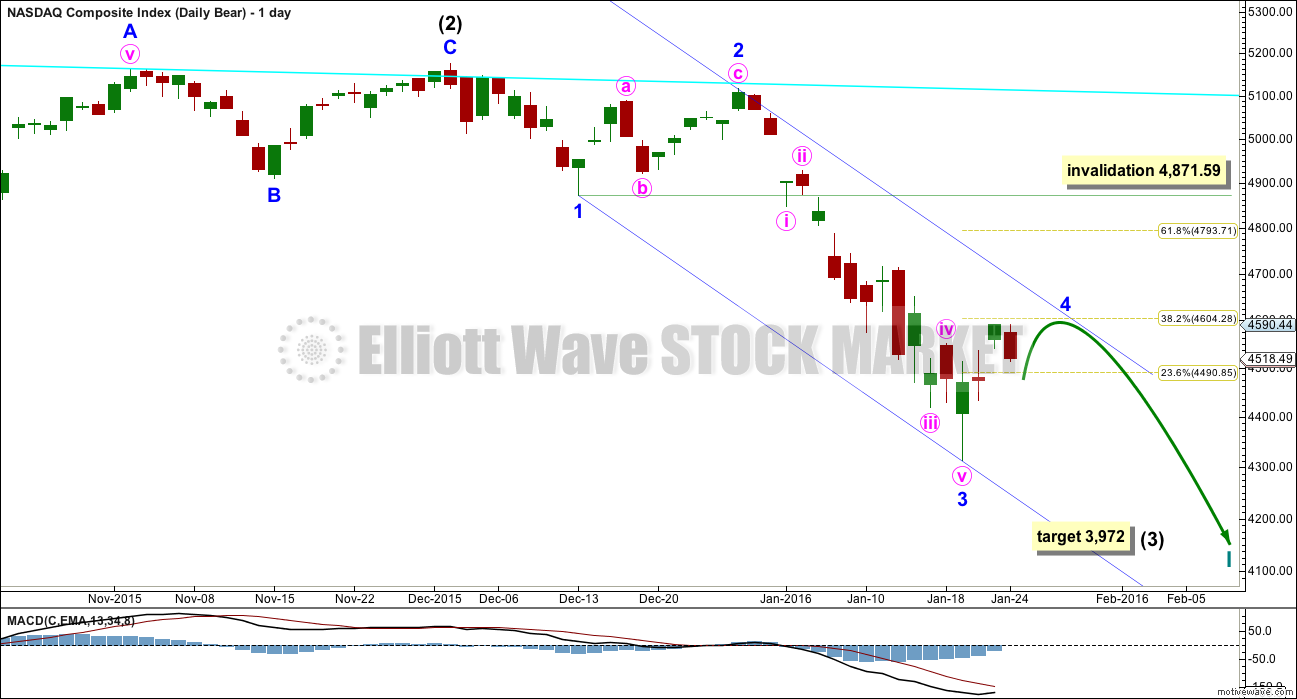
Click chart to enlarge.
Downwards movement for both bull and bear wave counts is seen in the same way as a five wave impulse. C waves and third waves will both subdivide as impulses. Third waves may only subdivide as impulses.
At 3,972 intermediate wave (3) would reach 1.618 the length of intermediate wave (1). This target expects that minor wave 5 will be extended.
Minor wave 4 may not move into minor wave 1 price territory above 4,871.59. If this invalidation point is breached, then upwards movement may be another second wave correction within minor wave 3. The invalidation point for that idea is at 5,116.99.
TECHNICAL ANALYSIS
MONTHLY CHART
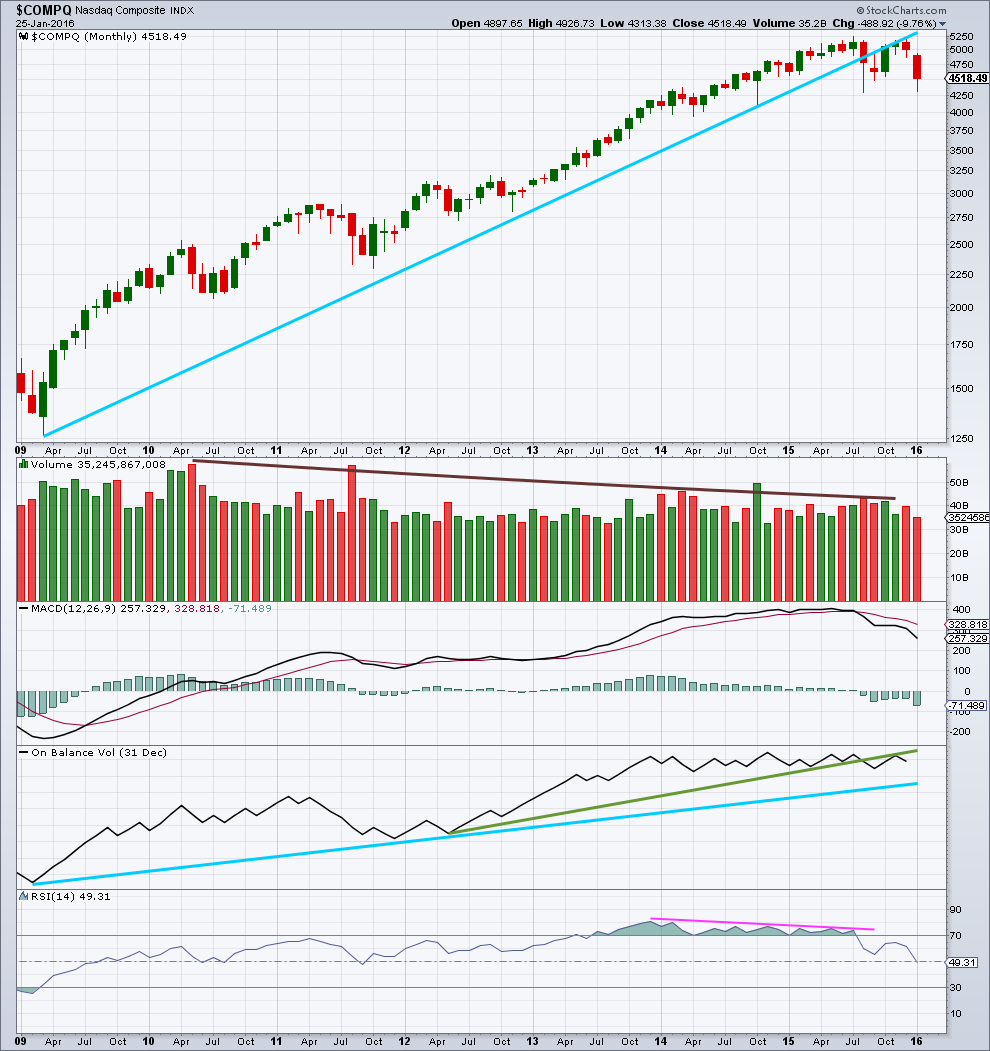
Click chart to enlarge. Chart courtesy of StockCharts.com.
A more conservatively drawn trend line from the end of March 2009 is drawn here (blue line). It was reasonably shallow, repeatedly tested, and is highly technically significant. It has been breached and provided resistance.
Since May 2010, overall, as price rose to all time highs volume declined. The bull market was not well supported by volume and is suspicious.
There was slight negative technical divergence with price and MACD at the all time high.
On Balance Volume has breached a trend line held since May 2012, (green line) which is bearish. OBV turned up and tested the green line which held. The strength of that line is reinforced. This is further bearish indication.
There is negative divergence between price and RSI going back to December 2013, as price made all time highs. This is a strong bearish indicator. This was also seen up to March 2000, and was followed by a 78% drop in market value to the low of 1,108 in October 2012. It does not mean that the market must make a similar fall at this time, but it is a strong bearish indicator.
DAILY CHART
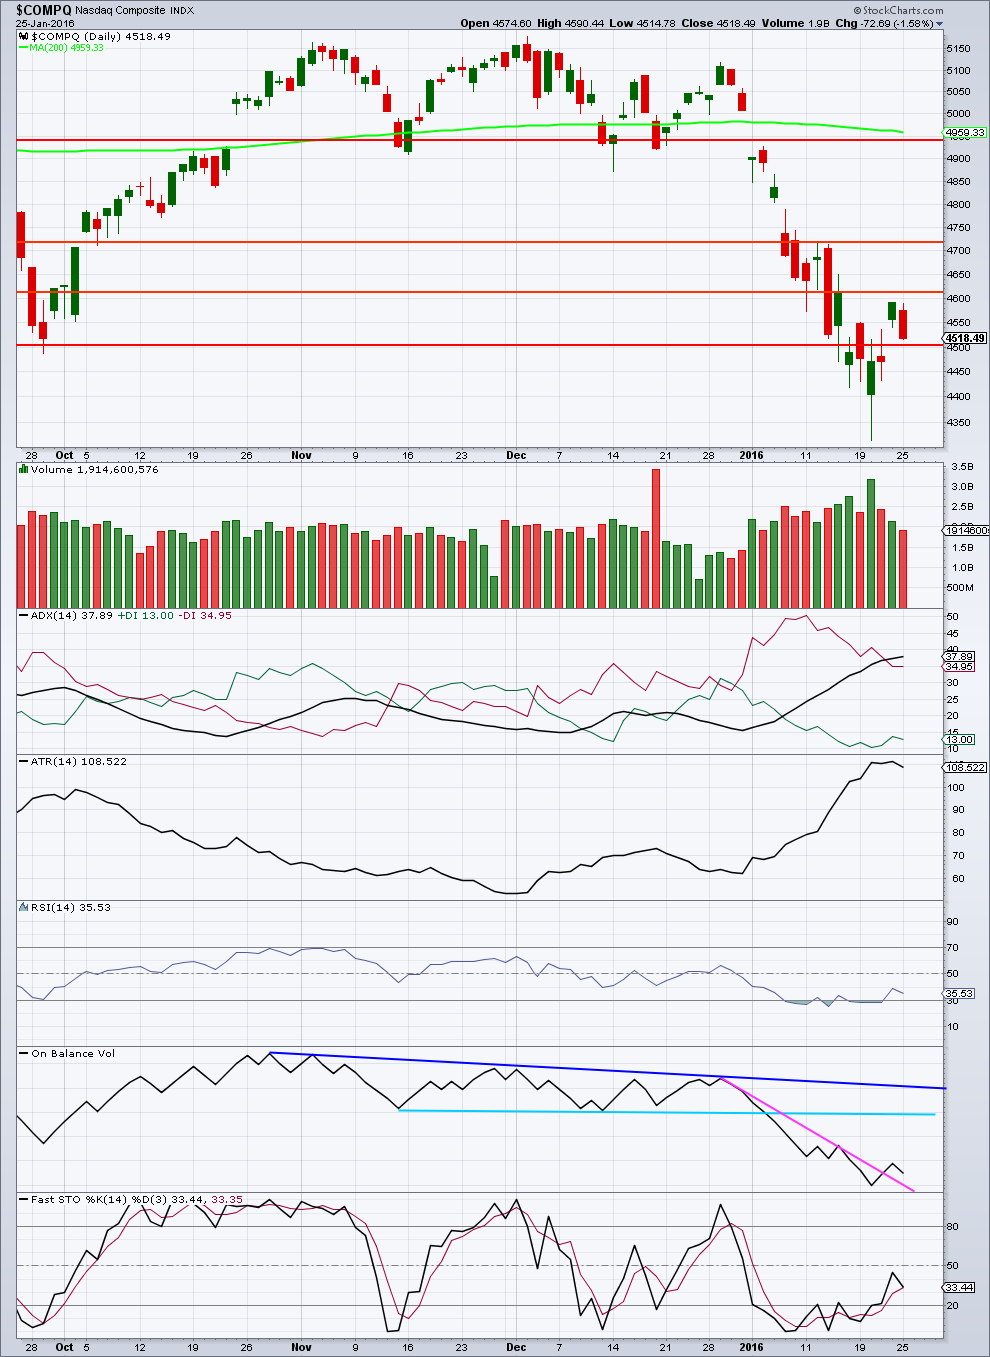
Click chart to enlarge. Chart courtesy of StockCharts.com.
Price came with increasing volume as it fell to the last low. The fall in price is supported by volume. The volume profile is bearish.
Price comes with declining volume as it has overall moved higher over the last four days.
ADX is delayed. It is still indicating price is trending and the trend is down. ATR today disagrees as it is declining indicating the market is consolidating.
Importantly, ADX has not indicated a trend change from down to up: the -DX line remains above the +DX line.
The correction is resolving RSI oversold. It is returning towards neutral.
On Balance Volume may find resistance at the blue trend lines.
The correction in price may end when price finds resistance and Stochastics reaches overbought at the same time. The first line of resistance for price is about 4,613. Thereafter, the next line of resistance is about 4,720.
This analysis is published @ 02:35 a.m. EST on 26th January, 2016.