Downwards movement fits the Elliott wave count. Price remains below the invalidation point.
This bounce is so far unfolding as expected.
Summary: This bounce is either another second wave correction or a fourth wave correction, and it should continue for a further five (more likely) or ten (less likely) trading sessions.
To see how each of the bull and bear wave counts fit within a larger time frame see the Grand Supercycle Analysis.
To see detail of the bull market from 2009 to the all time high on weekly charts, click here.
Last published monthly charts can be seen here.
If I was asked to pick a winner (which I am reluctant to do) I would say the bear wave count has a higher probability. It is better supported by regular technical analysis at the monthly chart level, it fits the Grand Supercycle analysis better, and it has overall the “right look”.
New updates to this analysis are in bold.
BULL ELLIOTT WAVE COUNT
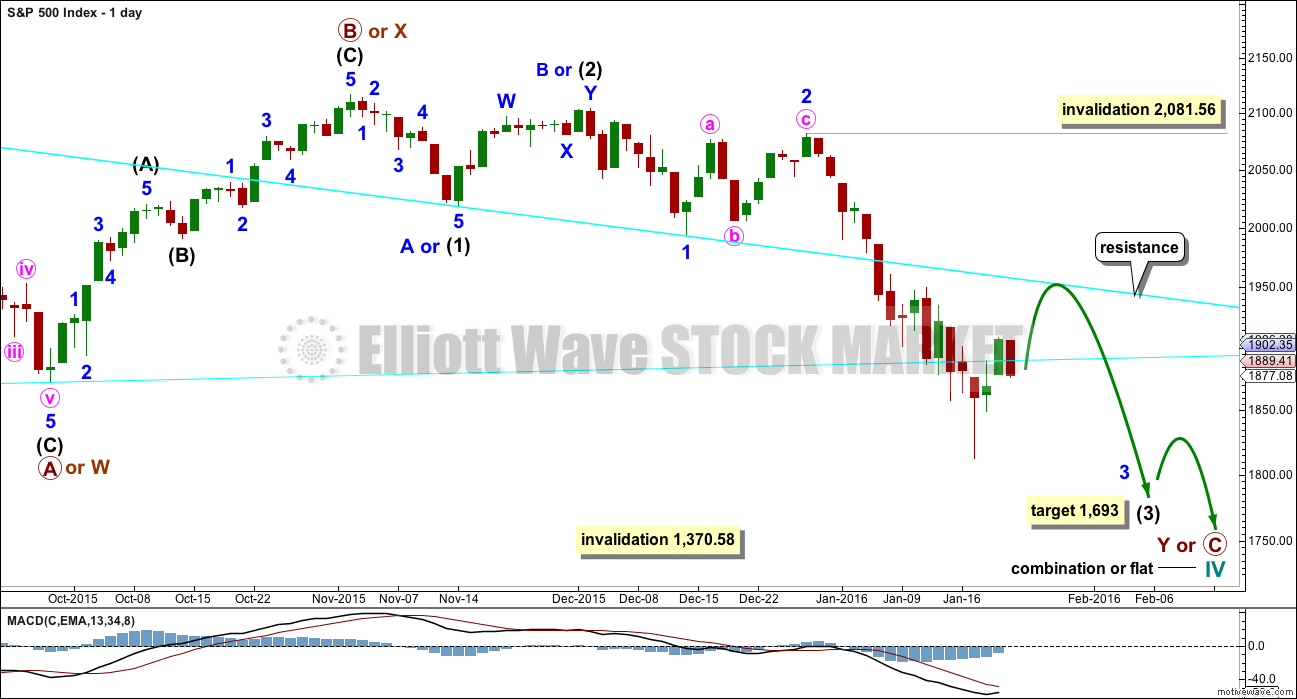
DAILY CHART – COMBINATION OR FLAT
This wave count is bullish at Super Cycle degree.
Cycle wave IV may not move into cycle wave I price territory below 1,370.58. If this bull wave count is invalidated by downwards movement, then the bear wave count shall be fully confirmed.
Cycle wave II was a shallow 0.41 zigzag lasting three months. Cycle wave IV should exhibit alternation in structure and maybe also alternation in depth. Cycle wave IV may be a flat, or combination.
Cycle wave IV may end within the price range of the fourth wave of one lesser degree. Because of the good Fibonacci ratio for primary wave 3 and the perfect subdivisions within it, I am confident that primary wave 4 has its range from 1,730 to 1,647.
Primary wave C should subdivide as a five and primary wave Y should begin with a zigzag downwards. This downwards movement is either intermediate waves (1)-(2)-(3) of an impulse for primary wave C or minor waves A-B-C of a zigzag for intermediate wave (A). Both these ideas need to see a five down complete towards the target, so at this stage there is no divergence in expectations regarding targets or direction. When and if these two ideas diverge, I will separate them out into two separate charts. For now I will keep the number of charts to a minimum.
Primary wave A or W lasted three months. Primary wave C or Y may be expected to also last about three months. It is now in its second month at this stage and may not be able to complete in just one more. It may be longer in duration, perhaps a Fibonacci five months. That would still give a combination the right look at higher time frames.
Within the new downwards wave of primary wave C or Y, a first and second wave, or A and B wave, is now complete. Intermediate wave (2) or minor wave B lasted a Fibonacci 13 days exactly. At 1,693 intermediate wave (3) would reach 4.236 the length of intermediate wave (1).
This daily chart and the hourly chart below both label minor wave 3 as complete. It is also possible that the degree of labelling within minor wave 3 could be moved down one degree, because only minute wave i within it may be complete. The invalidation point reflects this. No second wave correction may move beyond its start above 2,081.56 within minor wave 3. If this bounce is minor wave 4, then it may not move into minor wave 1 price territory above 1,993.26.
Price broke through support at the cyan trend line which is drawn from the August lows to September lows. This line is no longer providing resistance. The next line to offer resistance may be the downwards sloping cyan line.
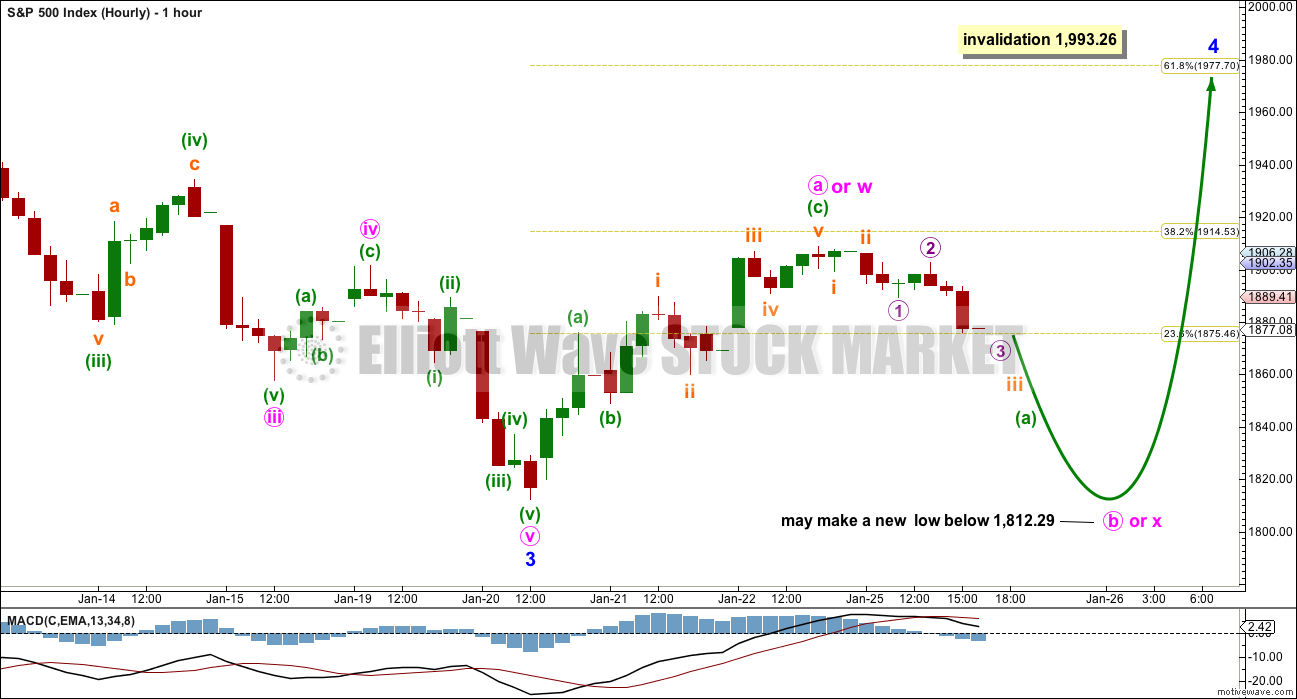
HOURLY CHART
At this stage, the bull and bear wave counts are essentially the same at the hourly chart level. Commentary will be with the bear wave count.
BEAR ELLIOTT WAVE COUNT
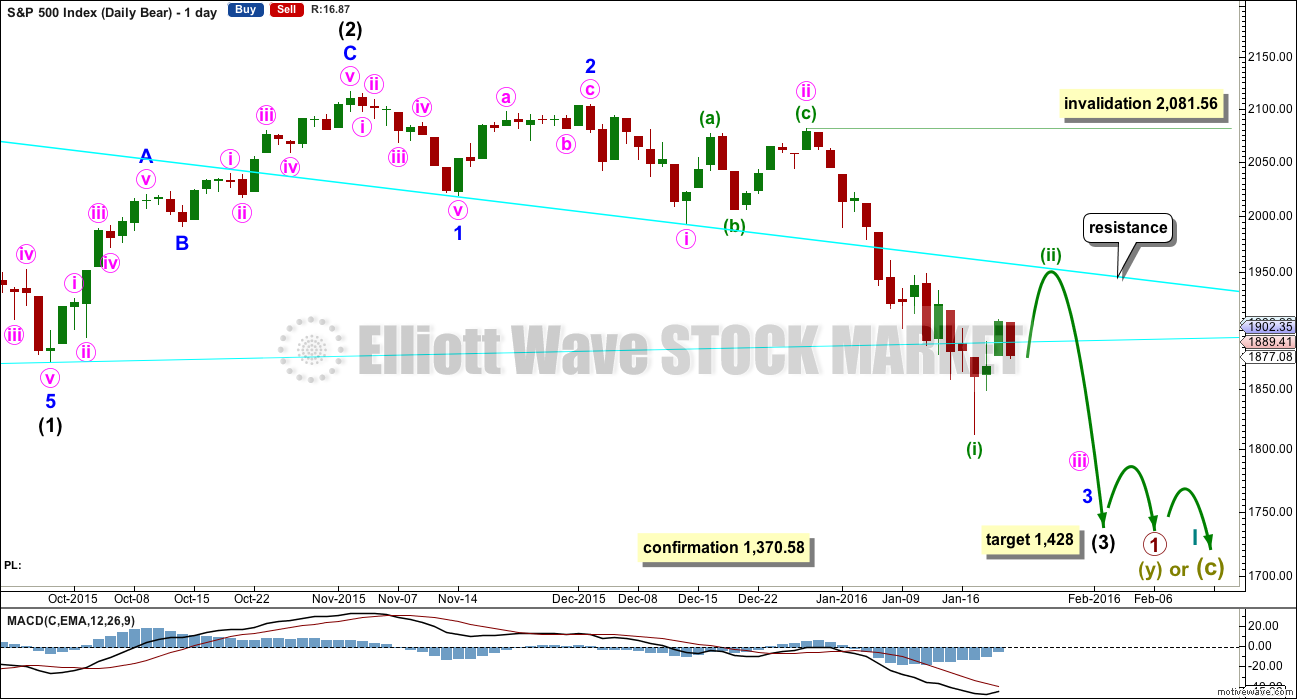
DAILY CHART
This bear wave count fits better than the bull with the even larger picture, super cycle analysis found here. It is also well supported by regular technical analysis at the monthly chart level.
Importantly, there is no lower invalidation point for this wave count. That means there is no lower limit to this bear market.
Downwards movement so far within January still looks like a third wave. This third wave for intermediate wave (3) still has a long way to go. It has to move far enough below the price territory of intermediate wave (1), which has its extreme at 1,867.01, to allow room for a following fourth wave correction to unfold which must remain below intermediate wave (1) price territory.
Intermediate wave (1) subdivides as a five wave structure with a slightly truncated fifth wave.
Ratios within intermediate wave (1) are: minor wave 3 is 7.13 points short of 6.854 the length of minor wave 1, and minor wave 5 is just 2.82 points longer than 0.618 the length of minor wave 3. These excellent Fibonacci ratios add some support to this wave count.
Intermediate wave (2) was a very deep 0.93 zigzag. Because intermediate wave (2) was so deep the best Fibonacci ratio to apply for the target of intermediate wave (3) is 2.618 which gives a target at 1,428. If intermediate wave (3) ends below this target, then the degree of labelling within this downwards movement may be moved up one degree; this may be primary wave 3 now unfolding and in its early stages.
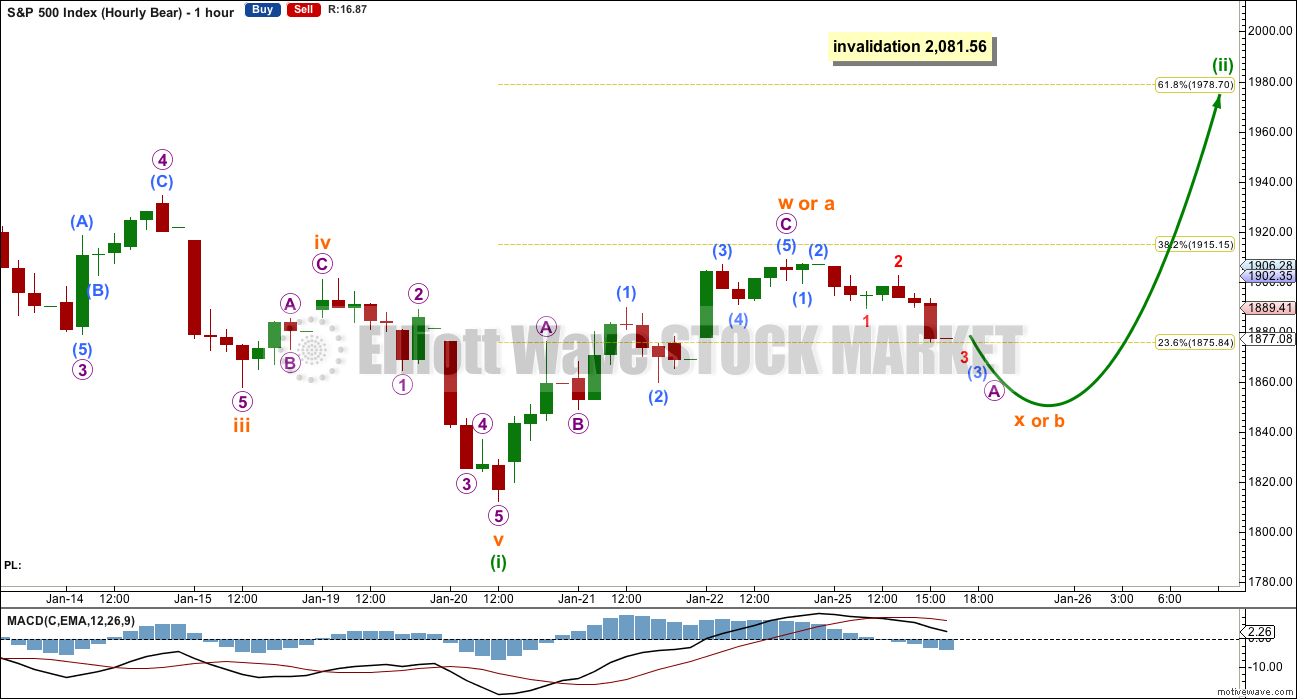
I have two scenarios for the correction which began two days ago. It may be either a second wave or a fourth wave. Looking at how far down intermediate wave (3) still needs to go on the weekly chart, I would favour the second wave scenario. That will be the main hourly wave count for that reason.
HOURLY CHART
If this correction is a second wave, then it would most likely be a single or double zigzag. Because the first wave up subdivides best as a three, a zigzzag, then minuette wave (ii) may be unfolding as a double zigzag.
Double zigzags normally have relatively shallow X waves that do not make new price extremes beyond the start of the first zigzag labelled here subminuette wave w. Subminuette wave x must subdivide as a three wave structure which may be any corrective structure including a multiple.
Minuette wave (ii) may also be a flat correction. Within a flat, the B wave must retrace a minimum 90% of the A wave which for this example would be 1,821.95. If minuette wave (ii) is the most common type of flat, an expanded flat, then subminuette wave b may move below the start of subminuette wave a at 1,812.29. There is no longer a lower invalidation point for this reason.
Minuette wave (ii) may not be a triangle.
When subminuette wave b or x is complete, then subminuette wave c or y should unfold upwards.
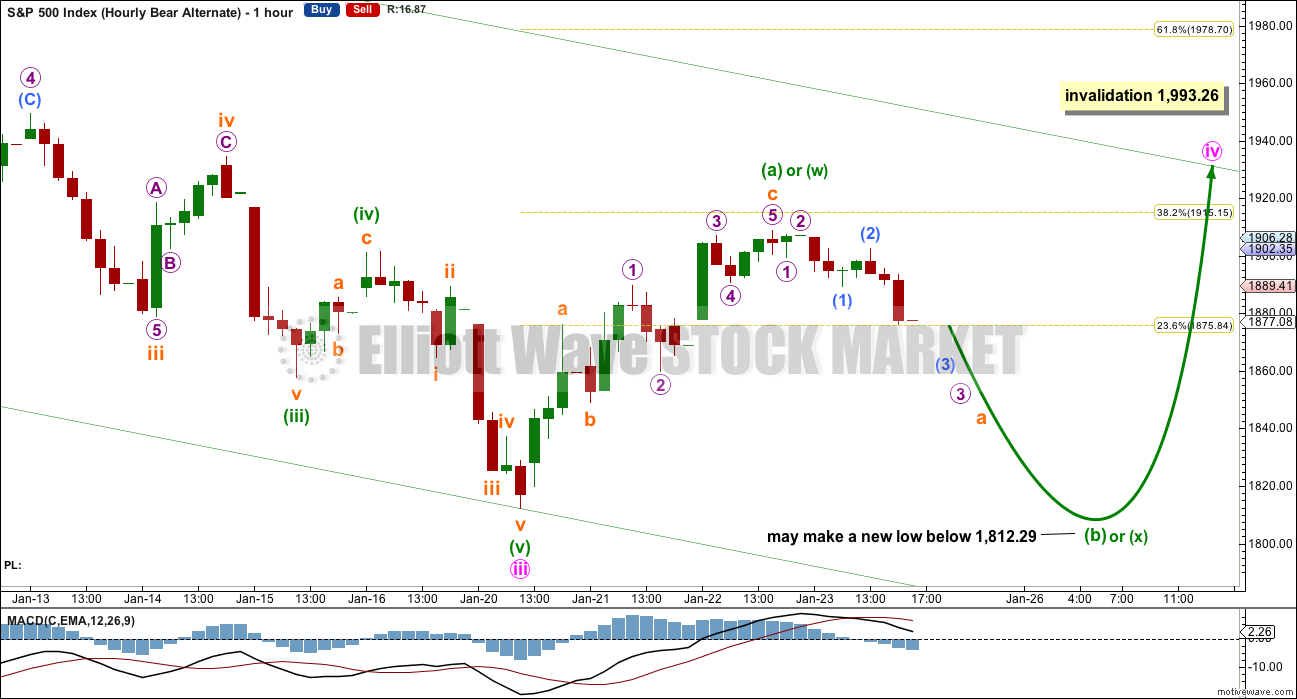
ALTERNATE HOURLY CHART
If the degree of labelling within the last wave down is moved back up one degree, then this correction may be a fourth wave.
This wave count expects that the middle strongest part of intermediate wave (3) is over. This may be the case; an extended fifth wave down to follow this correction may be able to take intermediate wave (3) down to the target.
Minute wave iv may not move into minute wave i price territory above 1,993.26.
The first wave up of minuette wave (iv) subdivides best as a three, a zigzag. This means that minuette wave (iv) may be unfolding as either a flat, triangle or combination.
Within an expanded flat, running triangle or combination, minuette wave (b) or (x) may make a new price extreme beyond the start of minuette wave (a) or (w) below 1,812.29. There is no lower invalidation point for this wave count.
Minuette wave (b) or (x) must subdivide as a corrective structure. It may be any one of 23 possible corrective structures. So far I have labelled it as an unfolding zigzag, but it may yet morph into a different structure and the labelling may change tomorrow.
Overall, it must be understood that when price is within a consolidation as it is now it is impossible to tell which Elliott wave structure will unfold. A fourth wave may be any one of 23 possible structures. The labelling will change as the structure unfolds. It is impossible to tell what pathway price will take during the correction due to the great variety of corrective structures. My focus will be on determining when it could be over.
The structure is incomplete today. I would expect more sideways / upwards movement for a few days yet.
I would not want to label this correction as a complete zigzag at the high of 1,908.85. It would be far too brief. It is most likely incomplete.
TECHNICAL ANALYSIS
DAILY CHART
Click chart to enlarge. Chart courtesy of StockCharts.com.
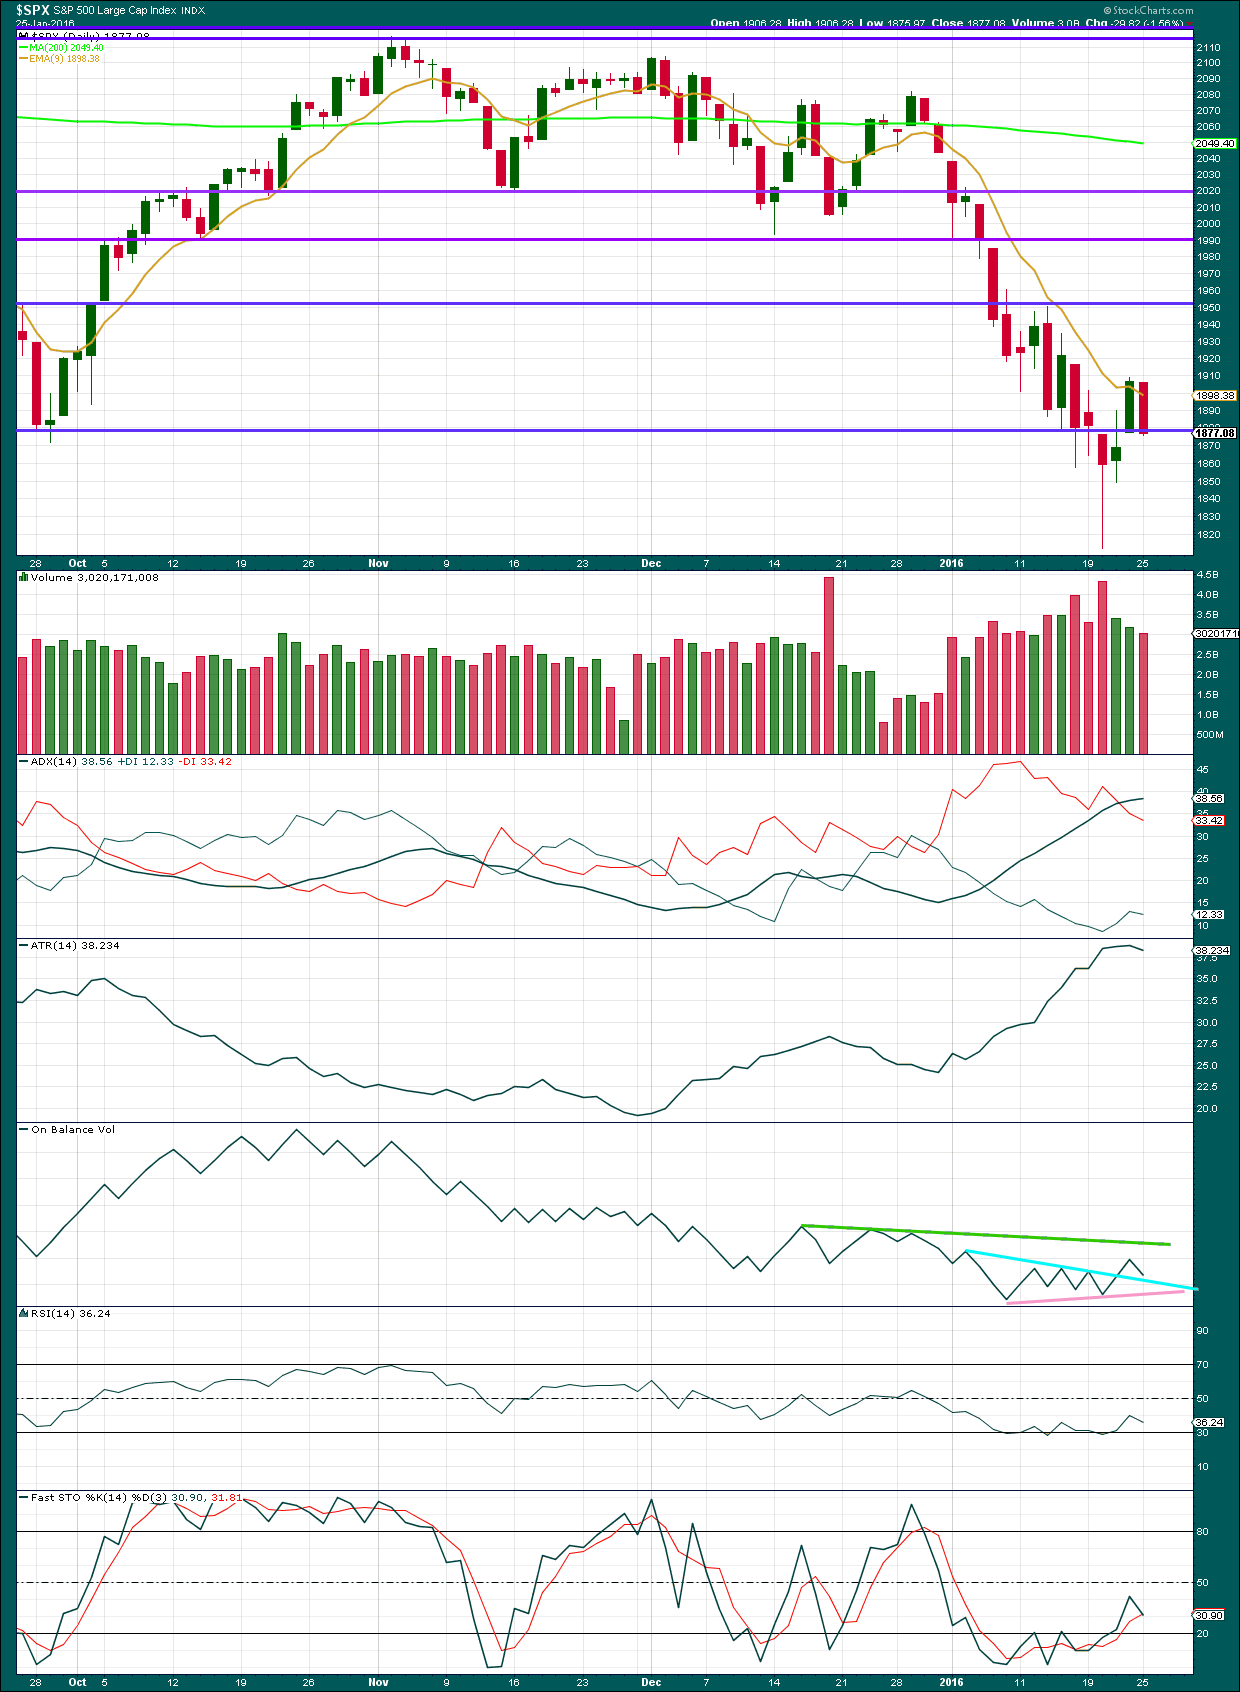
Importantly, today’s downwards day comes with lighter volume. The fall in price was not supported by volume. This downwards movement should be viewed as part of a correction. This supports the Elliott wave counts.
If a correction is unfolding, then as price moves sideways / upwards it should come on declining volume.
The volume profile is still bearish. As price fell to the last low it came on clearly increasing volume. Now price has overall moved higher on declining volume.
ADX still indicates a trend is in place and the trend is down. ADX is a lagging indicator as it is based upon an average. Importantly, it does not indicate a trend change today; the -DX line remains above the +DX line.
ATR now disagrees. It is declining indicating the market has entered a consolidation.
The pink and blue trend lines on On Balance Volume are adjusted today. OBV may find support at the blue line. If it breaks below that, it may find support at the pink line.
The correction is returning RSI and Stochastics from oversold.
DOW THEORY
For the bear wave count I am waiting for Dow Theory to confirm a market crash. I am choosing to use the S&P500, Dow Industrials, Dow Transportation, Nasdaq and I’ll add the Russell 2000 index. Major swing lows are noted below. So far the Industrials, Transportation and Russell 2000 have made new major swing lows. None of these indices have made new highs.
At this stage, if the S&P500 and Nasdaq also make new major swing lows, then Dow Theory would confirm a major new bear market. At that stage, my only wave count would be the bear wave count.
The lows below are from October 2014. These lows were the last secondary correction within the primary trend which was the bull market from 2009.
These lows must be breached by a daily close below each point. So far the S&P has made a new low below 1,821.61, but it has not closed below 1,821.61.
S&P500: 1,821.61
Nasdaq: 4,117.84
DJT: 7,700.49 – this price point was breached.
DJIA: 15,855.12 – this price point was breached.
Russell 2000: 1,343.51 – this price point was breached.
This analysis is published @ 09:08 p.m. EST.

Any ideas on how to short the FTSE from US stock markets other than using EPV (Proshares Ultrashort FTSE)???
Thanks in advance…
I have an account with CMC Markets and you can short the FTSE using a CFD.
Thank you…
Me too 🙂
looks like we test the downside again tomorrow,, Apple is down afterhours, oil took a dump after an inventory report, futures pointing down .
Probably not. Futures price action doesn’t give any actual direction until it is persistence into the open. Applying the same logic we should have opened at 1850 but we didn’t – this market is voting it wants higher!
Just because the banksters bought the futures from deep in the red last night does not mean they are going to again do it successfully overnight. If you have been paying attention that is usually a warning of impending downside in the near future…
Good luck tommorow holding short is all
I’m saying!
One company doesn’t dictate the market….
true,, but Apple is the most weighted stock in S&P and Nasdaq 100
Let us see. Probably tommorow right before the fed rate cycle. The dow can wipe out 100 points in 1 sec lol. I have seen that price action. So, again – I dont trust this market to the downside. Nothing supports that now. We are in a second wave to go higher. We could get rejected at 1920-1940 then head back to 1970-2000. I honestly give up trying to explain markets.
All the Favorite Momentum Players on the way up… will be big losers on the way down. Market Cap to Revenue shows me extreme over valuation for AAPL, AMZN, GOOG & all the others just like this. When margins start contracting… valuation is then all about the multiple of revenue + free cash.
Just pick a spot to short and enjoy the ride down for the next several months. I doubled up my Triple Short ETF today. The other initial half was at S&P 500 … 2100-2115
Too many of these moves occur over night + 200+ / – 200+. I am not going to get trapped chasing.
EW is a medium/long-term guide for me.
Joseph
January 26, 2016 at 12:41 pm
All in Short… right here!
ok man – good luck!
I never cease to be amazed at people who waste time getting all hot and bothered about what the market is going to do on any particular day; this kind of thrashing around makes absolutely no sense if you rely on EW analysis to inform your trading decisions. Frankly, it really gets a bit tedious having to listen to it… 🙂
All I am saying is no need to rush to get short in a consolidation.
You have been very persistence with your views which some have played out and some have not like all traders. But EW is only calculation after the market is closed and trying to predict during trading hours is not helpful to be honest.
I have been through this so many times. It is painful to sit through.
But everyone has their own style. EW or Not market is not going down here as far as I can see.
Oh, I want to answer your oil inquiry and why the market didn’t drop soon after. WTIC dropped the other day because in 2 days we did almost +20%, so that is normal to pull back after such a surge.
The way the market is trading now is what I like to call “syncopation” and it is designed to frustrate bulls and bears alike, particularly the ones trying to make short term trades. Essentially every time you zig, the market zags, and vice versa. If you went short based on what the market did yesterday and did not take profits intra-day, today you got stomped. I suspect those going long based on what the market did today are going to get stomped tomorrow. Lara’s advice about trading these kinds of corrections for those not extremely skilled is worth heeding. I could certainly be wrong, but I am not prepared to trade this market to the upside. My very last upside hedge got filled on an open order to sell at the close. Best of luck to those of you prepared to do so… 🙂
Based on your post views. I must say you tend to draw conclusions fairly quickly. Imo- You can’t make sense of this market all the time. It is basically telling us now over the past 4 days out it definetly doesn’t want to go lower. So in all fairness trying to draw a conclusion on 1 day price action as you noticed yesterday really didn’t pan out.
Now what would really help everyone – is some reasonable out look – Not to bearish not to bullish – see my point ?
More than likely based on everything I am reading you will point at central bank or banksters if this market goes to past 1950 to 2000 within 2 weeks.
Price is choppy and overlapping, moving generally upwards. Volume is declining.
That looks like pretty typical corrective / consolidating behaviour to me.
And avoiding a consolidating market is what all my TA textbooks tell me to do…
So far price seems to be moving from resistance to support, and back again, between about 1,908 and 1,875. It looks range bound.
Now that is not to say that this range must hold, it could extend. Price could yet move higher.
But volume doesn’t support the rise in price. Volume indicates this market is consolidating. ATR is declining.
Looks textbook to me, and seems a reasonable conclusion to draw to avoid it ATM
The problem for me is picking a short entry. Should we go higher 3-4% over 2 weeks that would crush the put options. I think it’s best to wait until
The weekly candle closes. We could be in for a bumpy ride up!
If you are buying put options with only two weeks to expiration you have a serious problem and should talk with one of your mentors… 🙂
I did weeklys at one point boy I tell you those are nerve recking but worth it.
I tend to use month or 2 out but even in this case those are very dangerous.
This move up could crush those contracts instantly…
They are dangerous if you don’t know what you are doing…as is the case with many an endeavor…
hi
all
I am confident we are in a second wave correction to 1993… good luck…
thank you!
Stop talking about it and go ahead and trade it then….let me know when you get filled and at what price 🙂
I can’t talk that much durring the cash session – I don’t have that much free time like you – But I was long qqqs and down and looking for an up move I’ll take 4-5% any day!
Qqq calls always make money on a bounce !
104 is a good entry IMO
there. I don’t trust this market to be short here. No setup to me if anything a nice bear trap!
Jack
What a nice close today. I think the risk is to the up side here and not down side imo. What a funny market I tell you can’t even get a 20% correction since 2011 lol! Oh, and the best part – those corporate buy backs start next week – so the buy programs kick in full force….
Verne
See you at near SPX 2,000.
laters…
nobody knows, but there is a lot of damage on the charts above the current level to expect a 1000 point move to the upside without a retest of the lower range.
I come to add and share ideas that I think are great when i get a moment away from the trading screens. I think you asked me what I thought last week about going long if I recall or rather if I was going long? Look it how it played out just like I said it would just by a difference of closing an open but pretty spot on if I might add imho. I have tons of trader friends that have +25 years of experience we talk markets with passion some elliot wave folks and some hard core traders using technicals only. The experienced trader community consensus I am part of is we are probably and most likely not going down until we tag those higher levels in the next couple weeks.
In fact they pulled a good fast one over night. The “globex” low was 1850. Those tricks always work. So all the people saying we never got near the lows well this is how markets can stall for the time being. Today MACD cross signal confirmed.
So, i wouldn’t hold my breath here waiting imho.
I will return later on.
laters…
Exactly what great ideas are you intent on sharing options? 🙂
I gave the qqqs call on the range you could make some good change on that!
It’s better than shorting to early no ??
Why don’t you just tell us what you are buying, how much you paid for it, and when you sell it? That would be useful and convincing information instead of all the braggadocio about what “right” calls you made. Nobody cares about your calls, we are all here to make profitable TRADES! Capisce??!! 🙂
I will be selling UVXY calls bought at support around 41.50 at the open tomorrow…
PS. I will also be reloading upside hedges on the dip tomorrow, which if you had been paying attention to how the market has been trading, should have been a reasonably anticipation, instead of all the clap-trap about SPX 2000… 🙂
What is true is nobody really knows the future but very market experienced professionals with an objective views on how markets function can really be a good guide. That is how i learned. From the best out there. Investors, traders who won and lost…
Well, if we wake up to 2 airplanes slamming into the New York skyline you can take all the professional analysis and flush it down the toilet. News trumps the charts. There are 2 sides to every trade…a winner and a loser.
Sorry but we have no fly zone in NYC in certain areas – it won’t happen. All these great laws got passed here to protect us.
You could be onto something but North Korea was bluffing!
No worries
Tommorow the Bears are going to either be happy or sad most likely sad when the shorts lose value as volatility heads to the teens ….
Be safe out there. I don’t trust this market to be short here. No setup to me if anything a nice bear trap!
I am not sure why you expect to see me, of all people, at SPX 2000; you are really quite funny…. 🙂
Jack
The ES case is clear as well. Strong choppy momentum to the upside and It is better to wait for the paint to dry before a short!
Jack
After further analysis – more than likely we are going to SPX 2000. In fact the middle Bollinger band reconnect is basic technical analysis and it will provide a reconnect after a brief correction. Nothing to see here for more downside at the moment for weeks. Chop, chop boring….
Verne
I got to give you credit for getting in early last time at the top before 2116 around 2100. The major difference was we had been in an uptrend and now we are stuck in tricky downtrend with clearly defined moving average reconnect targets. But I think doing so now and if we have approx +5 to 6% potential upside is to early here and we could be looking at an 3rd wave into April sell off now. By the time we push past 1950 those options could just lose 50% in my experience. Let us wait and see. There is no basis to go full short here as there is no reversal signal to me. In fact, my educated guess with the IHS on the 1hr-SPX 2000 is on deck with full force…
Verne
I called this move down we had yesterday last week. The only difference was it happened at the close but it still was a great call going into Monday this week- imo.
There are still so many structural possibilities I can see for this correction. I could publish several hourly charts… but really, that would be trying to pick the pathway price will take during this correction and that is a fools game. Too much variety in possibilities.
What I can say is it is still not over.
If today closes with lighter volume, up or down, then that view would be strengthened.
So far the B or X wave may be shallow… or it may be only halfway through.
B waves are the absolute worst. They tend to be the most complicated to analyse, nightmares to trade… B waves are when you avoid the market and preserve your capital.
The next analysis will probably not change much. I’m expecting this bounce to continue. Choppy and overlapping for a few more days, with upside potential (but it doesn’t have to).
Actually, one thing to add is that if a triangle forms then we will have certainty as to which scenario on the hourly chart is correct. Because a second wave can’t subdivide as a triangle for the sole structure. So it would have to be a fourth wave.
FTSE is clearest of all the indices I have wave counts for. There this correction absolutely cannot be a fourth wave, it must be yet another second wave.
Well said about trading B waves. I learned the hard way. Corrections overall are very difficult to trade. At least for me. The market likes to humble me when I think I can guess which one of 20+ possible corrective wave counts is about to materialize.
Me too. I avoid B waves like the plague.
It is the trades I don’t take which make a difference between profit and loss.
I’m waiting on the sidelines patiently for this correction to complete. Then I’ll draw a channel about it and wait for that to be breached. When its breached I’ll enter short.
On S&P and FTSE too. Especially FTSE. The wave count is clearer there.
Nothing much left to see IMHO. We may see a final spastic jump to the upside but I sure would not want to be trying to climb on the back of this bear when he finally goes on the rampage. For the perennially cautious, a few stink bids set to execute on a final pop may be a way to get positioned without too much stress and reduced risk. Best of luck to everyone!! Bye’ all!
Verne
Just another pattern that has developed. IHS. I think being early on a short here could be way costly and cause a big hit to a short. imo – we won’t get a final pop. With the VIX getting pushed lower the market could grind higher for 1-2 more weeks. Just saying. With low volatility you get slower movement to the upside on spx in my experience and once we break below 20s on the VIX we are set to land in the high teens – maybe 18 to be honest.
Why on earth would I care about what you think is a “possible” IHS pattern when the expert we are following has clearly told us (and demonstrated) that the trend is down, and that we are currently in a corrective wave?! Will you get a grip for heaven’s sake?
Well because i thought you are open to ideas to the upside in a down trend. No worries. Now that you have expressed you dont care. I won’t share my ideas! All the best!
Bear raid on SPX 1900. Can the bulls defend it??!!!
This ought to be REAL interesting. If they want to keep the rally going for a bit longer, they have to hold it…no bull…! 🙂
where are we in the wave? if we close under 1900?
We’re in a correction. And it’s not done.
Really, that is all any Elliotician could tell you with any reasonable confidence.
I think we’re in the middle of it still… halfway or possibly just over halfway done.
UVXY putting in triple bottom. Break of 42.50 means more upside…close above 50 means that’s all she wrote…
Correction- break of 41.50 for UVXY…
They need to hold onto SPX 1900 into the close, then deal with massive overhead resistance in 1920-1950 area. Good luck with that… 🙂
Cashing in rest of upside hedges. Loading rest of short positions. I may be a bit early, but you know what they say about the early bird… 🙂 🙂 🙂
All in Short… right here!
Have put stops on all the long hedges from today at opening points. Shorts are in place and looking to ride this wave all the way down. Praying that it turns up sooner rather than later
Vern–you referring to just today’s move up or are you believing this entire correction about done? No 1920, 1950, 1980 ?
I don’t think it is done, but I do think it has limited upside. I try to avoid getting into a situation where I am chasing the market so I don’t mind getting positioned a bit early. I made that decision after observing the trading action around 1900 today.
One wise mentor once told me not to ever chase the market, but let it come to you – sometimes that involves letting it run away from you first… 🙂
Banksters showing a little sophistication in saving fire power for the opening as opposed to juicing the futures market. Still struggling to re-take SPX 1900. The close should be interesting. A close above probably means a romp a bit higher…
Problem is the technical SPX MACD daily is ready to cross over. It looks like this could potentially take weeks once the cross over happens if it does. It all depends on what happens tomorrow. Just saying…
I agree Ace. Yesterday the 4 hour MACD had a bullish crossover. I suspect we will see the daily cross over today or tomorrow. Since the daily was at such an oversold condition, it has a lot of room to the upside for a sustained rally. It looks to me that the 61.8% retrace to the 1978 area is the next move.
Yeah i saw that too. o.k, i am out – till next time…
laters….
It has been quite some time since market has seen a weeks long market rally. Since the last time that happened, market internals have deteriorated considerably with many more stocks registering 52 week lows. That view is I think overly optimistic. I suspect the next pop higher will be sharp and brief.
Verne
Please expand on this statement you made:
“The pattern seems to be a volatility spike around the middle of each month so I would anticipate an interim bottom around the second week of February.”
Do you mean 1,550 SPX level for an interim bottom?
I would expect that level to coincide with the end of intermediate three of primary one down and a corresponding capitulation spike in volatility. That does not mean however, that this is the way it is going to unfold…meanwhile, volatility continues the cobra coil…
Jack
What is your take? I like to keep my bearish view but now SPX 1,980 or 2,000 seems highly likely. This price action is looking very bullish dont you say?
Hi
All
What would be a real good analysis is if anyone has the average duration of 3rd waves?This would be great! I find it difficult to undesrstand that this would go on for more than +4 months.
Thanks!
A good question.
If you haven’t already download and print out the Wave Notation sheet on the right hand sidebar of the site.
Intermediate degree waves (this is a third wave at intermediate degree) should last weeks to months.
Now that is rather vague. But it most certainly does expect an extended intermediate degree wave to last months.
This third wave is extending, that is not only common for the S&P but extremely common. It almost always does this.
When third waves extend in price they also extend in time. Its like they’re stretched. And when they stretch their subdivisions show up at higher time frames.
This is my wave count for primary 3 within the prior bull market. It shows how extended intermediate (3) within it was. Intermediate (3) there lasted 291 days.
Thanks. So, based on that. What are looking at with our current setup? Are we 90 days into this 3rd wave by month end jan 2016?
No. We are 56 days into the third wave today.
There are only two more days left in January.
So we will only be 58 days into it by end January.
I only joined here in nov 2015
Do we count days or trading days?
Verne
Aren’t bear market rallies fast? Since we have been confirmed in a downtrend. So, this should be done on the shorter time frame projected to limited upside – no? No jinx!
Verne
Could this be a warning to the upside?
or just a head fake in your experience?
The crossover could happen; the black line could also intersect and continue South. Price action is the final arbiter. In this environment, risk is clearly to the downside IMHO and I still see a bearish rising wedge…UVXY has drawn a line in the sand at 43 and I want to see that breached before I have any confidence in much upside potential…
Verne
We have been in this sideways pattern from Nov 2015 to Dec 2015. Then Jan 2016 we started really heading down and now it is coming to 3 full months. All we could muster was only a small decline from 2080 to 1812. Something should happen in Feb 2016 no jinx. March 2016 would be to much don’t you think?
I must say I am quite amazed. It would appear that the grip of the super cycle bear is tightening on global equity markets and even the banksters are starting to feel the squeeze. The apparently lack of either the ardor or the ammunition (or both!) to drive futures sky high and send would-be bears scurrying for cover so to speak, is quite revealing. Eight itsy bitsy points is all they can muster??!!
This is the most bearish tell I have seen in quite some time….even oil is showing some bullish inclinations! I am watching last Wednesday’s low very closely… 🙂
Yep, I always go back to this article online on 3rd waves. It has so much details on the last Aug flash crash. Check it out:
http://www.elliottwave.com/freeupdates/archives/2015/08/26/Stocks-What-a-“3rd-Wave”-Down-Looks-Like.aspx#axzz3yMI2Qptg
Lara, I appreciate you strive to master the summary –2 or 3 sentences tell me what I need to know ( Joda was never vebose).
Thank you Davey 🙂
Surf good. Wave caught.
Maybe one day I’ll entertain you all with a vid from my GoPro on the nose of my board.
Sweet! 🙂