Again, I have only bear Elliott wave counts for FTSE.
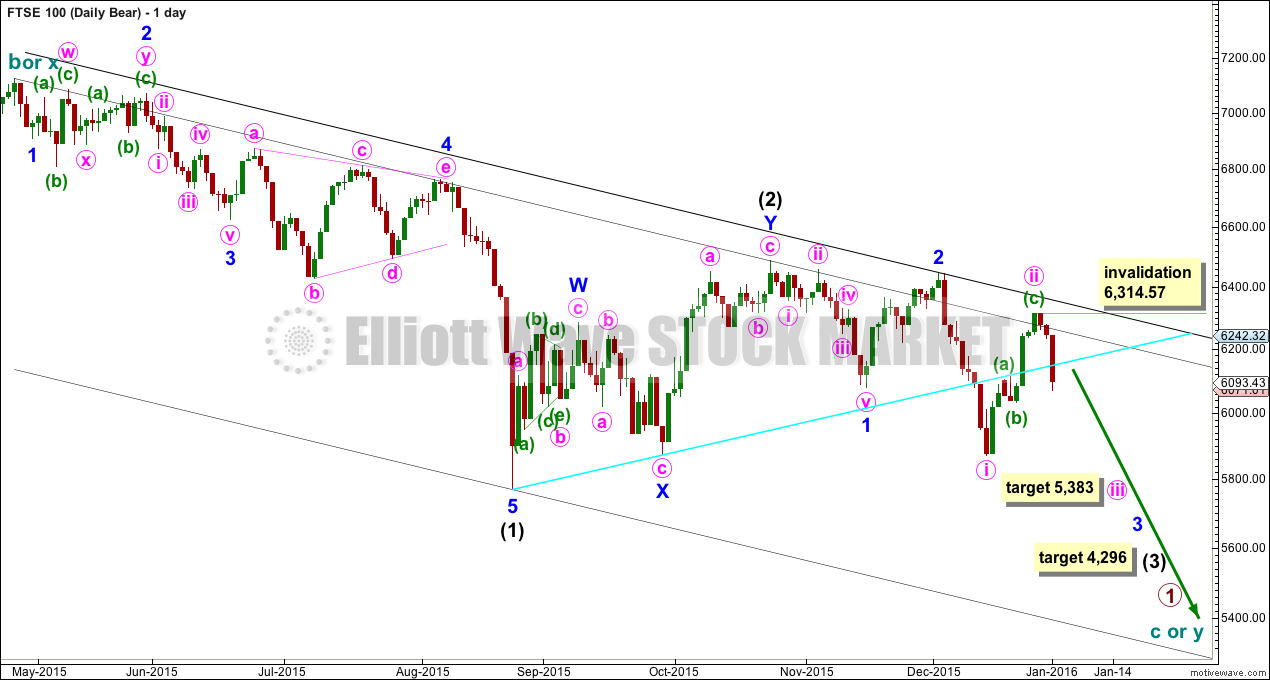
Summary: FTSE may be within the middle of a third wave down. The middle of the third wave may end at 5,383.
To see monthly and weekly charts and the bigger picture see last analysis here.
New updates to this analysis are in bold.
MAIN WAVE COUNT
The current wave down for FTSE may be a strong third wave. It is my judgement that this wave count has a higher probability.
If the next wave down shows an increase in momentum, then this would be confirmed as the preferred wave count for FTSE.
At 4,296 intermediate wave (3) would reach 1.618 the length of intermediate wave (1). When minor waves 3 and 4 within this impulse are complete, then the target may also be calculated at minor degree. At that stage, it may widen to a zone or it may change.
Within intermediate wave (3), I am removing the target for minor wave 3. It will again be calculated when minute waves iii and iv within the impulse are complete. For now I want to focus on the next interruption to the trend expected at the end of minute wave iii.
At 5,383 minute wave iii would reach 1.618 the length of minute wave i. If this target is wrong, it may not be low enough.
Minute wave ii was not over as expected at last analysis but moved higher. It is more likely to be over now that it is a clear three wave structure. Minor wave 2 one degree higher was deeper at 0.9 and longer lasting at 12 days than minute wave ii which was 0.77 and lasted 8 days. These corrections are still in proportion giving this part of the wave count the right look.
The lower cyan trend line is slightly adjusted. If it is drawn from the swing lows of 24th August to 29th September, then it shows where price found resistance on 18th and 21st December. Price has closed below this line today which may provide some resistance for a small bounce. If that happens, then it may present a good entry point to join a downwards trend.
The black channel is a base channel about intermediate waves (1) and (2). Intermediate wave (3) should have the power to break below support at the lower edge of this channel.
ALTERNATE WAVE COUNT
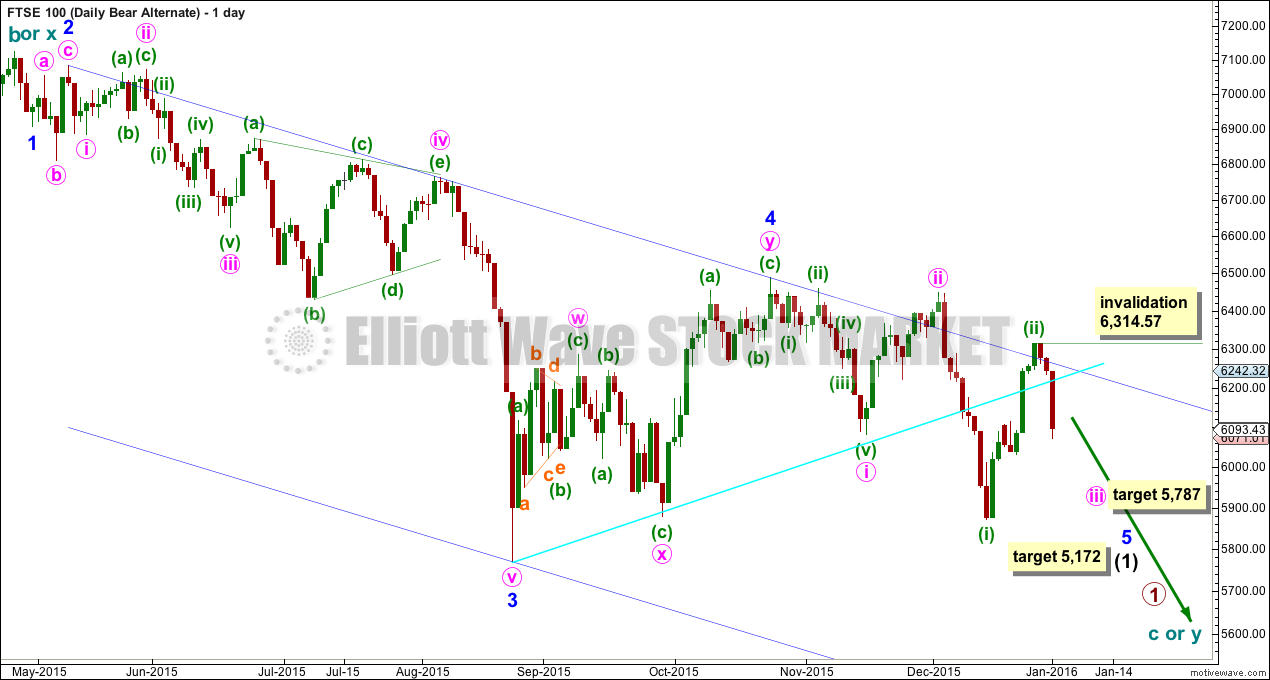
So far downwards movement may be 1-2-3-4 with a fifth wave needed.
If the next wave down shows a decrease in momentum beyond that seen for minor wave 3, then this wave count would be preferred. At 5,172 minor wave 5 would reach equality in length with minor wave 3.
The Elliott channel is not working perfectly, but it may still show where price may find some resistance along the way down.
Within minuette wave (iii), no second wave correction may move beyond its start above 6,314.57.
At 5,787 minute wave iii would reach 1.618 the length of minute wave i.
TECHNICAL ANALYSIS
DAILY CHART

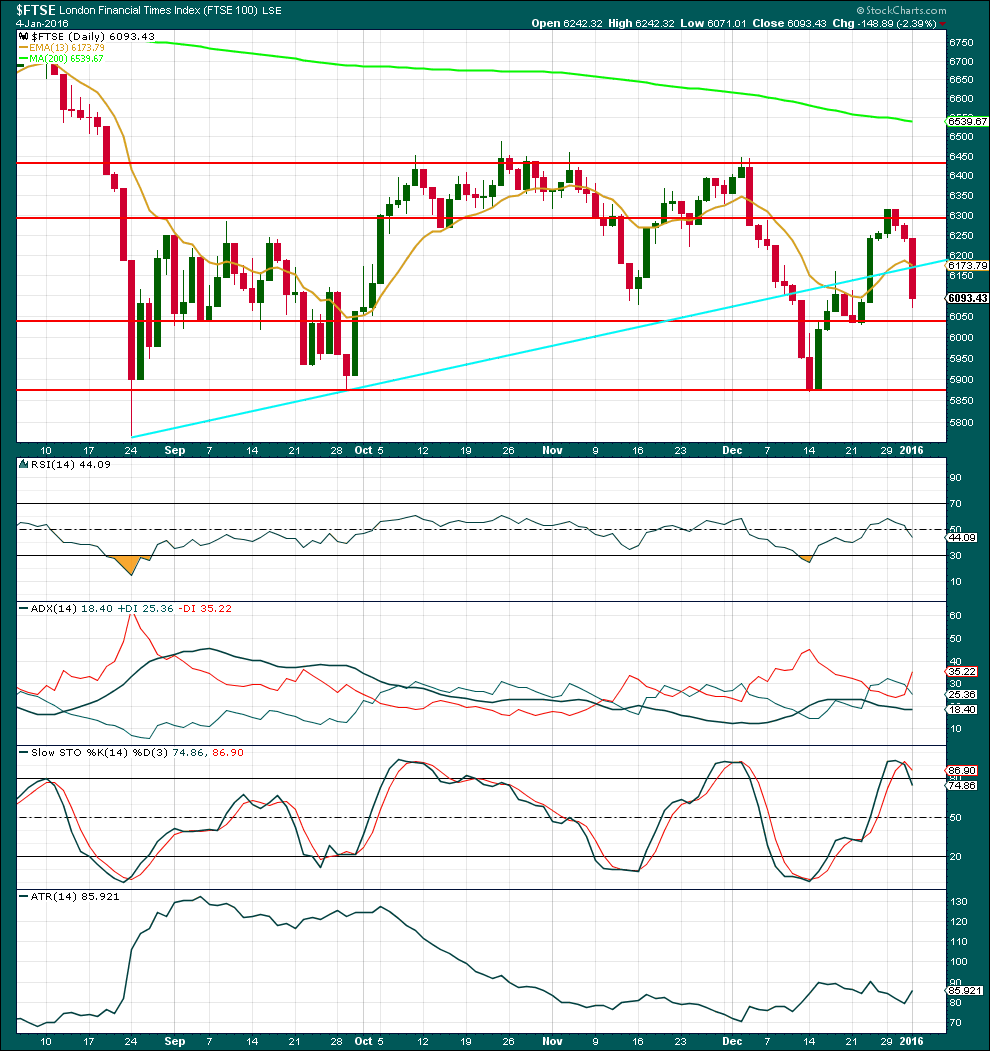
Click chart to enlarge. Chart courtesy of StockCharts.com.
There is no volume data on either the FXCM feed or StockCharts. Volume analysis is done from Yahoo Finance data.
Overall volume was low and light as price rose to the last high of 29th December. Today, a strong downwards day shows a strong increase in volume. The fall in price is supported by volume.
Price has closed below the sloping cyan trend line. This may now provide some resistance to upwards corrections along the way down.
If price can close below the support line about 6,030, then the next line of support is about 5,870.
ADX is flat to declining and is not indicating there is a trend yet. ATR is beginning to increase which may be the start of a new trend.
RSI is again neutral allowing room for the market to fall.
Stochastics is returning from overbought.
Price should be expected to fall until it finds support, and to bounce about there.
This analysis is published about 03:01 p.m. EST.


Lara – Happy New Year! Do you have a timescale estimate to complete the middle of wave 3 on FTSE? Thanks
Minute waves i and ii both lasted a Fibonacci 8 days. So minuette wave iii is expected to be extended in price, which means it would also be extended in time.
At this early stage I’d look for it to total a Fibonacci 13 days. That means another 10 trading sessions before it may come to an end.
If in 10 more sessions it’s not done then the next expectation would be a Fibonacci 21 days total. A further 8 sessions.
And this is a rough guide ONLY. FTSE does not often exhibit Fibonacci durations, just sometimes. That makes time estimations closer to a guess than a target.
Closer to the end when the structure starts to look close to completion I’ll have a clearer idea. For now I’m just hanging in there, expecting price should drop.