
There are three possibilities for downwards movement from the last major swing high of 3rd November.
I have three daily charts looking at three possibilities.
Summary: A downwards trend is still in place. The preferred bear wave count expects a big third wave is in the early stages. The final invalidation point is at 2,116.48. The target for this third wave is at 1,428.
To see how each of the bull and bear wave counts fit within a larger time frame see the Grand Supercycle Analysis.
To see detail of the bull market from 2009 to the all time high on weekly charts, click here.
Last published monthly charts can be seen here.
If I was asked to pick a winner (which I am reluctant to do) I would say the bear wave count has a higher probability. It is better supported by regular technical analysis at the monthly chart level, it fits the Grand Supercycle analysis better, and it has overall the “right look”.
New updates to this analysis are in bold.
BULL ELLIOTT WAVE COUNT
DAILY CHART – COMBINATION OR FLAT
Click chart to enlarge.
This wave count is bullish at Super Cycle degree.
Cycle wave IV may not move into cycle wave I price territory below 1,370.58. If this bull wave count is invalidated by downwards movement, then the bear wave count shall be fully confirmed.
Cycle wave II was a shallow 0.41 zigzag lasting three months. Cycle wave IV should exhibit alternation in structure and maybe also alternation in depth. Cycle wave IV may be a flat, combination or triangle. The two daily charts look at these three possibilities.
Cycle wave IV may end within the price range of the fourth wave of one lesser degree. Because of the good Fibonacci ratio for primary wave 3 and the perfect subdivisions within it, I am confident that primary wave 4 has its range from 1,730 to 1,647.
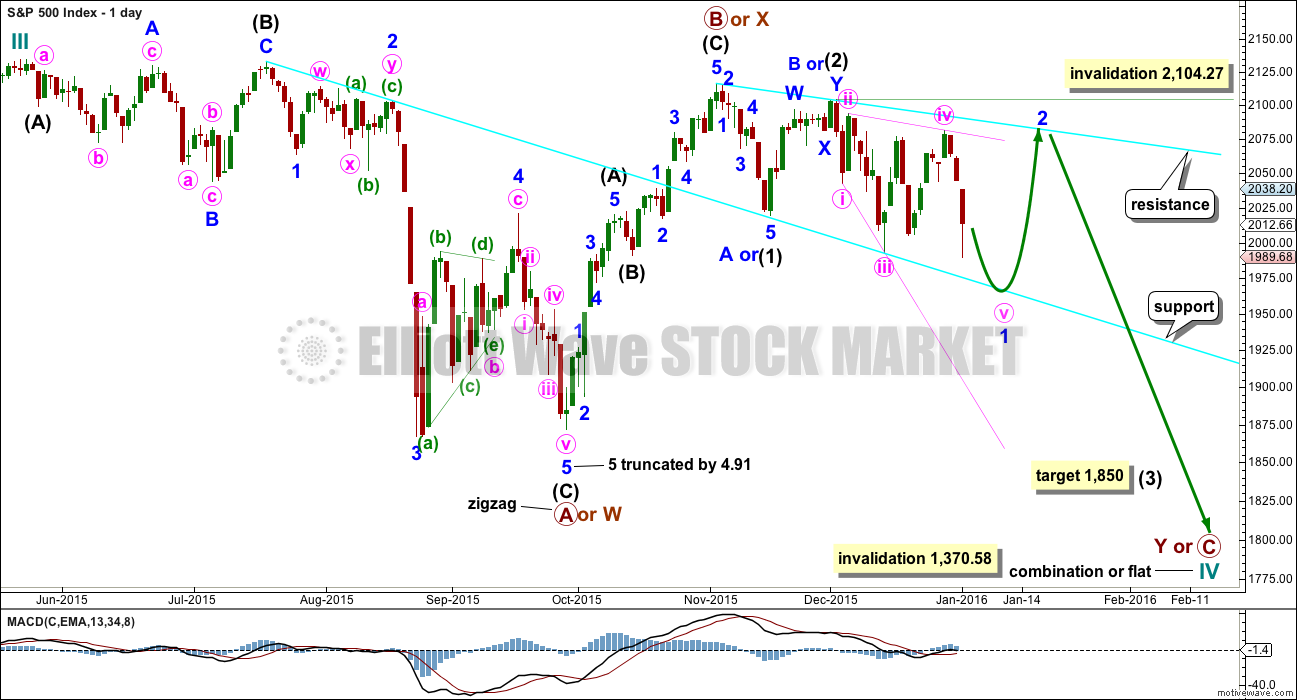
If a zigzag is complete at the last major low as labelled, then cycle wave IV may be unfolding as a flat, combination or triangle.
Primary wave C should subdivide as a five and primary wave Y should begin with a zigzag downwards. This downwards movement is either intermediate waves (1)-(2)-(3) of an impulse for primary wave C or minor waves A-B-C of a zigzag for intermediate wave (A). Both these ideas need to see a five down complete towards the target, so at this stage there is no divergence in expectations regarding targets or direction.
Primary wave A or W lasted three months. Primary wave C or Y may be expected to also last about three months.
Within the new downwards wave of primary wave C or Y, a first and second wave, or A and B wave, is now complete. Intermediate wave (2) or minor wave B lasted a Fibonacci 13 days exactly. At 1,850 intermediate wave (3) or minor wave C would reach 2.618 the length of intermediate wave (1). At this stage, this will be the sole target for this third (or C) wave to end as it fits better with more short term targets calculated at the hourly chart level.
No second wave correction may move beyond its start above 2,104.27 within intermediate wave (3) or minor wave C. This invalidation point allows for the possibility that there may be a leading diagonal unfolding for a first wave down. Leading diagonals in first wave positions are often followed by very deep second wave corrections. When the structure of minor wave 1 is complete, then a deep zigzag for minor wave 2 would be expected which may find resistance at the upper cyan trend line.
DAILY CHART – TRIANGLE
Click chart to enlarge.
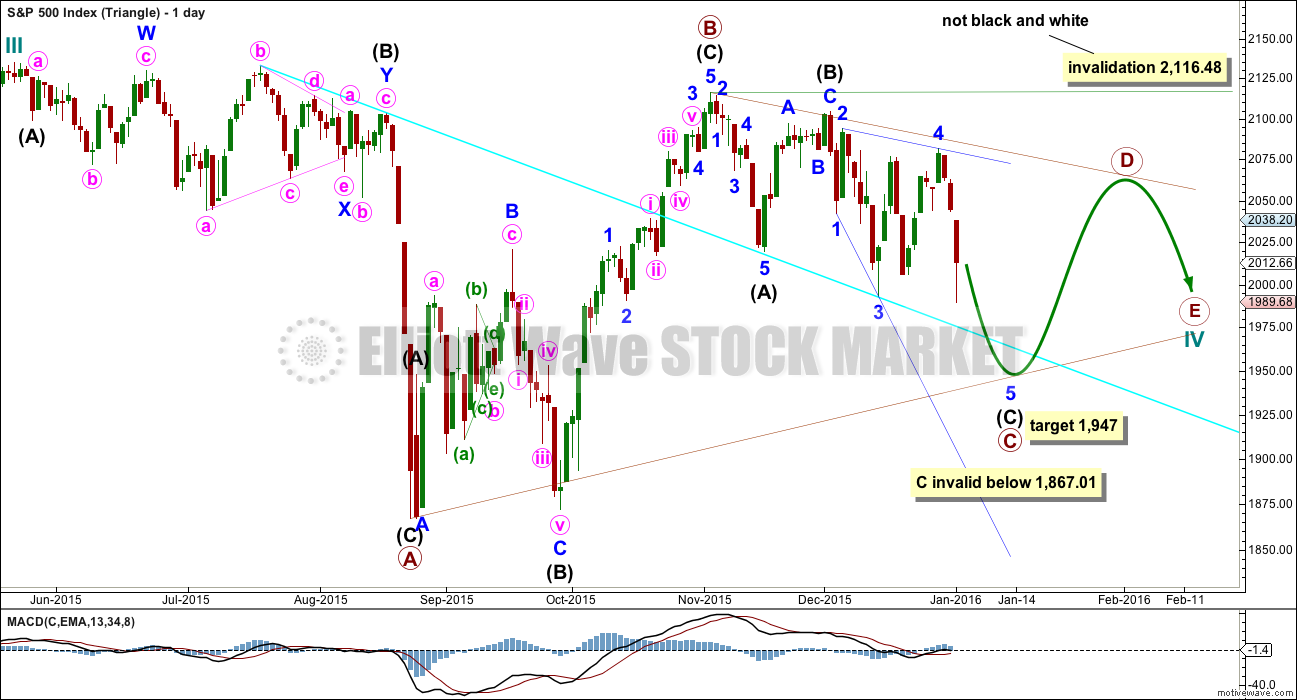
Cycle wave IV may unfold as a shallow triangle. This would provide alternation with the 0.41 zigzag of cycle wave II.
The triangle may be either a regular contracting or regular barrier triangle. An expanding triangle would also be technically possible, but as they are the rarest of all Elliott wave structures I would only chart and consider it if it shows itself to be true. Prior to that, the probability is too low for consideration.
Primary wave B would be a complete zigzag. The subdivisions all fit and now it has a clearer three wave look to it.
Primary wave C should unfold downwards as a single or double zigzag. So far it may be a single zigzag, with intermediate wave (C) unfolding as an ending expanding diagonal. At 1,947 intermediate wave (C) would reach 1.618 the length of intermediate wave (A).
Primary wave C may not move below the end of primary wave A at 1,867.01. This invalidation point is black and white for both a contracting and barrier triangle.
When primary wave C is complete, then primary wave D upwards should unfold as a single or double zigzag. For a contracting triangle, primary wave D may not move beyond the end of primary wave B above 2,116.48. For a barrier triangle, primary wave D should end about the same level as primary wave B at 2,116.48. The triangle would remain valid as long as the B-D trend line remains essentially flat. This invalidation point is not black and white. This is the only Elliot wave rule with any grey area.
Thereafter, primary wave E downwards may not move beyond the end of primary wave C.
The whole structure moves sideways in an ever decreasing range. The purpose of triangles is to take up time and move price sideways. Price exits the triangle in the same direction that it entered, in this case up. When the triangle is complete, then the bull market would be expected to resume. This triangle should take several months yet to complete.
HOURLY CHART
Click chart to enlarge.
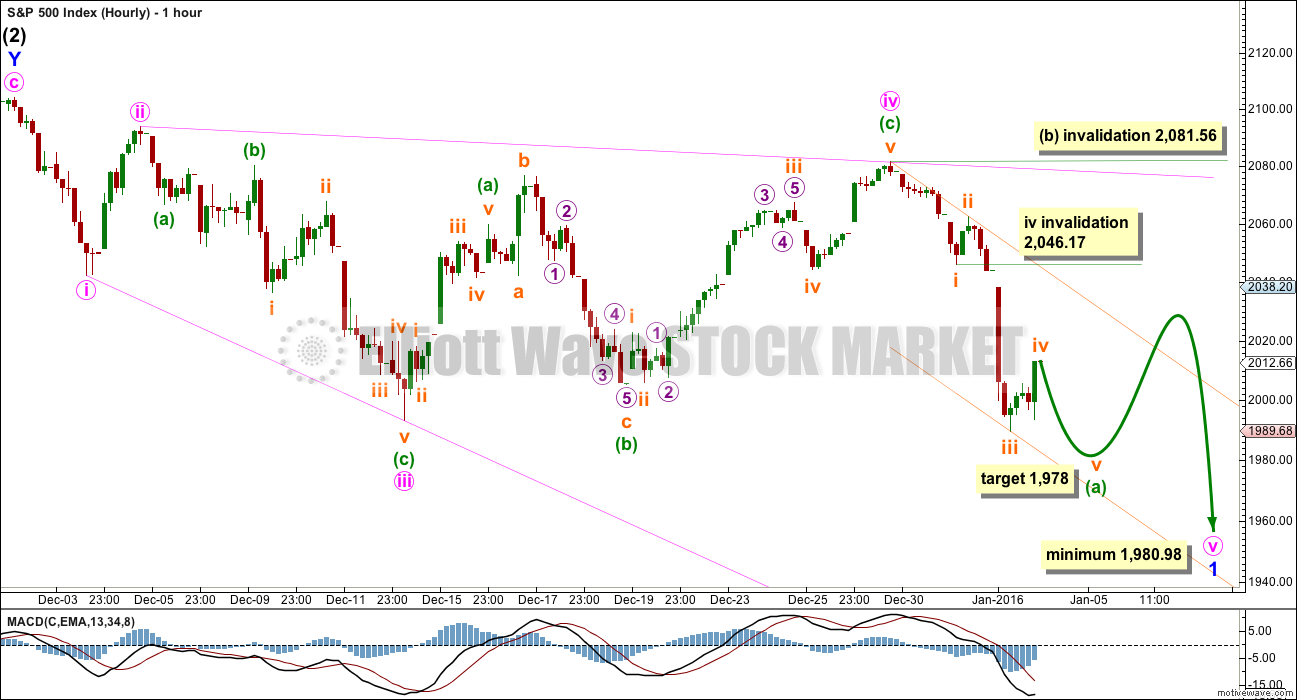
A third wave (or C wave) down is expected to be unfolding for both bull and bear wave counts. It is either beginning with a series of overlapping first and second waves, or it is beginning with a leading expanding diagonal for a first wave.
At this stage, a leading expanding diagonal looks to be the more likely structure. The alternate for the bear below will look at the other possibility of an impulse beginning with a series of overlapping first and second waves.
Within the diagonal, minute wave ii was a 0.83 correction of minute wave i and minute wave iv was a 0.88 correction of minute wave iii. Both are deeper than the normal range of 0.66 to 0.81. Second and fourth wave corrections within diagonals are normally deep; this gives the diagonal the “right look”.
Leading diagonals normally have first, third and fifth waves which subdivide as zigzags. Ending diagonals must have first, third and fifth waves as zigzags. Minute wave v is most likely to unfold as a zigzag.
The diagonal is expanding: minute wave iii is longer than minute wave i and minute wave iv is longer than minute wave ii. The trend lines diverge. Minute wave v must be longer than minute wave iii, so it must end at or below 1,980.98. It is likely to end reasonably below this point.
Minute wave iii is just 0.39 longer than 1.618 the length of minute wave i. At 1,919 minute wave v would be 1.618 the length of minute wave iii. This target is a rough guide only and may not be reliable. Diagonal actionary waves do not often exhibit Fibonacci ratios to each other.
So far, within the zigzag of minute wave v, the five wave impulse for minuette wave (a) is incomplete. When markets open tomorrow, if subminuette wave iv continues any higher, then it may not move into subminuette wave i price territory above 2,046.17.
There is no Fibonacci ratio between subminuette waves i and iii. This makes it more likely that subminuette wave v shall exhibit a Fibonacci ratio to either of subminuette waves i or iii. At 1,978 subminuette wave v would reach equality in length with subminuette wave i, the most likely Fibonacci ratio.
When minuette wave (a) is a complete five wave impulse, then some upwards movement for minuette wave (b) should unfold and should show up on the daily chart as at least one green candlestick, most likely it will last a few days. Minuette wave (b) may not move beyond the start of minuette wave (a) above 2,081.56.
The orange channel drawn here is a best fit. Downwards movement may find support at the lower edge. When the upper edge is breached, then minuette wave (a) would be confirmed as over and minuette wave (b) would be confirmed as underway.
BULLISH ALTERNATE WAVE COUNT
Click chart to enlarge.
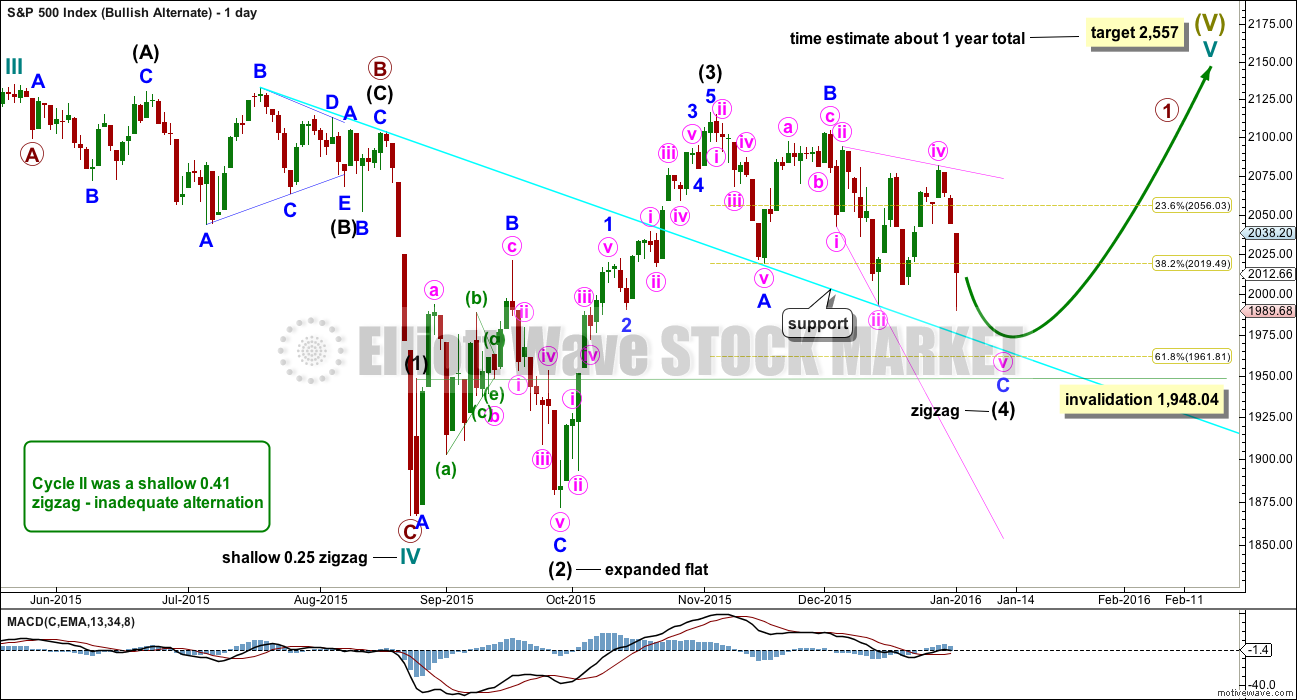
I can again see the possibility that cycle wave IV is over and upwards movement may be the start of cycle wave V.
If cycle wave IV is over, as labelled, then there is inadequate alternation between cycle waves II and IV. Cycle wave II was a shallow 0.41 zigzag. Here, cycle wave IV is a more shallow 0.25 zigzag. Both are the same structure.
If cycle wave V has begun, then primary wave 1 within it may be an incomplete impulse. At 2,557 cycle wave V would reach equality in length with cycle wave I. If it also is the same in duration as cycle wave I, then it may last a year.
Intermediate wave (2) was a deep 0.94 expanded flat within primary wave 1. Intermediate wave (4) would be an incomplete zigzag which would also be relatively deep when it is complete. Minor wave C must complete as a five wave structure downwards, and at this state it may be an incomplete ending expanding diagonal. Intermediate wave (4) may not move into intermediate wave (1) price territory below 1,948.04.
This wave count does not have any support from regular technical analysis. I do not have any confidence in it. It is presented as a “what if?” only, to consider all possibilities.
BEAR ELLIOTT WAVE COUNT
DAILY CHART
Click chart to enlarge.
This bear wave count fits better than the bull with the even larger picture, super cycle analysis found here. It is also well supported by regular technical analysis at the monthly chart level.
Importantly, there is no lower invalidation point for this wave count. That means there is no lower limit to this bear market.
The downwards movement labelled intermediate wave (1) looks like a five. If minor wave 2 is seen as a double flat with a triangle for wave X within it, then the subdivisions all fit nicely.
Ratios within intermediate wave (1) are: minor wave 3 is 7.13 points short of 6.854 the length of minor wave 1, and minor wave 5 is just 2.82 points longer than 0.618 the length of minor wave 3. These excellent Fibonacci ratios add some support to this wave count.
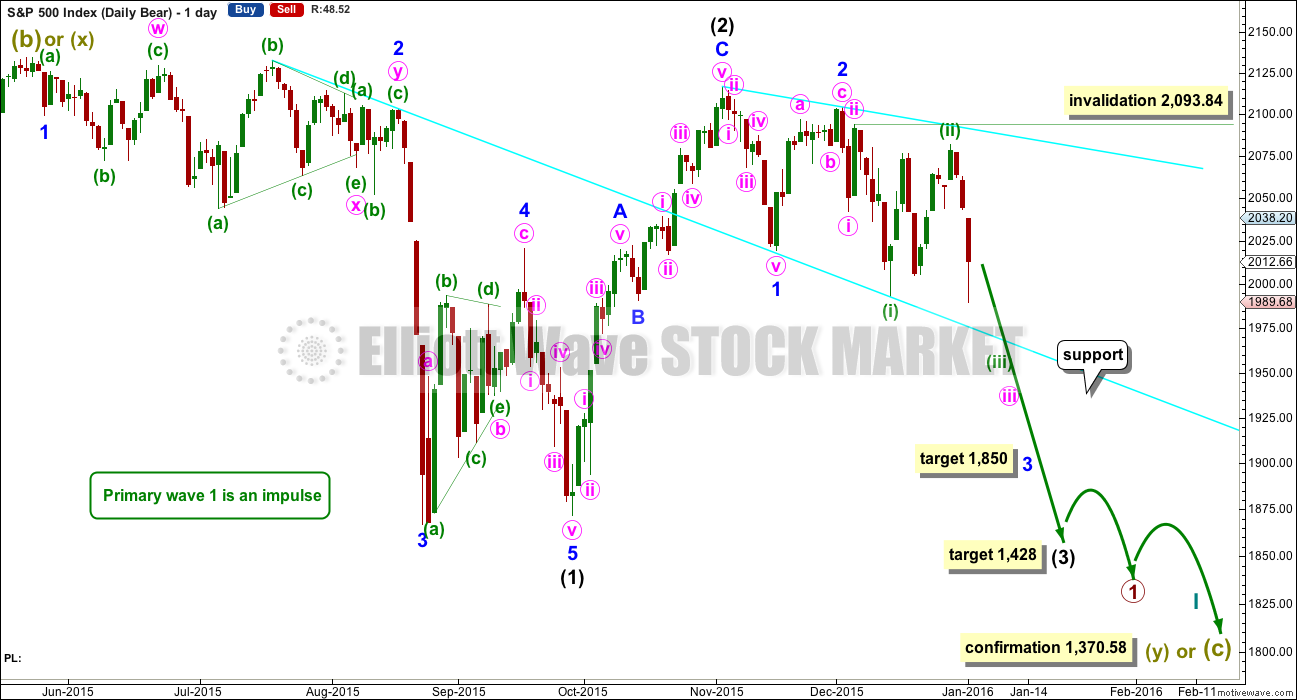
Intermediate wave (2) was a very deep 0.93 zigzag. Because intermediate wave (2) was so deep the best Fibonacci ratio to apply for the target of intermediate wave (3) is 2.618 which gives a target at 1,428. If intermediate wave (3) ends below this target, then the degree of labelling within this downwards movement may be moved up one degree; this may be primary wave 3 now unfolding and in its early stages.
Within intermediate wave (3), minor waves 1 and 2 are complete. The upwards movement for minor wave 2 does have a strong three wave look to it at the daily chart level. Minor wave 2 was another deep correction at 0.87 of minor wave 1. At 1,850 minor wave 3 would reach 2.618 the length of minor wave 1. If price falls through this first target, then the next Fibonacci ratio in the sequence is 4.236 which would be reached at 1,693. If minor wave 3 is very extended, then the degree of labelling for all downwards movement from the all time high will be moved up one degree.
It is still possible (but still less likely) that primary wave 1 is unfolding as a leading diagonal. I will keep that chart up to date and will publish it if and when it begins to diverge from the idea presented here. For now I want to keep the number of charts published more manageable.
A line from the ends of intermediate wave (2) to minor wave 2 is drawn. This line may show where any further upwards movement finds resistance.
For the bear wave count today, I have two ideas for downwards movement from the end of intermediate wave (2): either a series of overlapping first and second waves or a leading expanding diagonal. This first chart looks at a series of overlapping first and second waves. The only problem with this idea is the brevity of minute wave ii when compared to minuette wave (ii) one degree lower which lasted ten times the duration.
The idea presented with the bull wave count also works in the same way for the bear wave count: a leading expanding diagonal may have begun at the high labelled minute wave ii.
HOURLY CHART
Click chart to enlarge.
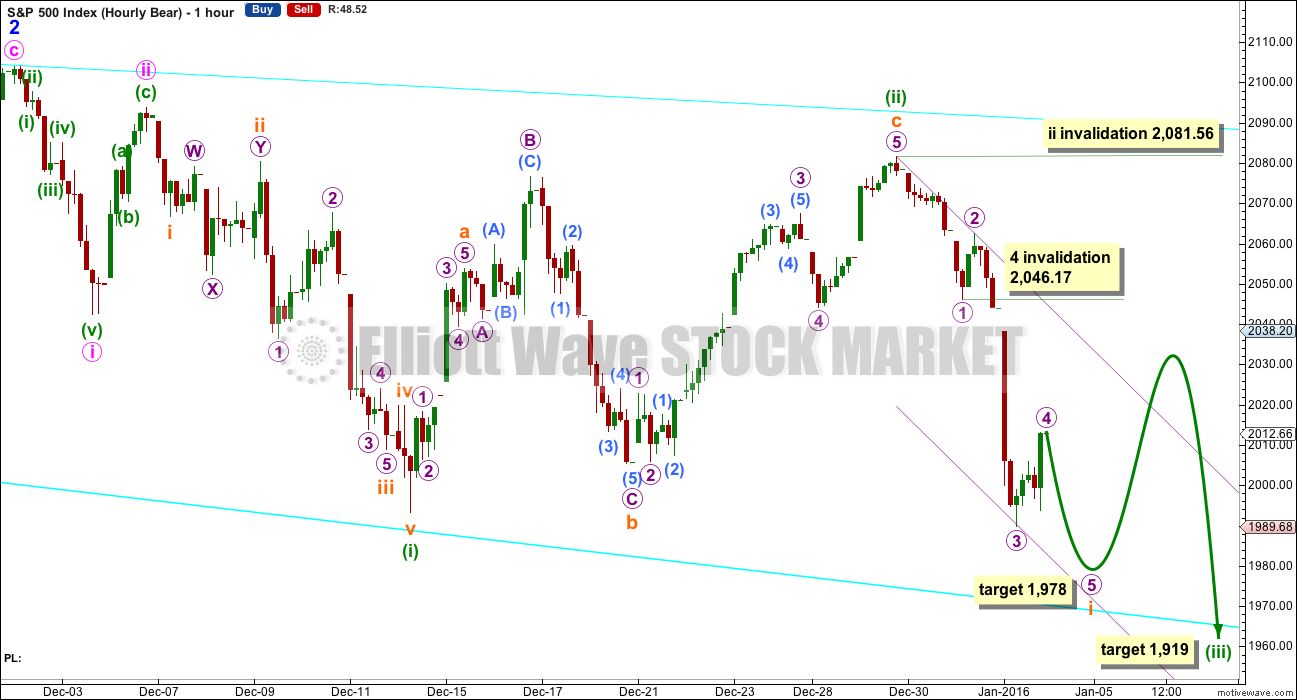
In the short term, the structure downwards is the same for all ideas, an incomplete impulse. The target is the same. The short term invalidation point is the same.
If this is another first wave down, then when it is complete it should be followed by another second wave correction up. Subminuette wave ii may not move beyond the start of subminuette wave i at 2,081.56.
The target for minuette wave (iii) is where it would reach 1.618 the length of minuette wave (i) at 1,919. If this target is wrong, it may not be low enough. The next Fibonacci ratio in the sequence of 2.618 gives a target at 1,818.
Along the way down, I would expect to see price find some support and bounce up from the lower cyan trend line which is copied over here from the daily chart. This may be about where the impulse of subminuette wave i ends.
Subminuette wave ii may be deep, but it is less likely. There should now be enough of a strong downwards pull from a big third wave to force corrections to be more brief and shallow than normal. Any more very deep and time consuming corrections would reduce the probability of the idea of a series of overlapping first and second waves in favour of the idea of a diagonal.
ALTERNATE DAILY CHART
Click chart to enlarge.
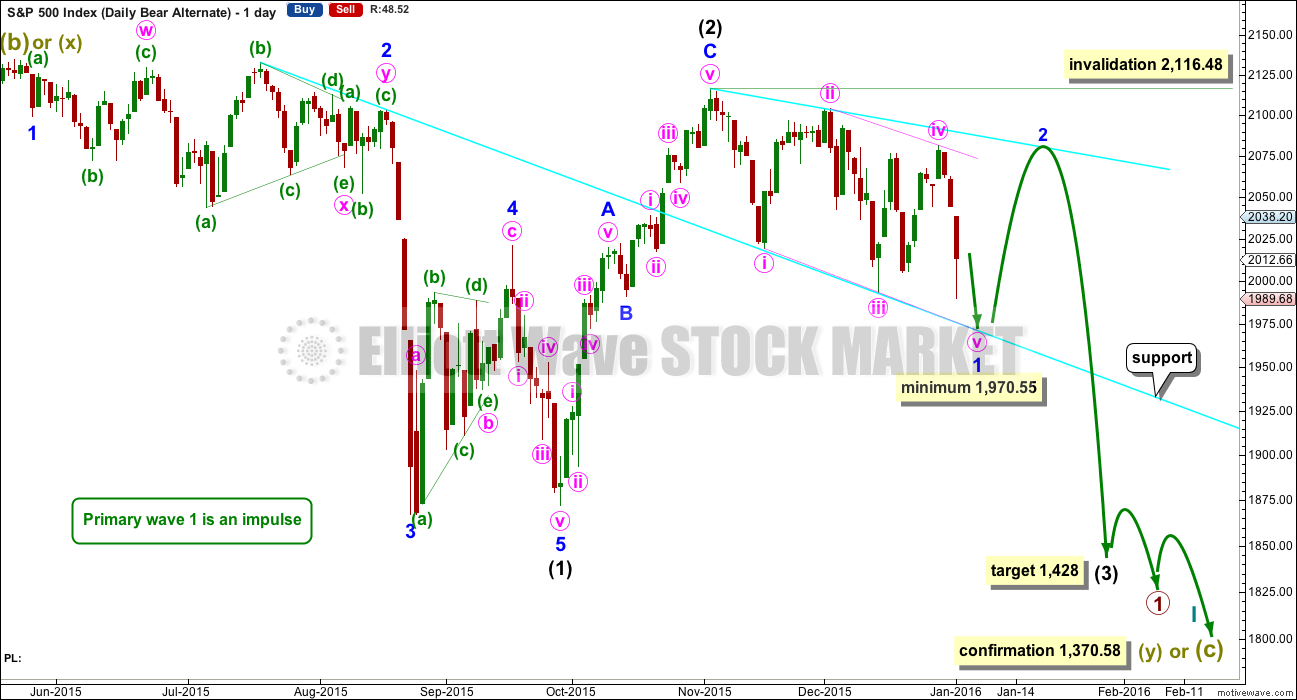
This bear wave count is identical to the first bear daily chart right up to the high labelled intermediate wave (2).
Thereafter, it looks at the possibility that a first wave leading diagonal may be unfolding.
The diagonal would be expanding and may have begun earlier than the chart for the bull daily wave count. Minute wave iii is longer than minute wave i, and minute wave iv is longer than minute wave ii. The trend lines diverge, just.
Minute wave v must be longer than minute wave iii, so it must end below 1,970.55.
Leading diagonals in first wave positions are often followed by very deep second wave corrections. When minor wave 1 may be seen as complete, then minor wave 2 should unfold over a couple of weeks and may find resistance at the upper cyan trend line. It may not move beyond the start of minor wave 1 above 2,116.48.
The target for intermediate wave (3) is also the same, only the pathway along the way down here is seen differently.
TECHNICAL ANALYSIS
DAILY CHART
Click chart to enlarge. Chart courtesy of StockCharts.com.
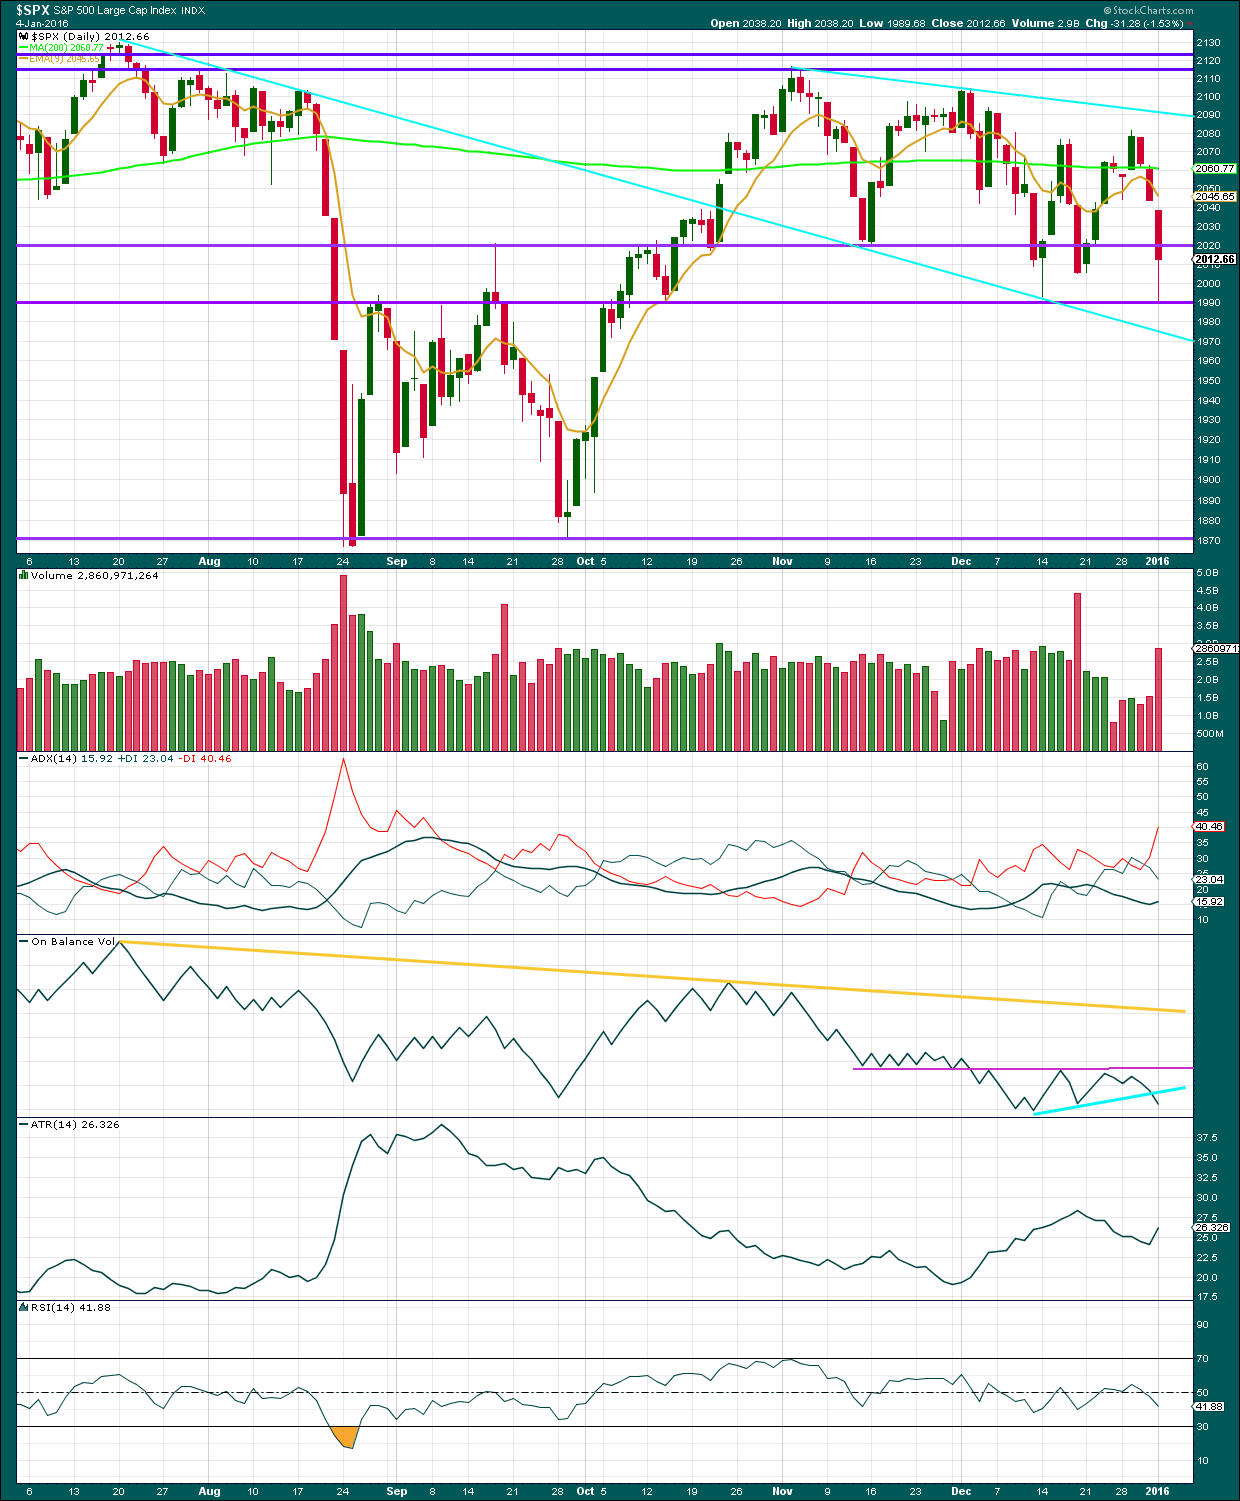
The volume profile continues to be very bearish. For three days in a row price has fallen on rising volume, with strong volume for Monday. The fall in price is well supported by volume. Prior to this three day fall, the rise in price came on declining volume. The rise in price is not supported by volume and consistently remains suspicious.
Price found strong support about the lower purple horizontal trend line about 1,990. The next line of support is the sloping lower cyan trend line.
The gap at the opening of Monday’s session looks like a breakaway gap and is unlikely to be closed.
ADX is again indicating a downwards trend is in place. ATR agrees as it is increasing.
On Balance Volume continues to be bearish.
RSI is still relatively close to neutral. There is plenty of room for this market to fall.
To the upside, resistance may be provided for upwards corrections by the 9 day EMA. In the first instance though, I would expect some resistance may be provided about 1,990 now that price has closed below this point.
There are bearish engulfing candlestick patterns at two of the last swing highs: at the high of 3rd November, 2015, and the next high at 2nd December, 2015.
DOW THEORY
For the bear wave count I am waiting for Dow Theory to confirm a market crash. I am choosing to use the S&P500, Dow Industrials, Dow Transportation, Nasdaq and I’ll add the Russell 2000 index. Major swing lows are noted below. So far the Industrials, Transportation and Russell 2000 have made new major swing lows. None of these indices have made new highs.
At this stage, if the S&P500 and Nasdaq also make new major swing lows, then Dow Theory would confirm a major new bear market. At that stage, my only wave count would be the bear wave count.
S&P500: 1,821.61
Nasdaq: 4,117.84
DJT: 7,700.49 – this price point was breached.
DJIA: 15,855.12 – this price point was breached.
Russell 2000: 1,343.51 – this price point was breached.
This analysis is published about 08:58 p.m. EST.
hi
all
This article is so interesting online:
http://www.zerohedge.com/news/2016-01-05/still-safe-sidelines-501-days-and-counting
All
A BEAR FLAG ANYONE ?
SOMETHING HAS TO MAKE SENSE ?
Nice flag-pole! 🙂
you can push the TA RULES IN THESE MARKETS 🙂
With the session closing on a green candlestick I’m going to change my very short term expectation.
I don’t think todays upwards move was a small fourth wave, I think it is either a B or 2 wave. Which is incomplete.
I have a short term trend line which may show resistance, and a short term line providing support which may indicate when this correction is over.
The risk here is if this upwards move is a B wave it could move quite a bit higher and last quite a lot longer. B waves are the WORST of all. They take time, are horrible to analyse, too complicated, and awful to trade.
The trend is still down, and when its done the next wave should be a good one. The invalidation point is the same short term 2,081.56.
hi
Lara,
I still don’t understand how such a simple topping pattern can’t even break down a small 13% correction from here? For instance – we spent 1 full year making a top. We have the MONTHLY MACD SELL SIGNAL SINCE FEB 2015. We spent 2 months and only came down -5.6% recently.
Are we looking at another year to grind sideways or HIGHs yet again? I don’t see how 1,428 can even be achieved at all to be honest now given all the price action sideway problems and constant wave changes.
It doesn’t add up for me, the whole world markets are unstable and commodities(OIL in particular) is getting crushed now.
If we dont break down to 1850 by month end. I am afraid I have to fully just watch this market as a viewer only.
Sorry —
scratch this thought …
FUTURES DOWN HUGE 🙂
When third waves begin with some overlapping, and deep second wave corrections, they convince us they won’t turn up. Right before they take off.
That seems to be psychology of second wave corrections. They convince many that the prior trend is back, right before price moves strongly in the opposite direction.
When everyone is bullish and convinced that the bull market is back and new all time highs are just about to happen… that’s when this third wave will move strongly lower.
Verne,
4 times we hit 2,000 level and can’t break it. WHAT WILL IT TAKE ? 20 more times LOL?
Those round numbers in DJI and SPX are of massive technical and psychological significance IMHO. Ever since they surpassed those levels last July, and then surrendered them in August, a colossal battle of wills has been raging between the central banksters and not just the bears, but also between central banks and the deflationary winds that are blowing globally. They are clearly burning a phenomenal amount of money defending those pivots and what they are doing is truly scary. By repeatedly arresting the natural market cycles they can certainly delay the ultimate outcome but then the amplitude of said outcome simply skyrockets. What is happening in the markets is disconcerting and I am quite concerned about how they are going to react when it becomes clear they have lost control. I don’t know how long they can keep this up…I just know it is going to end badly. The key catalyst will be the bond market I think. Obviously, the bearish wave count, as well as a plethora of other data are also suggesting that the end is near. I have been going out six months with my short positions….just in case. I do not think it is safe to FULLY short this market, certainly not in the near term, unless, and until those pivots fall and do so decisively. Once they do, watch what happens…
K good points
I knew about the bond market
I wanted to be a bond trader
But picked US indicies instead
I have one last idea this folds this month to 1750-1780
If we get a repeat of what happened with sub-minuette five down, maybe we get a monster intermediate third down, a few weeks of choppy intermediate four, and an even more monster intermediate five down to 1370.00 by March…
oh nice
miller time!
At that time the FED, with very RED faces will take back their rate hike and announce Q.E. infinity. We get a spectacular retrace of the decline for a primary wave two back to near all-time highs, and the shorting opportunity of a lifetime!!!!! 🙂
*yawn*
Hi
Verne,
In 2 months we are down only -5.4%…
Price action isn’t bullish but it is still holding up sideways………
-china crashing
-dollar going up
-transports at the lows
ANOTHER 4 MONTHS FOR -10% 🙂 ?
Looks like end-of-day-flush starting. I am wondering if it will meet downside target today, especially if fifth wave is extended. Downside momentum at the close might give a clue…
Someone doesn’t want this to close in the red – IMHO until we get down below 2008.63, this could go a bit higher
Yep. It terms of time duration what would be sub-min three started last Thursday and ended yesterday so if sub-min four ends early tomorrow it would be similar…these round number pivots appear to be quite important…
This small sideways drift is either subminuette iv continuing (still entirely possible, it’s well below wave 1 price territory) or the start of a fifth wave with a 1-2 so far.
If its the start of a fifth wave then with a second wave correction showing up so large (relatively, on the hourly chart) within it that indicates an extended fifth wave.
When waves extend they show their subdivisions more clearly than non-extended waves. Their subdivisions are larger in duration.
I actually would favour the continuation of the fourth wave idea rather than the extended fifth wave idea.
But remember, the diagonal ideas all require more downwards movement. But the fifth wave for the diagonals should be a zigzag. And within that zigzag the B wave has yet to turn up. When it does it should show itself on the daily chart as at least one green candlestick, probably more.
When its done then the C wave down has to complete the zigzag.
And when the diagonal is complete then a VERY deep second wave correction.
Choppy. Horrible to analyse, horrible to trade.
I’ve been having a go at trading this market in the last few weeks now I have a new broker I’m comfortable with. I’m trading CFD’s on the cash index. I still don’t like the volatility and so I’m only taking very small positions while I get used to this market in terms of trading. I’m aiming to be comfortable enough with it to set a larger short when the next big downwards move is ready to go. I just don’t want to sit by and not take advantage of that opportunity!
Just so members know, I do now trade this market.
Thanks for the update Lara – good to know you are now actively trading.
Best of luck & welcome to the nut house !! 🙂
Hi Olga:
I was wondering why you had dismissed the fourth wave as a possibility…
Verne: I assume you mean my comment “We’e gone under 2005.84 so this can’t be a 4th wave. Awaiting us dropping out of the base channel from todays high”?
Apologies – I meant it couldn’t be a 4th wave within the the move up from 1989 as the top of the first wave would be at 2005.84 and we crossed under it (so elliminating a possible impulse up from 1989 low)
This is the problem with all this ‘fractional’ business!! I’ll try to be a bit more specific about degree in future!
FYI – my comments are almost always based on a 1 or 5 minute chart of the currently unfolding wave.
Read my above comment back – and I’m still not sure I’ve explained myself very well! 🙂
Bears are rejecting CB defense of round number pivots. Will probably break to downside to complete fifth wave followed immediately by furious re-tracement.
The market is going to really get hammered at the top of the next corrective wave up.
This is making me dizzy – how many 1,2s? We have got to see a blast to the downside fairly soon!!
We’e gone under 2005.84 so this can’t be a 4th wave. Awaiting us dropping out of the base channel from todays high
Isn’t it maddening? I think the fifth down is going to be shallow and sneaky. I would not be surprised to see another truncation. I am only using credit spreads for the time being until the big one arrives… 🙂
Yeah – I’ll be lightening my position considerably during the next drop – if we ever see it that is
I agree. That is why Lara said if this 1-2, 1-2, 1-2 does not materialize very soon and powerfully as a 3rd wave should, then she will discard the count. That would leave us with the two leading diagonal counts. But both call for more downside.
Agreed. I meant the 1,2s in todays action, but at larger degree it is just as crazy. I mainly concentrate on daily waves with an eye on the larger degree counts for context (and likely market trend).
I find it very useful to know likely direction of trend, particularly if I get caught underwater on the wrong side of a short term trade.
I can’t wait for the day I can just buy and hold a position for more than a few days (or hours!!).
How true! Profits in this market environment quickly evaporate unless you are very nimble; it can really be exhausting monitoring the market’s every twist and turn. Hopefully the day is soon coming when you can set it and forget it…!
From what I have read, the leading diagonal comports well with the psychology of this long-in-the-tooth bear market rally (according to some). These diagonals supposedly herald the onset of a new trend that is facing persistent resistance, in this case bullish resistance (read central bank) to a new bear trend. I have no doubt the completion of the diagonal will usher in a happy-days-are-here-again era, short-lived though it may be. I am really looking forward to the next pop up, hopefully with a new 52 week low in UVXY to get comfortably loaded for bear, so to speak… 🙂
Interesting
I was once told to NEVER enter my stops in the market for that exact reason, and to keep a “mental stop” instead. Their are even websites that will keep track of your stops for you. ETFs for the above cited reasons also tend to over-shoot the underlying equity and so avoiding use of stops on the etf, and using contingency orders on the underlying equity itself is one way to mitigate this problem. It also applies to options; i.e never base the stop loss on the bid/ask of the option but on a pre-determined movement in the underlying equity. I know they are supposed to be mathematically related but after getting robbed by market makers a few times you learn how bogus that notion is. Market orders in every case is a big “NO NO”. ALWAYS use limit orders to execute trades, even if it means a delay in getting filled. These markets are massively rigged against the retail investor. No question about it.
I also only set mental stops. Though you have to be really disciplined!!
That said, I expect the market makers employ pretty good Ellioticians so they probably also know exactly where EW’ers have their mental stops….
It’s most certainly rigged but you can make money with a little patience. The trick is not to allow the market to take your profits back off you (usually caused (in my case) by listening to emotion rather than price pattern). Easier said than done.
Indeed! 🙂 Isn’t amazing how frequently the market JUST exceeds a lot of those stops only to reverse as soon as they are taken out….hmmmnnn…!! I had never thought of the market makers employing Elliotticians but it sure makes a lot of sense since they seem so good at running those stops. 🙂
I am looking for a flush to end the day with the real reversal starting overnight. Taking the rest of profits on the short side at day’s end regardless…
After Lara’s update I concluded yesterday’s hammer was only an artifact… 🙂
Again Got close to Dow 17000 and money was thrown at it
Happy New Year to all. May it be a fruitful, healthy and full of lots of love & laughter
This has been the pattern. What is needed is an “exogenous shock” to break this critical pivot. The Chinese melt-down took a stab at it but the response has been co-ordinated central bank buying. The Chinese have extended their prohibition of any selling on the part of their institutional holders. The longer this continues, the more destructive of capital the eventual break to the downside will be. I suspected the banksters would not go quietly into the night…they will eventually go, albeit noisily though, make no mistake about that…!
Lara–best wishes 2016 brings many blessings to you and your family and alway take time to feel the wave, feel The Force.
LOL
Thank you.
Thank you so much Lara!
You’re welcome
Welcome back! Thanks for the thorough update.
Thanks Ben. I am refreshed. I surfed every day the first part of the holiday, as much as humanly possible. Then the waves went away so I rested 🙂
Now back to making money!