
I have only bear Elliott wave counts for FTSE.
Summary: FTSE may have today begun the middle of a third wave down. Both wave counts have a target for this downwards fall to end at 5,787.
To see monthly and weekly charts and the bigger picture see last analysis here.
New updates to this analysis are in bold.
FIRST WAVE COUNT
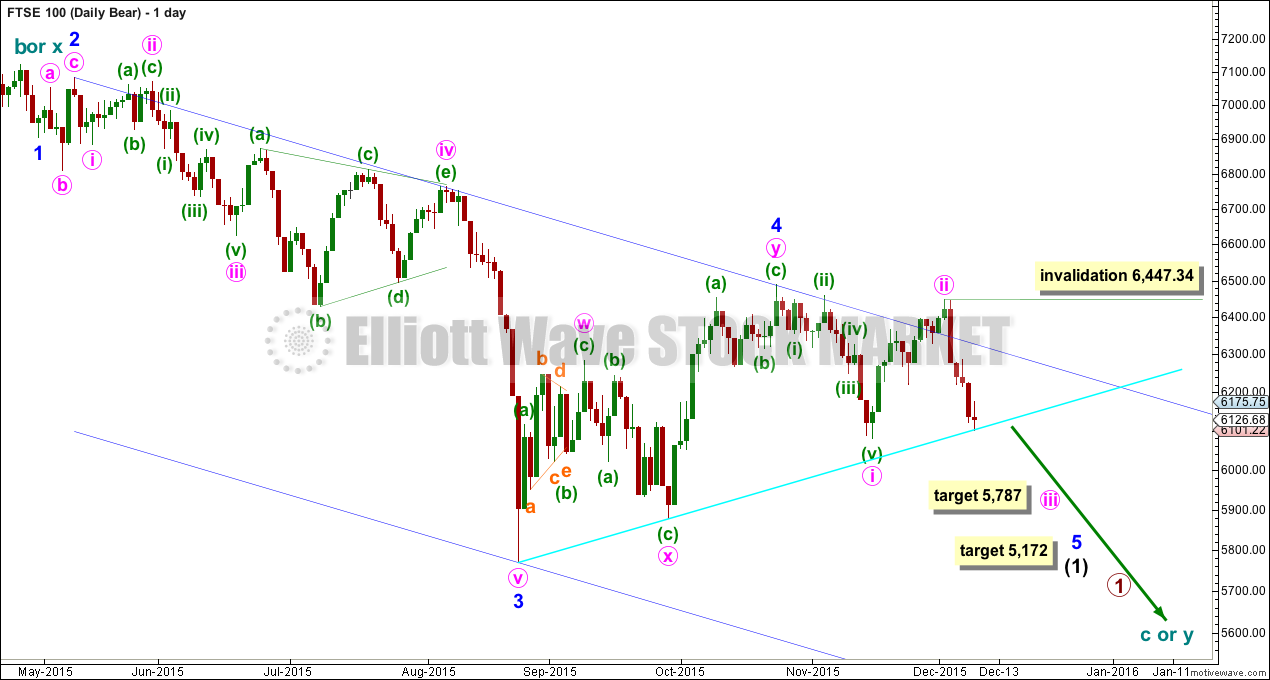
Click chart to enlarge.
So far downwards movement may be 1-2-3-4 with a fifth wave needed.
If the next wave down shows a decrease in momentum beyond that seen for minor wave 3, then this first wave count would be preferred. At 5,172 minor wave 5 would reach equality in length with minor wave 3.
The Elliott channel is not working perfectly, but it may still show where price may find some resistance along the way down.
Minute wave ii may not move beyond the start of minute wave i above 6,487.89 within minor wave 5.
At 5,787 minute wave iii would reach 1.618 the length of minute wave i.
Price is finding support as expected at the lower cyan trend line. A small bounce up may be seen from here. If price breaks below this line, expect downwards momentum to increase. Look for upwards corrections to find resistance at the upper black trend line.
SECOND WAVE COUNT
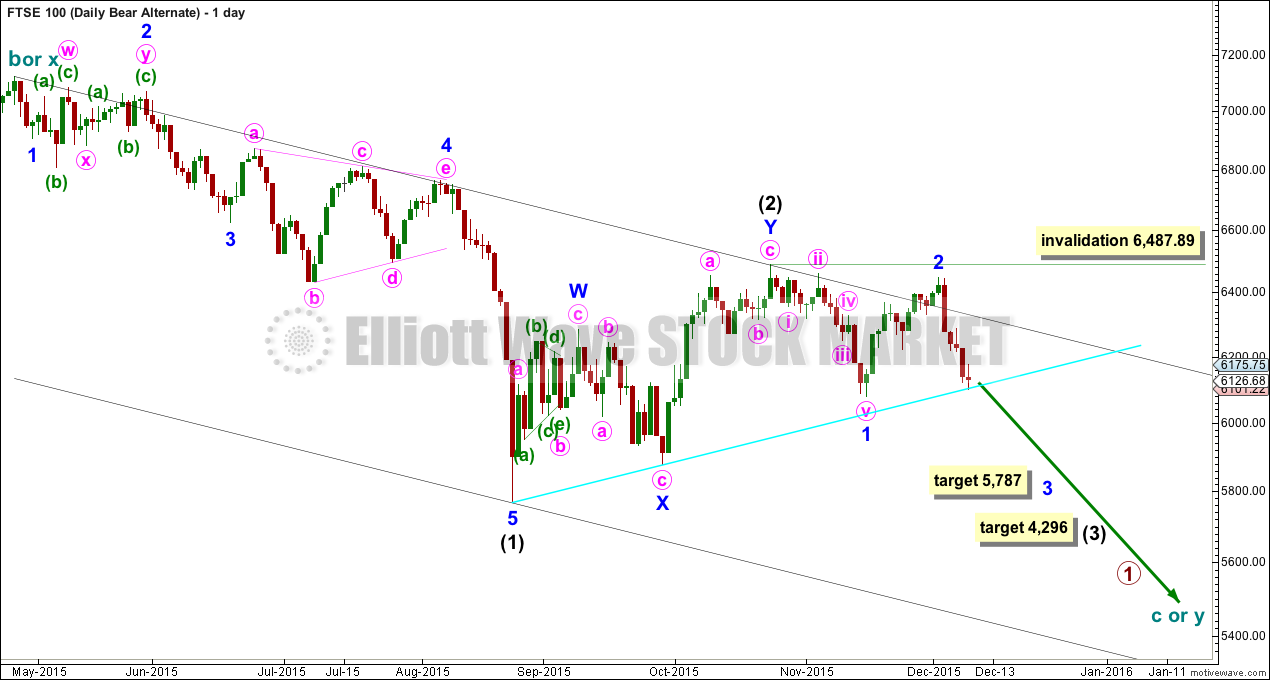
Click chart to enlarge.
The next wave down for FTSE may be a strong third wave.
If the next wave down shows an increase in momentum, then this would be the preferred wave count for FTSE.
At 4,296 intermediate wave (3) would reach 1.618 the length of intermediate wave (1).
Minor wave 2 may not move beyond the start of minor wave 1 above 6,487.89 within intermediate wave (3). This channel is a base channel about intermediate waves (1) and (2). Along the way down, upwards corrections should find resistance at the upper edge of that channel. The channel is not working perfectly but may continue to show were upwards movement may find some resistance.
If a third wave down is underway, then it should have the power to break below the lower edge of this base channel. If that happens, this wave count would be strongly preferred over the first wave count. A third wave would be confirmed.
The short term target is the same. At 5,787 minor wave 3 would reach 1.618 the length of minor wave 1.
TECHNICAL ANALYSIS
DAILY CHART
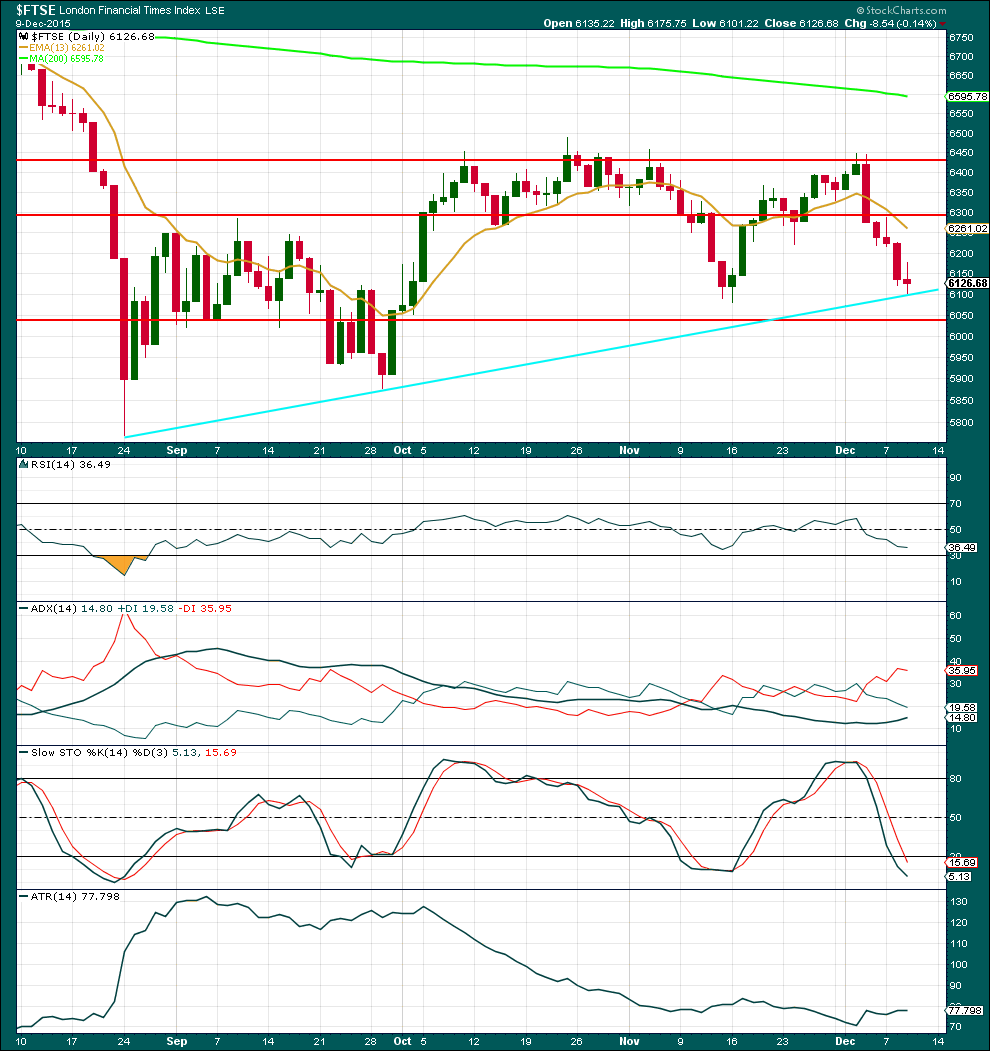
Click chart to enlarge. Chart courtesy of StockCharts.com.
There is no volume data on either the FXCM feed or StockCharts. Volume analysis is done from Yahoo Finance data.
The downwards day of 9th December showed strong volume. There is some support for this fall in price.
Price is finding support at the cyan trend line. This may initiate a small bounce. If price breaks below the cyan trend line, that would be a reasonably bearish indicator. It may then throwback to that line. When price behaves like that it offers a perfect opportunity to join a trend at a good price.
The next line of support is the next horizontal trend line.
RSI is neutral. There is plenty of room for the market to rise or fall.
ADX is rising but still below 15. If it reaches above 15, a new downwards trend would be indicated. ATR is flat to slightly increasing, not indicating a new trend yet.
If there is a new trend, then Stochastics may remain extreme for some time. Patience is advised. A new trend may be indicated in another day or two.
This analysis is published about 03:13 a.m. EST.