A new low below 2,042.35 confirmed the scenario for the hourly bull Elliott wave count.
Summary: A third wave down is most likely in the early stages. The target is 1,994. The trend is down. Use resistance lines to show were corrections against the trend may end.
To see how each of the bull and bear wave counts fit within a larger time frame see the Grand Supercycle Analysis.
To see last analysis of weekly and monthly charts click here.
If I was asked to pick a winner (which I am reluctant to do) I would say the bear wave count has a higher probability. It is better supported by regular technical analysis at the monthly chart level, it fits the Grand Supercycle analysis better, and it has overall the “right look”.
New updates to this analysis are in bold.
BULL ELLIOTT WAVE COUNT
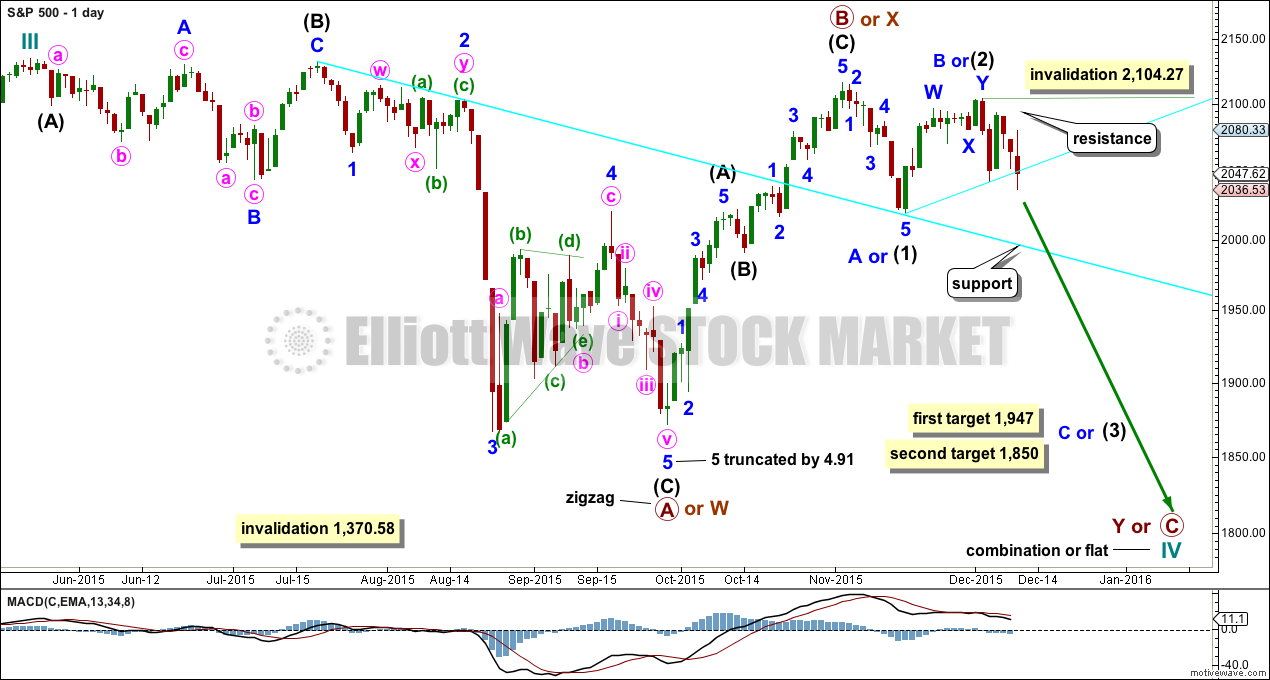
DAILY CHART – COMBINATION OR FLAT
Cycle wave IV should exhibit alternation to cycle wave II.
Cycle wave II was a shallow 0.41 zigzag lasting three months. Cycle wave IV should exhibit alternation in structure and maybe also alternation in depth. Cycle wave IV may end when price comes to touch the lower edge of the teal channel which is drawn about super cycle wave V using Elliott’s technique (see this channel on weekly and monthly charts).
Cycle wave IV may end within the price range of the fourth wave of one lesser degree. Because of the good Fibonacci ratio for primary wave 3 and the perfect subdivisions within it, I am confident that primary wave 4 has its range from 1,730 to 1,647.
If a zigzag is complete at the last major low as labelled, then cycle wave IV may be unfolding as a flat, combination or triangle.
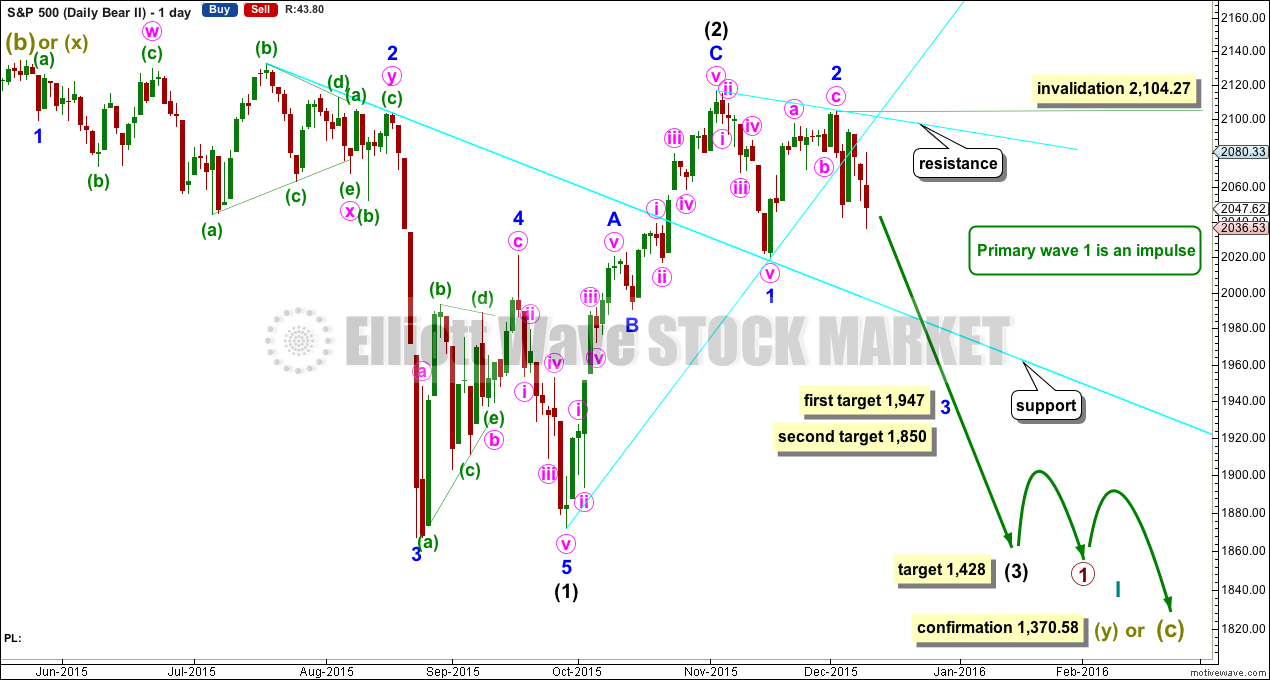
The wave count is changed today to again see primary wave B or X as a zigzag completed earlier. Primary wave C should subdivide as a five and primary wave Y should begin with a zigzag downwards. This downwards movement is either intermediate waves (1)-(2)-(3) of an impulse for primary wave C or minor waves A-B-C of a zigzag for intermediate wave (A). Both these ideas need to see a five down complete towards the target, so at this stage there is no divergence in expectations regarding targets or direction.
Primary wave A or W lasted three months. Primary wave Y or C may be expected to also last about three months.
Within the new downwards wave of primary wave C or Y, a first and second wave, or A and B wave, is now complete. Intermediate wave (2) or minor wave B lasted a Fibonacci 13 days exactly. At 1,947 intermediate wave (3) or minor wave C would reach 1.618 the length of intermediate wave (1) or minor wave A. If price falls through this first target, or gets there and the structure is incomplete, then the next target would be at 1,850 where intermediate wave (3) or minor wave C would reach 2.618 the length of intermediate wave (1).
No second wave correction may move beyond the start above 2,104.27 within intermediate wave (3) or minor wave C.
Draw a trend line from the low of intermediate wave (1) or minor wave A to the next swing low. Copy this over to the hourly chart. It may show were price finds resistance tomorrow.
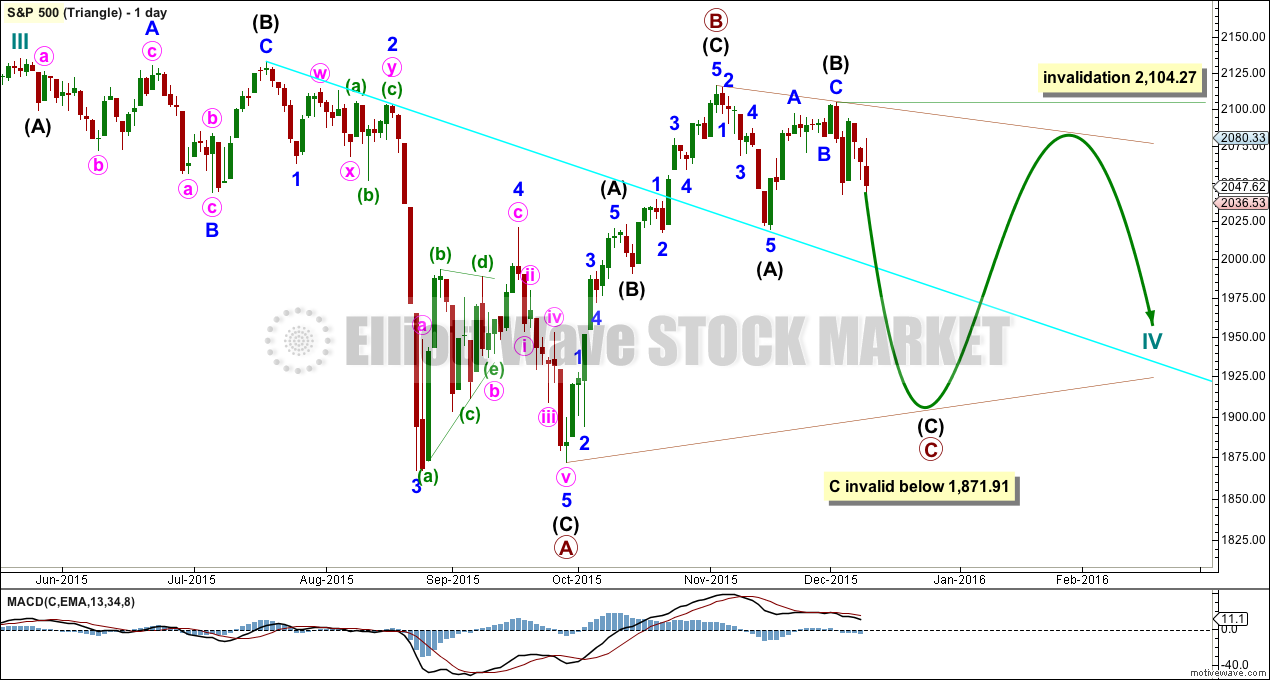
DAILY CHART – TRIANGLE
Cycle wave IV may unfold as a shallow triangle. This would provide alternation with the 0.41 zigzag of cycle wave II.
Primary wave B may be a complete zigzag. Primary wave C downwards may be underway and within it intermediate waves (A) and (B) are complete. No second wave correction may move beyond its start above 2,104.27 within intermediate wave (C).
The whole structure moves sideways in an ever decreasing range. The purpose of triangles is to take up time and move price sideways. A possible time expectation for this idea may be a total Fibonacci eight or thirteen months, with thirteen more likely. So far cycle wave IV has lasted six months.
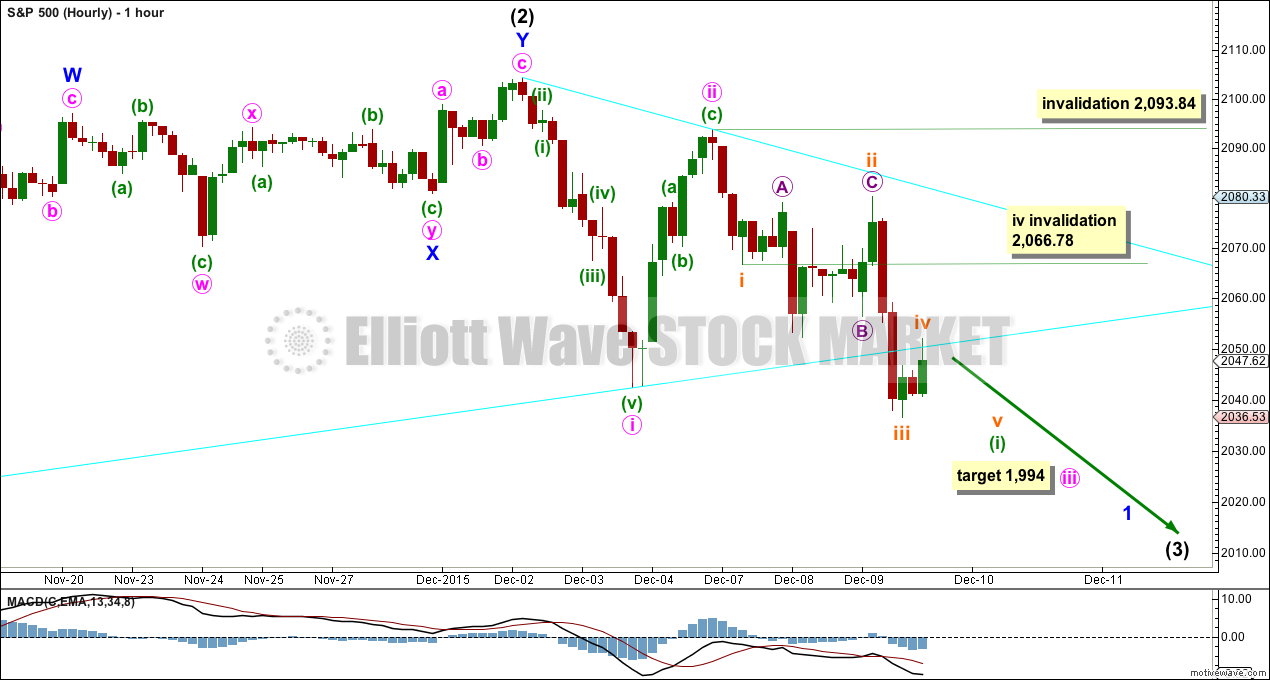
HOURLY CHART
The two hourly wave counts will look at two different ways, and both work for bull and bear (the degree of labelling for this bull is one degree higher).
The first wave of minuette wave (i) may be an incomplete impulse downwards within minute wave iii. Within minuette wave (i), subminuette wave iv may not move into subminuette wave i price territory above 2,066.78. If price remains below this point and makes a new low tomorrow, then this first scenario will remain valid. At that stage, minuette wave (i) may complete.
Within minuette wave (i), subminuette wave iii is just 0.02 short of 1.618 the length of subminuette wave i. Subminuette wave v is most likely to be equal in length with subminuette wave i, so to be 27.06 points long. A target cannot be calculated for subminuette wave v to complete at this time, because it looks most likely that subminuette wave iv is incomplete and may continue sideways when markets open tomorrow.
When minuette wave (i) downwards could be a complete impulse, then the following correction for minuette wave (ii) may not move beyond the start of minuette wave (i) above 2,093.84.
ALTERNATE BULL ELLIOTT WAVE COUNT
DAILY CHART
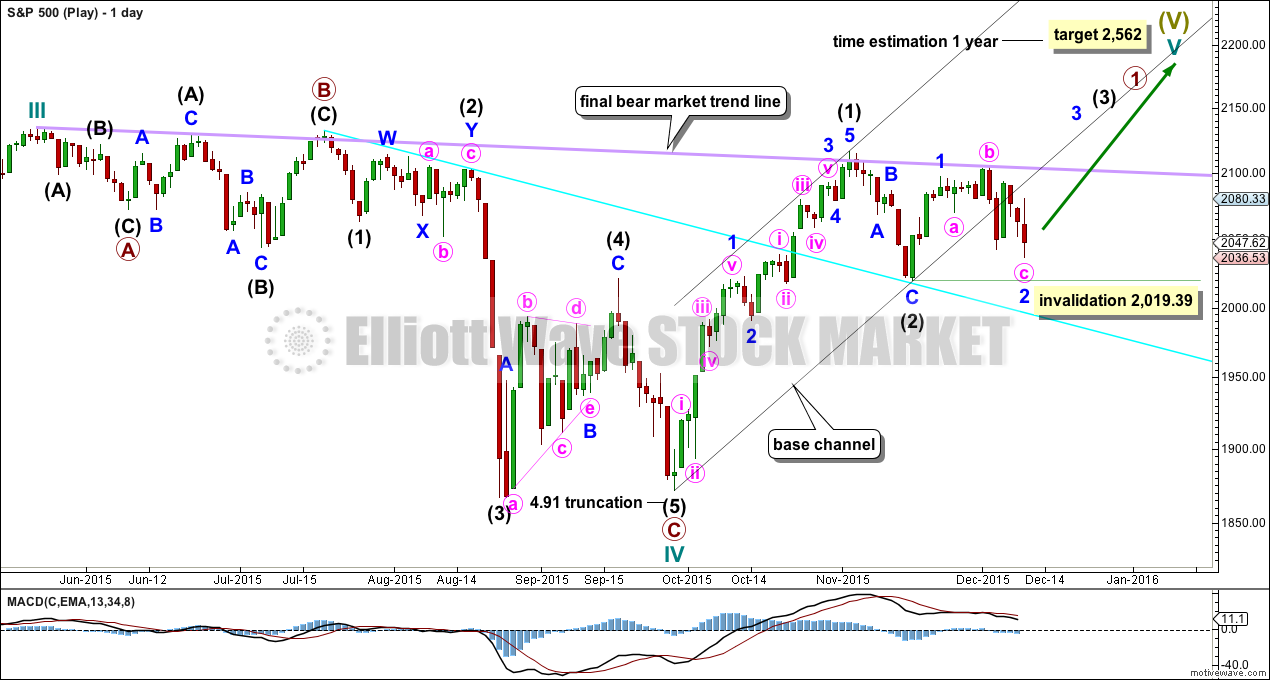
It is possible to see cycle wave IV a completed flat correction. This would provide some structural alternation with the zigzag of cycle wave II.
This is a regular flat but does not have a normal regular flat look. Primary wave C is too long in relation to primary wave A. Primary wave C would be 3.84 short of 4.236 the length of primary wave A. While it is possible to also see cycle wave IV as a complete zigzag (the subdivisions for that idea would be labelled the same as the bear wave count below, daily chart) that would not provide structural alternation with the zigzag of cycle wave II, and so I am not considering it.
This idea requires not only a new high but that the new high must come with a clear five upwards, not a three.
At 2,562 cycle wave V would reach equality in length with cycle wave I. Cycle wave I was just over one year in duration so cycle wave V should be expected to also reach equality in duration. Cycle degree waves should be expected to last about one to several years, so this expectation is reasonable. It would be extremely unlikely for this idea that cycle wave V was close to completion, because it has not lasted nearly long enough for a cycle degree wave.
I added a bear market trend line drawn using the approach outlined by Magee in “Technical Analysis of Stock Trends”. When this lilac line is clearly breached by upwards movement that shall confirm a trend change from bear to bull. The breach must be by a close of 3% or more of market value. If it comes with a clear five up, then this wave count would be further confirmed.
While price remains below the bear market trend line, we should assume the trend remains the same: downwards.
Intermediate wave (1) is a complete five wave impulse and intermediate wave (2) is a complete three wave zigzag.
For this wave count, when the next five up is complete that would be intermediate wave (3). Within intermediate wave (3), no second wave correction may move beyond the start of its first wave below 2,019.39.
This wave count does not have support from regular technical analysis and it has a big problem of structure for Elliott wave analysis. I do not have confidence in this wave count. It is presented as a “what if?” to consider all possibilities.
I have added a black base channel about intermediate waves (1) and (2). Minor wave 2, one degree lower, has breached the base channel. Price remains below it so far. This further reduces the probability of this wave count. Base channels normally provide support or resistance for lower degree corrections, but not always. When a base channel is breached the probability of the wave count reduces but is not invalidated.
Today there is a new problem with this wave count. Minute wave c within minor wave 2 now looks like a three wave structure, but it should be a five. The probability of this wave count is exceptionally low.
BEAR ELLIOTT WAVE COUNT
DAILY CHART
This bear wave count has a better fit at Grand Super Cycle degree and is better supported by regular technical analysis at the monthly chart level. But it is a huge call to make, so I present it second, after a more bullish wave count, and until all other options have been eliminated.
There are two ideas presented in this chart: a huge flat correction or a double flat / double combination. The huge flat is more likely. They more commonly have deep B waves than combinations have deep X waves (in my experience).
A huge flat correction would be labelled super cycle (a)-(b)-(c). It now expects a huge super cycle wave (c) to move substantially below the end of (a) at 666.79. C waves can behave like third waves. This idea expects a devastating bear market, and a huge crash to be much bigger than the last two bear markets on the monthly bear chart.
The second idea is a combination which would be labelled super cycle (w)-(x)-(y). The second structure for super cycle wave (y) would be a huge sideways repeat of super cycle wave (a) for a double flat, or a quicker zigzag for a double combination. It is also possible (least likely) that price could drift sideways in big movements for over 10 years for a huge triangle for super cycle wave (y).
The downwards movement labelled intermediate wave (1) looks like a five. If minor wave 2 is seen as a double zigzag with a triangle for wave X within it, then the subdivisions all fit nicely.
Ratios within intermediate wave (1) are: minor wave 3 is 7.13 points short of 6.854 the length of minor wave 1, and minor wave 5 is just 2.81 points longer than 0.618 the length of minor wave 3. These excellent Fibonacci ratios add some support to this wave count.
Intermediate wave (2) was a very deep 0.93 zigzag (it will also subdivide as a double zigzag). Because intermediate wave (2) was so deep the best Fibonacci ratio to apply for the target of intermediate wave (3) is 2.618 which gives a target at 1,428.
Within intermediate wave (3), minor waves 1 and 2 are complete. The upwards movement for minor wave 2 does have a strong three wave look to it at the daily chart level. Minor wave 2 was another deep correction at 0.87 of minor wave 1. Targets for minor wave 3 are 1.618 and 2.618 the length of minor wave 1.
It is still possible (but still less likely) that primary wave 1 is unfolding as a leading diagonal. I will keep that chart up to date and will publish it if and when it begins to diverge from the idea presented here. For now I want to keep the number of charts published more manageable.
HOURLY CHART
This second scenario works in the same way for the hourly bull wave count.
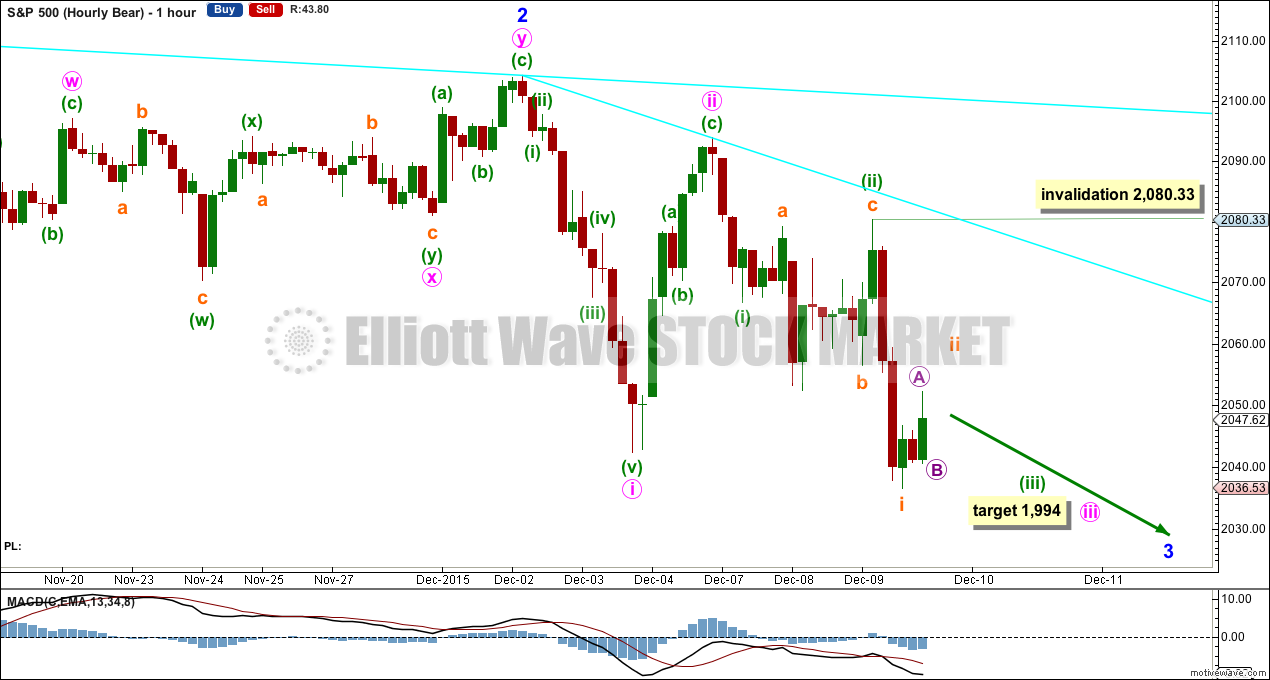
There may now be three (almost) complete overlapping first and second waves. Subminuette wave ii may continue higher tomorrow and may not move beyond the start of subminuette wave i above 2,080.33. In the short term when markets open tomorrow, if price moves above 2,066.78, then this would be the only hourly wave count.
The mid term target is the same for both wave counts. At 1,994 minute wave iii would reach 1.618 the length of minute wave i.
Along the way down upwards corrections may find resistance at the trend line drawn from the highs of minor wave 2 to minute wave ii.
I will not publish the alternate bear wave count today. The subdivisions for this downwards movement no longer fit.
TECHNICAL ANALYSIS
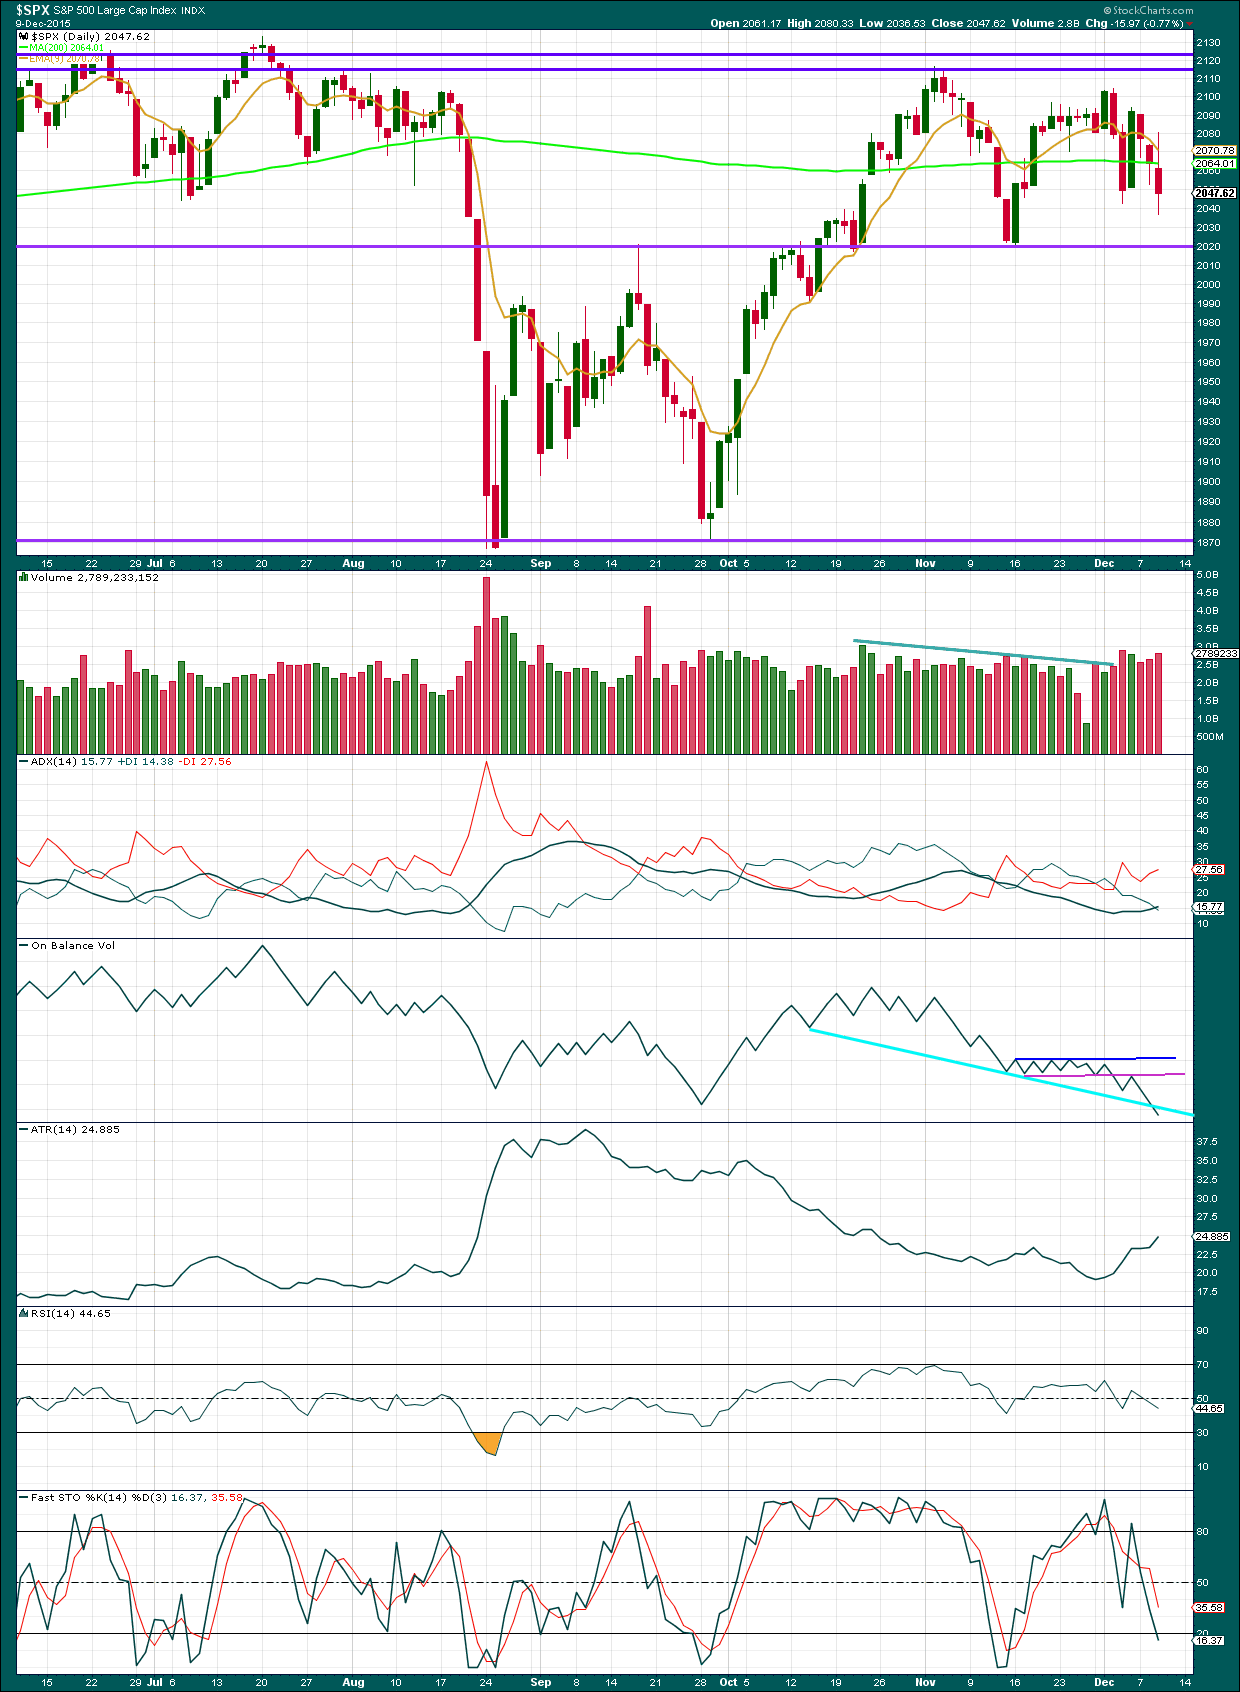
Click chart to enlarge. Chart courtesy of StockCharts.com.
Daily: Price has fallen on rising volume three days in a row. There is support for this downwards movement.
ADX is now just above 15 and increasing. This indicates a new trend may be beginning. The -DX line is above the +DX line, so the trend would be down. ATR agrees as it too is increasing.
On Balance Volume has given another bearish signal today with the break below the cyan trend line.
RSI is neutral. There is plenty of room for this market to fall.
Stochastics is nearing oversold, but during a trending market oscillators may remain extreme for extended periods of time.
A note on Dow Theory: for the bear wave count I would wait for Dow Theory to confirm a huge market crash. So far the industrials and the transportation indices have made new major swing lows, but the S&P500 and Nasdaq have not.
S&P500: 1,820.66
Nasdaq: 4,116.60
DJT: 7,700.49 – this price point was breached.
DJIA: 15,855.12 – this price point was breached.
To the upside, for Dow Theory, I am watching each index carefully. If any make new all time highs, that will be noted. If they all make new all time highs, then a continuation of a bull market would be confirmed. So far none have made new all time highs.
This analysis is published about 09:38 p.m. EST.

Verne
Because we breached 2066. Do you still think we are heading lower now or we still can goto 2080 now then lower?
I think since the invalidation point for sub-minuette two up was not breached (2080.33) that upward movement could be over or close to it and we should see downward movement for sub-minuettte three in an extended minute three down.
I also noted the fact that despite the positive close, there was divergence with UVXY which also closed higher. We should know tomorrow.
yeah i bet first 30 minutes of trading pump and then decline after europe close maybe. I am curios to see what lara says since we breached 2066 invalidation point explanation.
that inverted hammer looks like a dangerous up side is here mattey! Just like july 9
we shall see….
We have indeed!! 😀 😀 😀
be careful before you draw a conclusion matey 😉
futures up! lets see if they can hold it.
hi
bears,
Take a look at this inverted hammer across all indices!
Last time we hit 2132. Same direction this time?
Lara,
In your analysis today can you calculate a target (or potential targets) for subminuette wave iii (if ii has indeed ended) and also the time frames for subminuette iii and minute iii to potentially end?
Thank you!
I have wave b of subminuette ii at 2049.73 – we’ve already overlapped wave a so hopefully if we can get below 2049.73 (without making a new high above 2067.64) subminuette ii should be over
Thank you for your analysis Olga.
It subdivides as a complete double zigzag on the one minute chart.
I tried to see if it would subdivide as an impulse and the third wave within it has so much overlapping it just won’t work. So this is not an impulse up complete, even though on the hourly chart it does look like a possible impulse.
So subminuette wave ii is over now I expect.
A target will be calculated for you.
Thank you Lara.
Lara,
Does that mean we are headed higher short term?
Now that all the bears have been duly rattled, and lots of stops taken out, maybe the party can start in earnest. VIX and UVXY strongly off lows of the session. 🙂
2080.33 next level that must hold to keep the deep sub-minuette wave two upward correction in play…not as huge as wave up for minute two last Friday but pretty big for a correction two degrees lower…
2090 is the pin this week you can count on it…..imo
who knows if it holds but I like the way price sprung back from the 2065 area
inverted hammer?
Same thing happened right before we went to 2132?
Sub-minuette four and first hourly wave count invalidated with move to 2066.84…
i was right once again….
god speed matey!
Now looking like a five up off yesterday’s lows.
oh ok
I have a 3 wave move off yesterdays low with c = a @ about 2068.37
I agree.
As it has moved higher, I agree that is a better look Olga…
hi
all
My updated view. this is going HIGHER A LOT HIGHER! WATCH OUT next 2-8 days 😉
Soooo….are you long the market? 😀
not today just watching maybe next week! i suspect we are going WAY HIGHER! just my 2 cents.
be safe … god speed matey!
Some analysts do see the entire movement off the 2116.48 as a developing triangle. This would mean we are in D of the triangle up with one more decline for E to touch the trendline followed by a break to the upside in a fianal wave up at minor degree. If the invalidation points are breached it would have to be considered.
i had known the fed won’t allow this massive sell off past 3-4% before the meeting. i should have stuck with my ideas 🙂
What if FTSE moves down as Lara’s latest analysis indicates, plus a general selloff in Europe. Would that money flow to US markets causing surge in SPX ?
My personal view is that since this is the FINAL STAGE of the SPX bull market it doesn’t really matter. It was going to go up one last time maybe we go up 2100 pull back a few points and then thrust higher to whatever the final destination is the rest of 2015 as only a few weeks of trading left and then plunge most likely in 1st-2nd quarter 2016…
I think we are definitely going to have a Santa Claus rally, but I think it will be a second wave and not lead to new highs. I think we need to get much more oversold prior to any year-end bounce so I still like Lara’s bear count. Rally bounce would be minor two up of intermediate three. This would make for a perfect set-up for minor three of intermediate three down early in the new year.
So only to 1994 or 1950 at most right then bounce to say oh 2020?
The problem is I like the grind higher scenario better and then sell off after FED because it just ends this bull market in 2015 and doesn’t drag it out into 2016….
what is the second wave again?
Overnight futures definitely bear watching…
+3.5 and going….
+5.75 and going…
uh oh 🙂
Olga and Verne,
TRIANGLE here. 2100 is the target for me 🙂
verne
UH OH!!
MACD CROSS OVER 1 HR!!
verne
HAMMER TIME!
I know…this market is a pain in the booty; the move up is still corrective, until otherwise proven…. 😉
ooooook
hi
olga
One thing i learned in this market is never be stubborn. Its hard to let go a view but if it is not working i just get out. My guess is they will drive this higher i am afraid. Let us wait today 🙂
olga and verne
The weekly SPX has the 50MA @ 2062. Not sure if that is a clue for us here that this “artificial construct” is going up…?
UVXY coiling…don’t be too surprised if we see a new low and quick reversal today. I was not expecting it but we could get another protracted upwards correction into next week’s FOMC gabfest…
really? so now you are temp bullish till FOMC ? maybe we goto 2090s?
verne
this could be a triangle
I could be turning into a trend line psycho………But the thin green line under the black dashed line looks like it is in play
I would not be at all surprised to see a run for the black dashed line. It keeps all wave scenarios viable…nonetheless, UVXY telling us the bulls are going nowhere fast…
verne
looks like we are going up – 2100 – just wow! imo
Hi – could you possibly post a chart of your reasoning it will reach 2100? I might be missing something but thought we needed to at least take out both 2066 and 2080 areas before turning bullish?
Quite right Olga…
hi
olga
Well we hit 2063 on the hourly so that to me means near 2066 was a close enough target and the fact that 2055 is not breaking and is now support – Let us wait for the closing print. – i could be wrong – very difficult just pinning the market here.
volume low perfect time to melt it up.
2063+ at the close today?
I’m still a little confused that 2063 was a close enough target as I thought Wave 4 needed to overlap Wave 1 (other than in a diagonal) in order to be invalidated but many thanks for your reply in any case.
I am however a little concerned that the final wave up from just below 2046 to 2063 appears to me to be a three wave structure
I am flexible with this market counts. I guess you can wait for 2066.
To me it just looks weird and its all about the closing print.
olga
here we are at 2066 – I’m just into trading always looking at charts…
Trend line resistance
50% line resistance from yesterdays high
Banksters at play. Running all the stops of short sellers…ignore ’em
Huge candle on the 15min, plus dow up big. Probably get over 2066 today i am afraid!
We may be looking at sub-minuette two up unfolding. Getting a bit protracted for a fourth wave considering the correction started yesterday. A move above 2066.78 should confirm.
I don’t think it needs to move above 2066.78, but if it *does*, then that would simply confirm the main hourly would be invalidated.
This does look like another deep 2, which would match all the nested 1-2, 1-2, 1-2 moves!
When does this thing become unhinged??? Another break of 2040? I don’t think I can handle this up down up down 1-2, 1-2 stuff for much longer!
The persistent bullishness of market participants means that corrections are going to be protracted to the point of vexation, and the impulses down are going to be swift and brutal. We can afford to be patient…as the bear takes hold, these kinds of annoying delays are going to be a distant memory…
The last overlapping second wave looks to have completed at SPX 2055 (alternate hourly count).
*IF SO* then 3-4, 3-4, 3-4 are up next.
Hi Corey, are you capable of posting charts?
Is the alternate hr count “Lara’s bear hr chart 2 ” ?
Re 2055, S1 of the daily pivot points is 2054.60, …
Yes hr chart 2. I’m leaning toward that chart as my main wave count. The first hourly gets invalidated at 2066.78. Obviously 2055 didn’t hold. Maybe ii needed to go deeper.
Either way both hr charts say down is coming, and coming fast.
From trading memory, if things start getting nasty, then these bounces simply won’t happen anymore (quick 4s), and bears shouldn’t get too cute. Don’t get snookered.
Either that or sub-minuette four, to be followed by sub-minuette five to new lows to complete minuette one down. Minute two lasted all day Friday so minuette two up should probably complete today if that scenario unfolds.
200 DMA providing stout resistance.
I got Lara’s charts mixed up , This is the HR bull ,Lara sees the bear count as more probable, …………but anyway the 2040 area still looks in play as of now
Closer view
ES hr as of now : Watching that light green trend line
Key levels today:
2104.27 would invalidate wave down at intermediate degree
2093.84 would invalidate minute three down.
2066.78 would invalidate sub-minuette four correction
2080.33 would invalidate sub-minuette two correction
Cory pointed up the similar chart profile with the August decline and I am wondering if the weekly time frame may also bear a similar resemblance. The strongest portion of the decline started on Thursday August 20, and continued on Friday, August 21. Capitulation selling occurred on Monday and Tuesday, August 24 and 25, with the low being registered on Monday. If we are indeed seeing a set-up for a triple third today, that could be the case.
I also noticed an anomaly with SPX and SPY, the ETF that tracks the index. SPX made a low on August 24 at 1867.01, and retested on Tuesday August 25 at 1867.08. SPY hit 180.40 on Monday, but on Tuesday bottomed at only 186.92! Unless the chart info was in error, that is quite strange and a huge 6 point difference in the ETF for essentially identical values for the index. Comparable numbers for DJI and DIA were 15,370.33 and 150.56 respectively, and 15,651.24 and 156.29. So it seems as if the Diamonds slightly overshot the index on Monday August 24, and the Spyders way undershot its index on Tuesday August 25.
It could be as market moves become more violent over the coming months, the algos controlling derivatives pricing are going to be overwhelmed and start doing very strange things. Be nimble and careful out there…strange times are coming…
Lara,
It is days like today that I really miss your video commentary. You have several scenarios / alternates etc. It is all somewhat confusing and difficult to follow from your written analysis alone. I’ve read it several times and still I am not sure I understand fully. The videos were quite valuable and I miss them.
Thank you,
Rodney
I’ll post a short video explaining the important difference today.
It’s really only a small difference at the hourly chart level.
I’m publishing a few different ideas at the daily chart level I know, but remember it is the Bear wave count which I prefer, it has more support, and it expects a big downwards movement. So timing is the key for that kind of market, and so the small differences at the hourly chart level are the thing to focus on for tomorrow.
The quick video will cover what I think are the most important aspects.
So we have an embedded 1-2 1-2 1-2 within a 3rd of a 3rd of a 3rd.
Looking at all the European indices, transports, CRB, small caps, breadth, HY debt, credit spreads, yield curve, PMI, etc. etc. and they are all saying the same thing.
I suppose if anyone could ever pick an opportune time to be short SPX it would be now…
yes!
Yes. Its timing the entry, picking a good point, that is the key.
And it’s really hard to do!
This market is fast, and the rallies are quick and steep.
exactly lara
Excellent perspectives Lara. Thank you.
Good Luck everyone.