The preferred hourly bear Elliott wave count led the way today.
The Elliott Wave counts are the same.
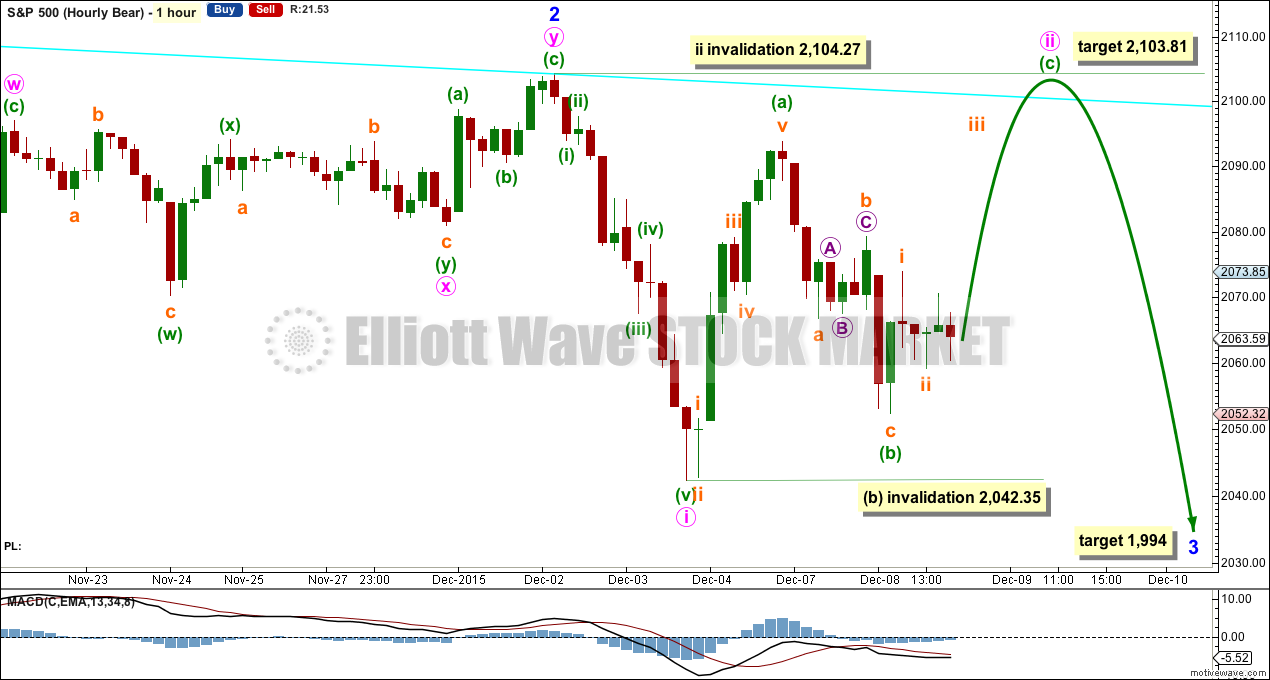
Summary: The preferred hourly bear wave count expects upwards movement to 2,103.81 tomorrow. It may take two days to get there. If we see a new low below 2,042.35 though, then the scenario for the hourly bull wave count would be confirmed and a third wave down may be expected to be in the very early stages. The target is at 1,994.
To see how each of the bull and bear wave counts fit within a larger time frame see the Grand Supercycle Analysis.
To see last analysis of weekly and monthly charts click here.
If I was asked to pick a winner (which I am reluctant to do) I would say the bear wave count has a higher probability. It is better supported by regular technical analysis at the monthly chart level, it fits the Grand Supercycle analysis better, and it has overall the “right look”.
New updates to this analysis are in bold.
BULL ELLIOTT WAVE COUNT
DAILY CHART – COMBINATION OR FLAT
Cycle wave IV should exhibit alternation to cycle wave II.
Cycle wave II was a shallow 0.41 zigzag lasting three months. Cycle wave IV should exhibit alternation in structure and maybe also alternation in depth. Cycle wave IV may end when price comes to touch the lower edge of the teal channel which is drawn about super cycle wave V using Elliott’s technique (see this channel on weekly and monthly charts).
Cycle wave IV may end within the price range of the fourth wave of one lesser degree. Because of the good Fibonacci ratio for primary wave 3 and the perfect subdivisions within it, I am confident that primary wave 4 has its range from 1,730 to 1,647.
If a zigzag is complete at the last major low as labelled, then cycle wave IV may be unfolding as a flat, combination or triangle.
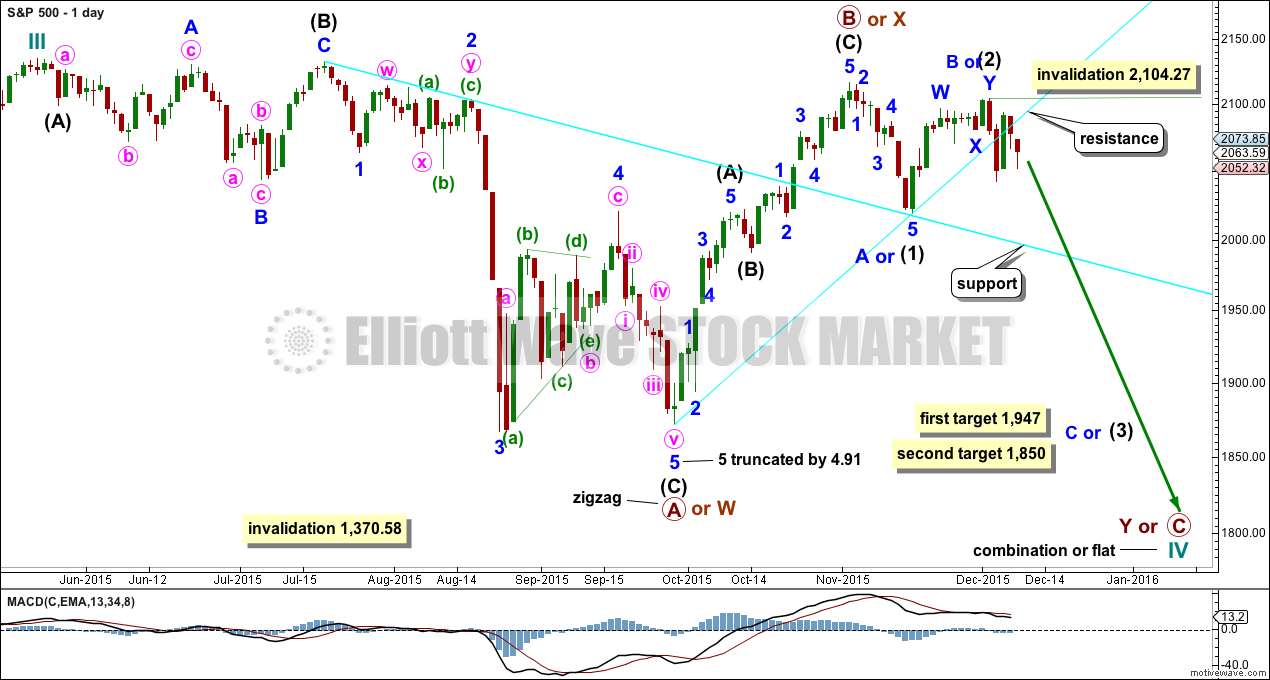
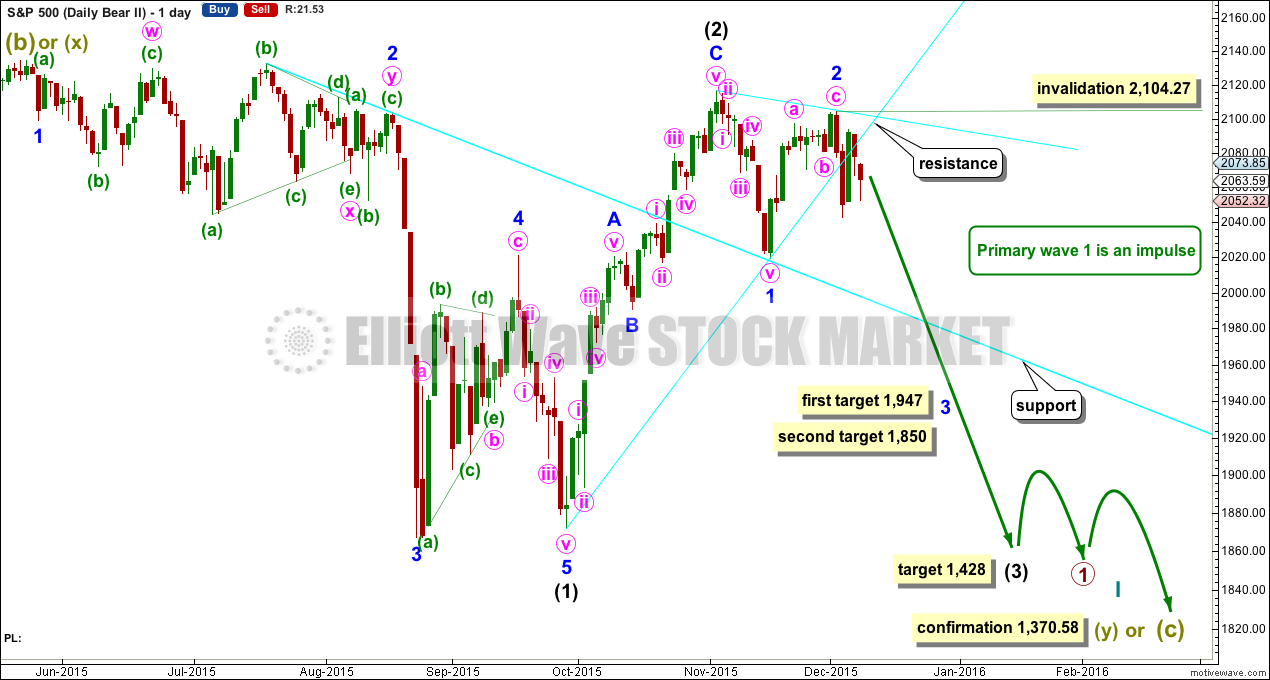
The wave count is changed today to again see primary wave B or X as a zigzag completed earlier. Primary wave C should subdivide as a five and primary wave Y should begin with a zigzag downwards. This downwards movement is either intermediate waves (1)-(2)-(3) of an impulse for primary wave C or minor waves A-B-C of a zigzag for intermediate wave (A). Both these ideas need to see a five down complete towards the target, so at this stage there is no divergence in expectations regarding targets or direction.
Primary wave A or W lasted three months. Primary wave Y or C may be expected to also last about three months.
Within the new downwards wave of primary wave C or Y, a first and second wave, or A and B wave, is now complete. Intermediate wave (2) or minor wave B lasted a Fibonacci 13 days exactly. At 1,947 intermediate wave (3) or minor wave C would reach 1.618 the length of intermediate wave (1) or minor wave A. If price falls through this first target, or gets there and the structure is incomplete, then the next target would be at 1,850 where intermediate wave (3) or minor wave C would reach 2.618 the length of intermediate wave (1).
No second wave correction may move beyond the start above 2,104.27 within intermediate wave (3) or minor wave C.
DAILY CHART – TRIANGLE
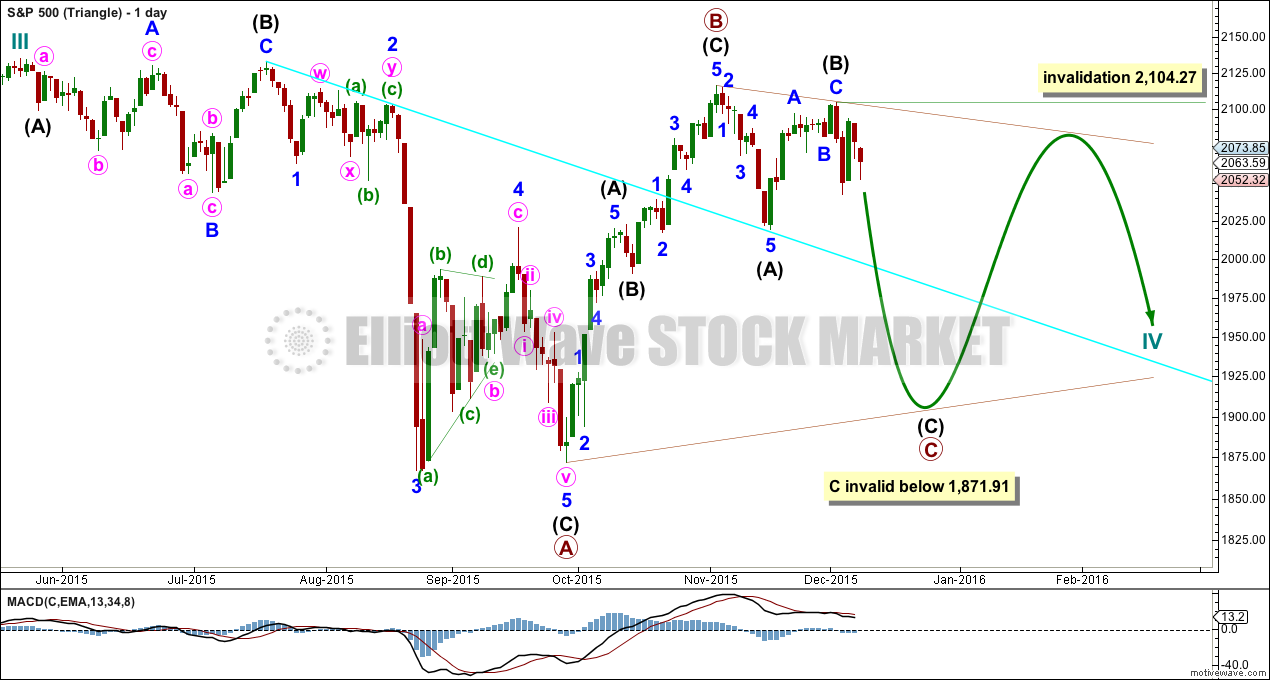
Cycle wave IV may unfold as a shallow triangle. This would provide alternation with the 0.41 zigzag of cycle wave II.
Primary wave B may be a complete zigzag. Primary wave C downwards may be underway and within it intermediate waves (A) and (B) are complete. No second wave correction may move beyond its start above 2,104.27 within intermediate wave (C).
The whole structure moves sideways in an ever decreasing range. The purpose of triangles is to take up time and move price sideways. A possible time expectation for this idea may be a total Fibonacci eight or thirteen months, with thirteen more likely. So far cycle wave IV has lasted six months.
HOURLY CHART
The two hourly wave counts will look at two different ways, and both work for bull and bear (the degree of labelling for this bull is one degree higher).
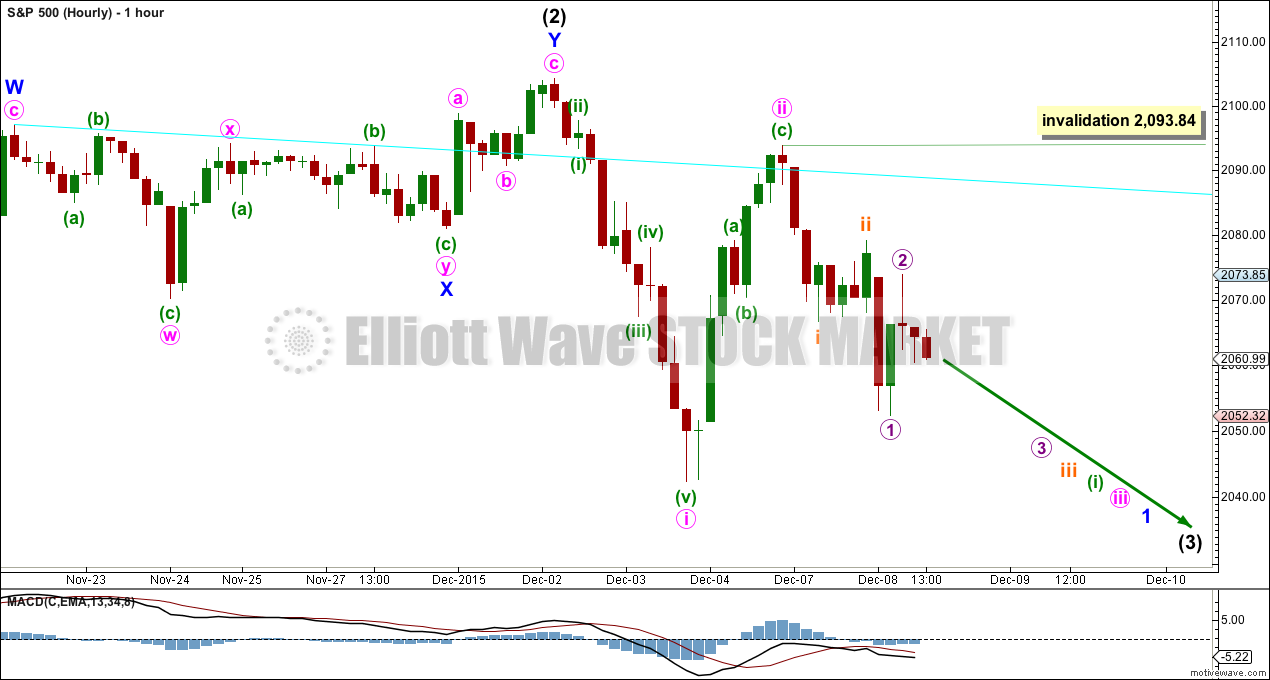
Minute wave ii may have been over as a quick zigzag. Minute wave iii may have begun.
Within minute wave iii, I would expect that minuette wave (i) is incomplete. When it is done minuette wave (ii) may not move beyond its start above 2,093.84.
At 1,994 minute wave iii would reach 1.618 the length of minute wave i.
There may now be two overlapping first and second waves within minuette wave (i). This indicates an increase in downwards momentum should begin tomorrow. A new low below 2,042.35 would invalidate the scenario presented for the hourly bear wave count and provide confidence in this scenario. At that stage, an impulse downwards should be expected to continue.
ALTERNATE BULL ELLIOTT WAVE COUNT
DAILY CHART
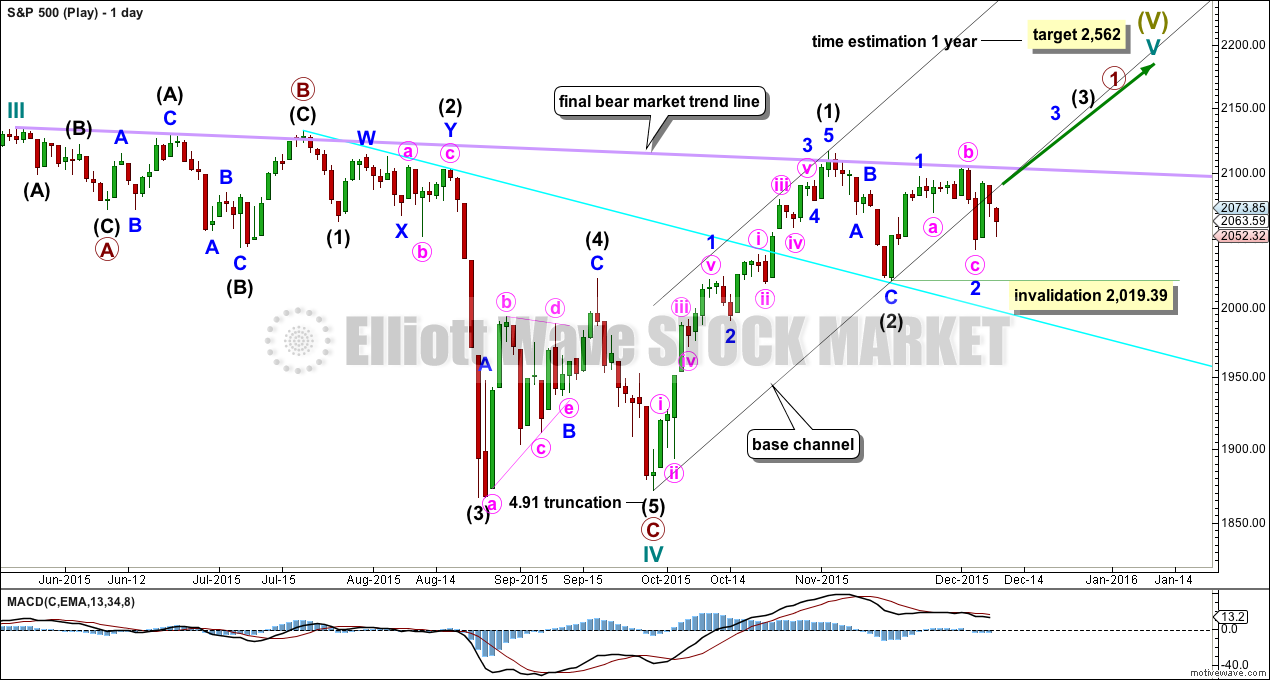
It is possible to see cycle wave IV a completed flat correction. This would provide some structural alternation with the zigzag of cycle wave II.
This is a regular flat but does not have a normal regular flat look. Primary wave C is too long in relation to primary wave A. Primary wave C would be 3.84 short of 4.236 the length of primary wave A. While it is possible to also see cycle wave IV as a complete zigzag (the subdivisions for that idea would be labelled the same as the bear wave count below, daily chart) that would not provide structural alternation with the zigzag of cycle wave II, and so I am not considering it.
This idea requires not only a new high but that the new high must come with a clear five upwards, not a three.
At 2,562 cycle wave V would reach equality in length with cycle wave I. Cycle wave I was just over one year in duration so cycle wave V should be expected to also reach equality in duration. Cycle degree waves should be expected to last about one to several years, so this expectation is reasonable. It would be extremely unlikely for this idea that cycle wave V was close to completion, because it has not lasted nearly long enough for a cycle degree wave.
I added a bear market trend line drawn using the approach outlined by Magee in “Technical Analysis of Stock Trends”. When this lilac line is clearly breached by upwards movement that shall confirm a trend change from bear to bull. The breach must be by a close of 3% or more of market value. If it comes with a clear five up, then this wave count would be further confirmed.
While price remains below the bear market trend line, we should assume the trend remains the same: downwards.
Intermediate wave (1) is a complete five wave impulse and intermediate wave (2) is a complete three wave zigzag.
For this wave count, when the next five up is complete that would be intermediate wave (3). Within intermediate wave (3), no second wave correction may move beyond the start of its first wave below 2,019.39.
This wave count does not have support from regular technical analysis and it has a big problem of structure for Elliott wave analysis. I do not have confidence in this wave count. It is presented as a “what if?” to consider all possibilities.
Today I have added a black base channel about intermediate waves (1) and (2). Minor wave 2, one degree lower, has breached the base channel. Price remains below it so far. This further reduces the probability of this wave count. Base channels normally provide support or resistance for lower degree corrections, but not always. When a base channel is breached the probability of the wave count reduces but is not invalidated.
BEAR ELLIOTT WAVE COUNT
DAILY CHART
This bear wave count has a better fit at Grand Super Cycle degree and is better supported by regular technical analysis at the monthly chart level. But it is a huge call to make, so I present it second, after a more bullish wave count, and until all other options have been eliminated.
There are two ideas presented in this chart: a huge flat correction or a double flat / double combination. The huge flat is more likely. They more commonly have deep B waves than combinations have deep X waves (in my experience).
A huge flat correction would be labelled super cycle (a)-(b)-(c). It now expects a huge super cycle wave (c) to move substantially below the end of (a) at 666.79. C waves can behave like third waves. This idea expects a devastating bear market, and a huge crash to be much bigger than the last two bear markets on the monthly bear chart.
The second idea is a combination which would be labelled super cycle (w)-(x)-(y). The second structure for super cycle wave (y) would be a huge sideways repeat of super cycle wave (a) for a double flat, or a quicker zigzag for a double combination. It is also possible (least likely) that price could drift sideways in big movements for over 10 years for a huge triangle for super cycle wave (y).
The downwards movement labelled intermediate wave (1) looks like a five. If minor wave 2 is seen as a double zigzag with a triangle for wave X within it, then the subdivisions all fit nicely.
Ratios within intermediate wave (1) are: minor wave 3 is 7.13 points short of 6.854 the length of minor wave 1, and minor wave 5 is just 2.81 points longer than 0.618 the length of minor wave 3. These excellent Fibonacci ratios add some support to this wave count.
Intermediate wave (2) was a very deep 0.93 zigzag (it will also subdivide as a double zigzag). Because intermediate wave (2) was so deep the best Fibonacci ratio to apply for the target of intermediate wave (3) is 2.618 which gives a target at 1,428.
Within intermediate wave (3), minor waves 1 and 2 are complete. The upwards movement for minor wave 2 does have a strong three wave look to it at the daily chart level. Minor wave 2 was another deep correction at 0.87 of minor wave 1. Targets for minor wave 3 are 1.618 and 2.618 the length of minor wave 1.
It is still possible (but still less likely) that primary wave 1 is unfolding as a leading diagonal. I will keep that chart up to date and will publish it if and when it begins to diverge from the idea presented here. For now I want to keep the number of charts published more manageable.
Today I have added another line for resistance: from the high of intermediate wave (2) to the high of minor wave 2. This trend line may be the first and next line of resistance.
HOURLY CHART
Minute wave ii may still be incomplete as a deeper and longer lasting zigzag. At 2,103.81 minuette wave (c) would reach equality in length with minuette wave (a). Minuette wave (c) must subdivide as a five wave structure.
Upwards movement labelled subminuette wave i fits as a zigzag on the one minute chart. This may be subminuette wave i of an ending diagonal for minuette wave (c).
However, with a three up and fives down, the probability of the first hourly wave count has increased today. There is some volume support for today’s downwards movement, so the picture is not as clear as yesterday. Today I would rather sit on the fence and say both scenarios presented at the hourly chart level are about even in probability. Price will tell us which one is correct very shortly.
Minuette wave (b) may not move beyond the start of minuette wave (a) below 2,042.35.
If minuette wave (c) takes two or five more days to complete, it may end in a total Fibonacci five or eight.
Minute wave ii may not move beyond the start of minute wave i above 2,104.27.
ALTERNATE BEAR ELLIOTT WAVE COUNT
DAILY CHART
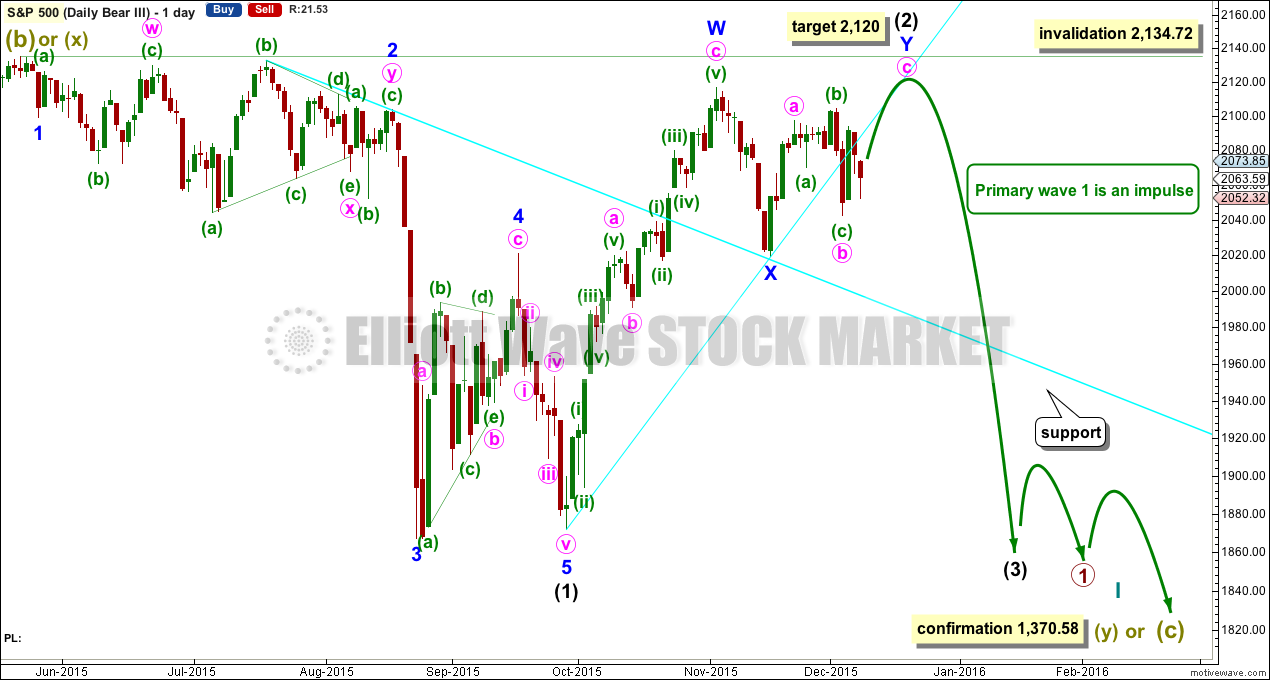
What if we see a new high above 2,104.27?
It is possible that intermediate wave (2) could be continuing as a double zigzag. This cannot be a combination. The second structure in the double cannot be a flat correction because the b wave within it is less than 0.9 the length of the a wave.
Double zigzags exist to deepen a correction when the first zigzag in the double does not move price deep enough. In this instance, the first zigzag in the double is a 0.93 length of intermediate wave (1); it is very deep indeed. A second zigzag is not required because the first was very deep. This structure meets the rules but not the purpose of a double zigzag, so it does not have the right look.
This idea has a low probability. But it is technically possible. It should only be used if price moves above 2,101.27.
At that stage, a five up on the hourly chart would be required to complete. It should move above 2,116.48, so that the second zigzag in the double deepens the correction and meets its purpose. It may not move above 2,134.72.
At 2,120 minute wave c would reach equality in length with minute wave a.
TECHNICAL ANALYSIS
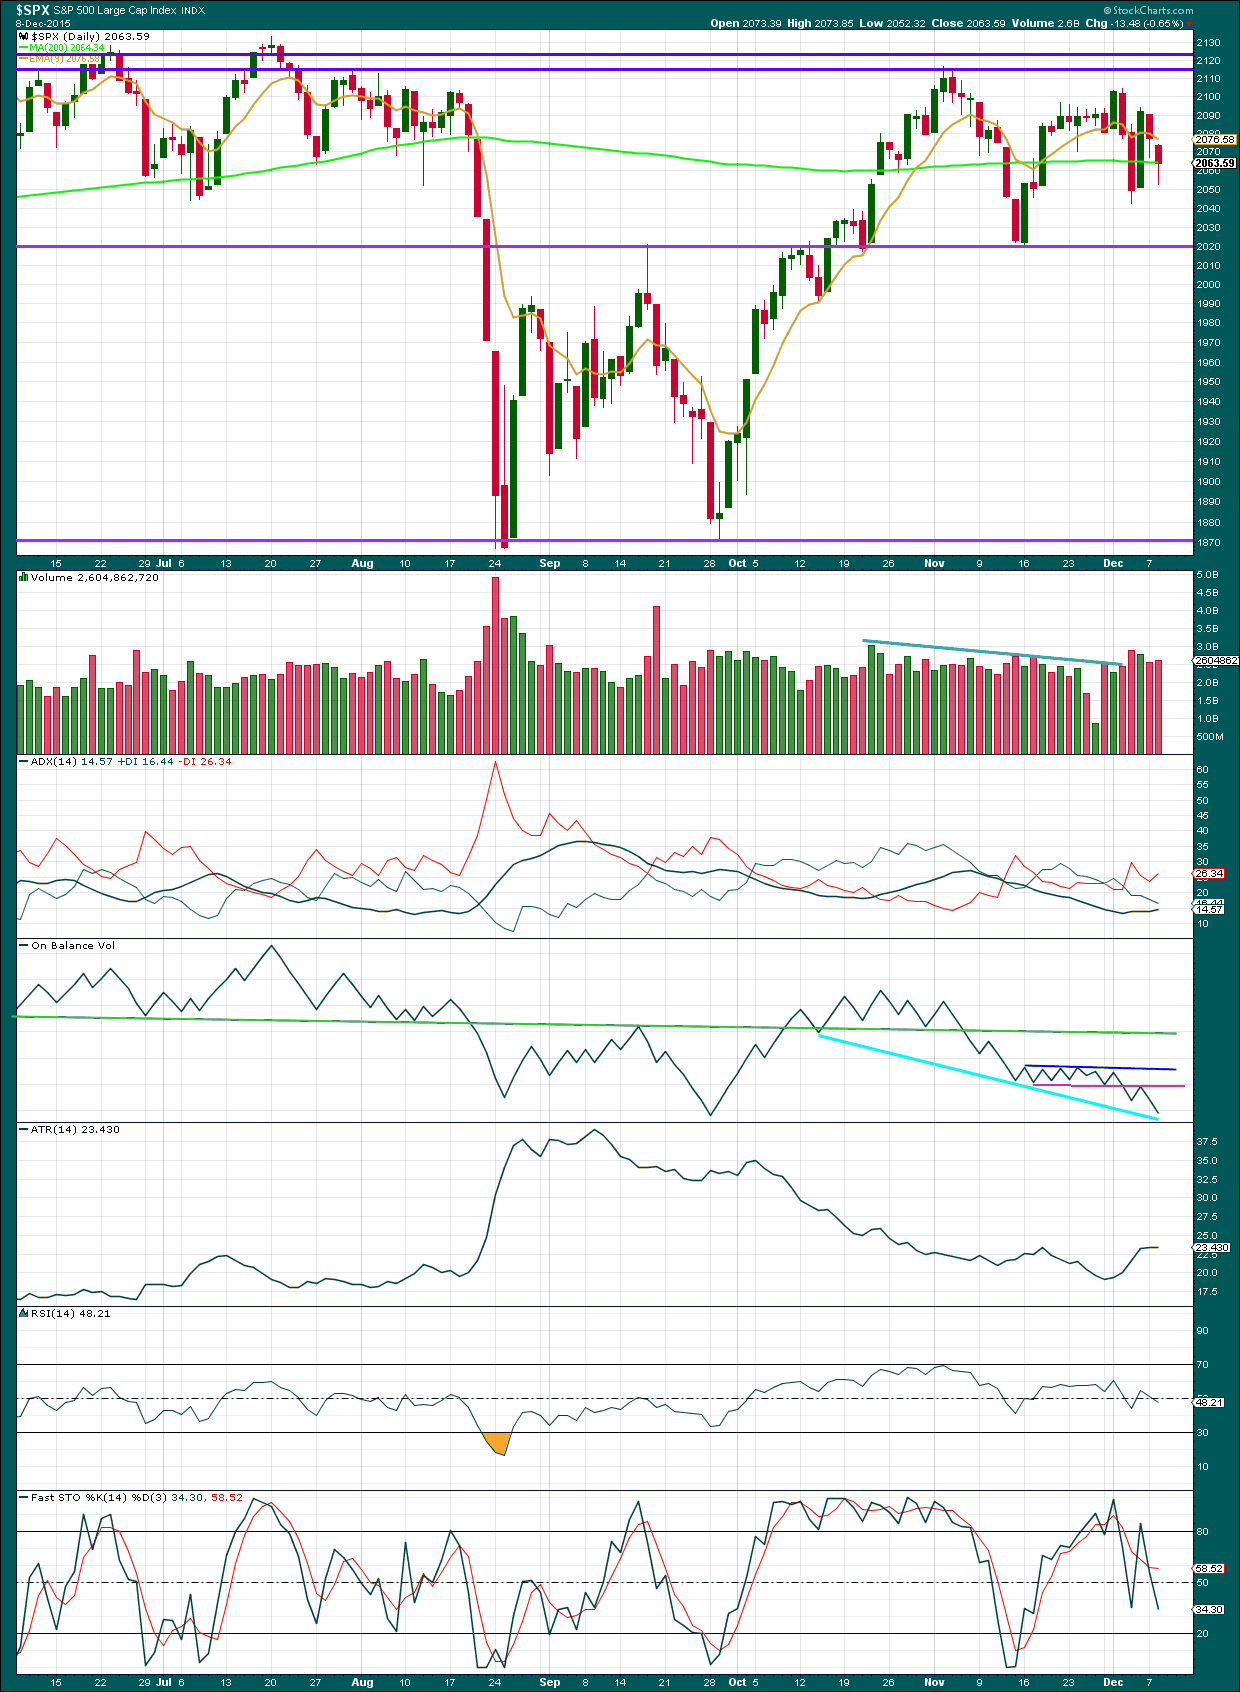
Click chart to enlarge. Chart courtesy of StockCharts.com.
Daily: There is a slight increase in volume for today’s session providing some support for the fall in price.
ADX is increasing but still below 15. No clear trend is yet indicated. ATR is rising to flat indicating price may be in the earliest stage of a new trend.
On Balance Volume will be watched closely. It has come to almost find support at the cyan trend line. This may halt the fall in price about here. If OBV breaks below this cyan line, that would be a fairly bearish indication. If OBV turns upwards, it should find resistance at the pink line.
Neither RSI nor Stochastics are oversold. There is plenty of room for this market to fall.
A note on Dow Theory: for the bear wave count I would wait for Dow Theory to confirm a huge market crash. So far the industrials and the transportation indices have made new major swing lows, but the S&P500 and Nasdaq have not.
S&P500: 1,820.66
Nasdaq: 4,116.60
DJT: 7,700.49 – this price point was breached.
DJIA: 15,855.12 – this price point was breached.
To the upside, for Dow Theory, I am watching each index carefully. If any make new all time highs, that will be noted. If they all make new all time highs, then a continuation of a bull market would be confirmed. So far none have made new all time highs.
This analysis is published about 09:11 p.m. EST.

Verne
NO JINX – Check out this playbook FOR SPX the rest of this week into next…
1. We potentially bounce intraday max 2063-64 tomorrow then price gets rejected and we just plunge back down to 2030s by the close.
2. Friday we take out 2020 and park it say 2010.
Next week
3. Monday is a NEW moon, I like astrology finance – spells SELL OFF to me around 2000. Trick the foolish bulls to GO LONG.
4. Calendar FOMC Day 1 – Tuesday 1994.
5. Calendar FOMC Day 2 – Spike it into the meeting 2016 with a reversal at 1975.
6. Close the week 1950-1930.
7. Try to get to 1850 before the 23rd…
8. Miller Time!
I would have liked to see a bit more downside conviction in this possible third wave today. If we make a new low first thing tomorrow followed by a quick reversal, Lara’s triangle could still be in play and I would take profits just to play it safe. We could be looking at a fourth wave correction today. We should get a spike in VIX – it did not act like the end of third down today.
Futures pushed lower
There was a small short covering 45 min before the close it didn’t change things by that much.
Vix huge hammer on daily
This will dump no jinx
Stick with the wave count
2020 should be cut right through by this Friday
Make no mistake the fed will raise rates!
Cheers !
Thanks for the reminder. I always get jittery over these intra-day reversals. We are probably not even done with minuette one as yet, which means much more to come…!
Hard to imagine what the market will do IF (as I maintain they will) the FED stands pat. I think they are in a no-win situation…a veritable stew of their own brewing…
Futures up +.40%. The tricks continue. I know hope isn’t a strategy but they got to push it back down 😉
hi
all
Thanks for the team blog comments. Many thanks to Verne – we have our convictions in the markets short term – hope it was fun reading 😉
have a great night!
Heavy hitters backing up the truck on volatility calls. Two monster lower wicks on declines today. Batten down the hatches….
i agree
Nice curve Lara!
On the daily chart the last two highs (3 Nov and 2 Dec) both have bearish engulfing candlestick patterns.
For 2 Dec there’s a small bearish engulfing candlestick pattern on the hourly chart at that high too.
The correction for minute ii (and the hourly bear and hourly bull will again be the same today, they’ll be both labelled as the hourly bull was above in this analysis) lasted a Fibonacci 8 hours and the next correction for minuette (ii) lasted a Fibonacci 13 hours.
That’s interesting. Nice when the S&P does that.
The target for this wave is 1,994.
I’ll move the invalidation point down today to todays high at 2,080.33.
There will be corrections along the way down of course, I’ll use sloping trend lines for resistance. Draw one on the hourly chart from the high of minor 2 (I’m referring to labelling on the hourly bear again) to the next swing high which will now be labelled minute ii. Todays high came close, but does not touch it.
Use that line for resistance along the way down.
Good luck everybody!
Thank you as I need it…
Beautiful, thanks!
Lara
Great precision work! thanks a bunch!
Are you around Lara?
2040 area is being played with …….even though it was broken….tricky stuff
?
Good morning John 🙂
It looks like there’s probably a third wave down underway now.
Still in the early stages though.
Currently looks like there’s a correction unfolding. If we draw a trend line from the August low to the low I have labelled minute i on 3rd Dec (bear hourly) this correction may find resistance at that line.
verne
nice call. looks like a bull trap. you really think that is all that is left matey?
We pay for Lara’s insight and analysis- we ought to listen to the lady. Look at her downside targets.
i did i just needed confirmation of a break. It is easy to short but to early can bite you 😉
The only thing I wanted clarity on was INTRA Price as opposed to close. Is it the closing print of a price below 2042 or intraday?
I suspect we will hit the fifth wave of this first wave down by the close followed by another manic second wave re-tracement. A personal call on whether to grab some profits today or hold on for the real action in the wings…
nah, the reversal was big today – just huge- ndx getting crushed. We should continue to dump to the target 1994 by 1-2 days before the fed and then bounce with a spike into the meeting by the mid 2000’s and then reverse hard again is my take…
like I said I am not a bull or bear just an OPTIONS TRADER….
Risk is my middle name…
Something like that matey….I’ve got a funny feeling about that much anticipated FOMC meeting….know whatta mean??!!
🙁
The tricky part was seeing it dump before FOMC to much but I had 1-3% range today it broke it and I can’t disagree so I am in SHORT!
I have to admit I lost a small fortune it happens in this line of work a “sizable change to me at least” but it is o.k not the end of the world!
There is always 1740-1630 next year 😉
Verne
I just got back from a coffee break. Looks like DOWN it goes MATTEY!
lesson 2 for me today. Never take a coffee break on a reversal day 😉
I thought about shooting you a heads up when you indicated you were leaving as I suspected something was brewing. You can recoup your losses today when and if VIX spikes the next few days…
We are all a team matey! If i need to be here you just say it….
Yeah I hope so. I’ll send a christmas card 😉
Gota be robot trading
Breaking the 2040 area!
I would like to thank the bulls for the cheap volatility calls so kindly delivered by this morning’s pop. 🙂
But I gotta tell ya, I absolutely go ROBBED on those bullish put spreads, ROBBED, I tell ya… 😀 😀
Looks to me like that’s all she wrote….
All gaps filled…
Vern, What price was the Thur gap?
Close at 2042.35
All gaps to the UPSIDE, that is…
Boy this is revealing…this morning’s pop should have seen a real haircut in premiums for near dated put options and guess what…? THEY’VE HARDLY BUDGED!.. hmmmnn….not even worth cashing in my bullish put credit spreads…
These bulls are pathetic…you mean to tell me they can’t even fill a lil’ ole’ gap from Thursday????!!! Come on guys help us out here…!! 😀
I am getting absolutely no pop on my upside hedges…they know what’s a’ comin’….
Now yer’ talkin’…! 😀
Oops! I meant the gap from MONDAY…sorry…. last Thursday’s gap is next…
verne
Nothing to see here. Im taking the day off. BULLISH!
I would not get too attached to any long positions matey….
I’m long bio tech. 1-2 day trade won’t kill me.
last week as an education example I jumped in on GOOGL for 4 hours – 100% return! Cant ask for more!
cheers matey – enjoy the melt up on SPX 😉
Nice! 🙂
Math guys out there? What would the 5MDA be on the hourly? 42 MHA???
All
Very important lesson in this market to me over the years. YOU BUY AT SUPPORT!
Still early, an hour to go, but as the RSI is sideways the ES is heading into a corner
Down we go ……..Test 2040 area before the open ……….maybe
Head fake , back above the rising black line
ES 60 but different chart : bottom red line looks like tested support
Broke above the 200MDA , Daily pivot point and testing the middle BB , a break above the middle BB would be bullish
Verne
I am looking for a huge Gravestone Doji on the daily on any of the 4 US indices…
MERGER! Should help levitate things 😉
Verne
In 5-10 days the whole trading world will change. No JINX. Hopefully your bear spirit kicks in FULL FORCE 🙂
Verne
I made a quick chart on SPX vs JNK. Last time JNK was this low we bounced? Is this a coincidence?
All
Probability from my side favors a bounce as well. Looks like tomorrow and Thursday will be a GAP AND GO! One thing I saw late last week but didn’t react on was the MORNING STAR on the VIX WEEKLY. Now it is sporting a HUGE DOUBLE BUTTOM. BE SAFE!
NO JINX!
Verne
ES Futures up ~+.25% so looks like we are headed back up near 2100 😉
Updates! +.30%
short term bullish!
It looks like a bounce of sorts is coming; I don’t think it is going as high as some expect. NDX futures lagging notably. I am looking for last Thursday’s gap to be filled at which point I am cashing in my upside hedges.
Keeping an eye on transports as they look to take out the August lows. If the steep decline continues to today I would consider that an early warning…
I concour.
Excellent, thanks for the options Lara. These are the two I’m watching and I was pretty surprised to follow the 5 and 1 minute charts and so many 5 down and 3 up patterns with lower highs. I’m 90% positioned but saved a little in case we get that move up to 2100 area.
Have a great night.
Lara,
Awesome work! Really helpful!