With price moving mostly sideways in a very small range due to a public holiday and NY open only half a day, the wave count is unchanged.
Summary: The trend is still down, but a bear market rally continues and is not done yet. It may end at the end of next week. A new high above 2,116 is expected. The target for this rally to end is now at 2,118. Thereafter, the downwards trend should resume in force. This bear market rally is extremely unlikely to make a new all time high. It is expected to stop before 2,134.72.
To see how each of the bull and bear wave counts fit within a larger time frame see the Grand Supercycle Analysis.
To see last analysis of weekly and monthly charts click here.
If I was asked to pick a winner (which I am reluctant to do) I would say the bear wave count has a higher probability. It is better supported by regular technical analysis at the monthly chart level, it fits the Grand Supercycle analysis better, and it has overall the “right look”.
New updates to this analysis are in bold.
BULL ELLIOTT WAVE COUNT
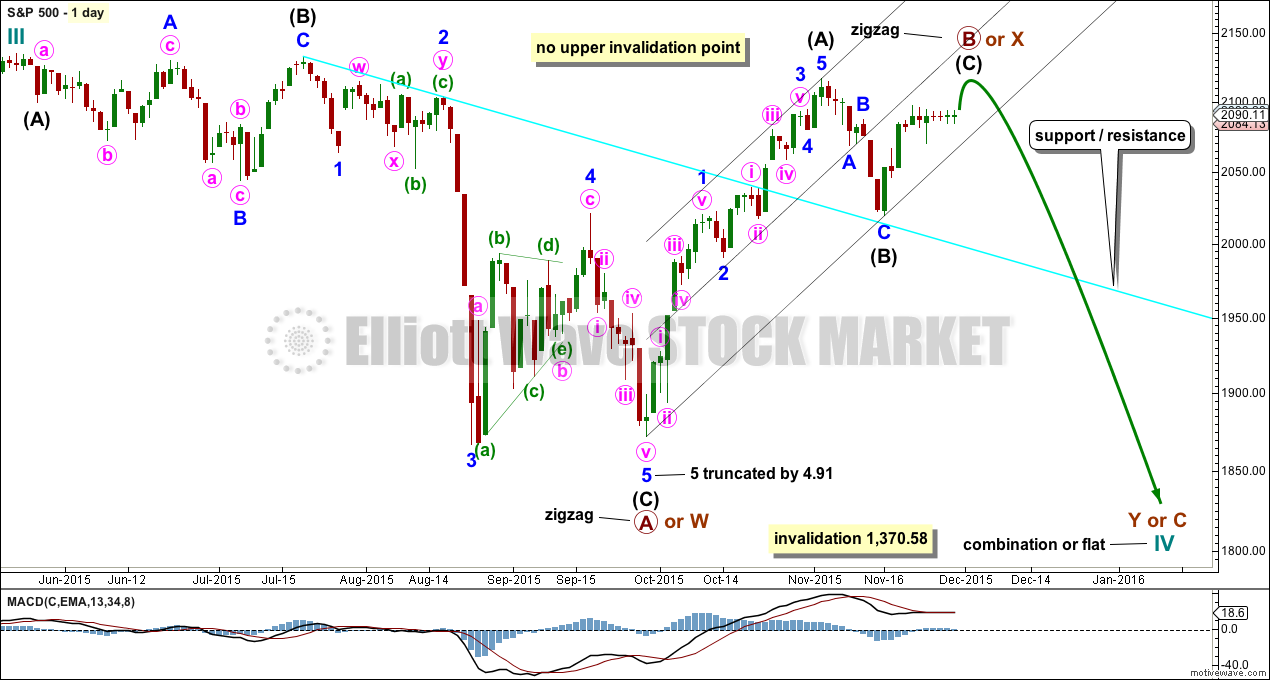
DAILY CHART – COMBINATION OR FLAT
Cycle wave IV should exhibit alternation to cycle wave II.
Cycle wave II was a shallow 0.41 zigzag lasting three months. Cycle wave IV should exhibit alternation in structure and maybe also alternation in depth. Cycle wave IV may end when price comes to touch the lower edge of the teal channel which is drawn about super cycle wave V using Elliott’s technique (see this channel on weekly and monthly charts).
Cycle wave IV may end within the price range of the fourth wave of one lesser degree. Because of the good Fibonacci ratio for primary wave 3 and the perfect subdivisions within it, I am confident that primary wave 4 has its range from 1,730 to 1,647.
If a zigzag is complete at the last major low as labelled, then cycle wave IV may be unfolding as a flat, combination or triangle.
Primary wave B or X is an incomplete zigzag unfolding upwards. If cycle wave IV is an expanded flat correction, then primary wave B may make a new high above the start of primary wave A at 2,134.72. If cycle wave IV is a combination, then primary wave X may make a new high above the start of primary wave W. There is no upper invalidation point for these reasons.
Primary wave A or W lasted three months. When it arrives primary wave Y or C may be expected to also last about three months.
Intermediate waves (A) and (B) together lasted a Fibonacci 34 days within primary wave B or X. So far intermediate wave (C) has lasted ten days. It may end in a further three days to total a Fibonacci thirteen.
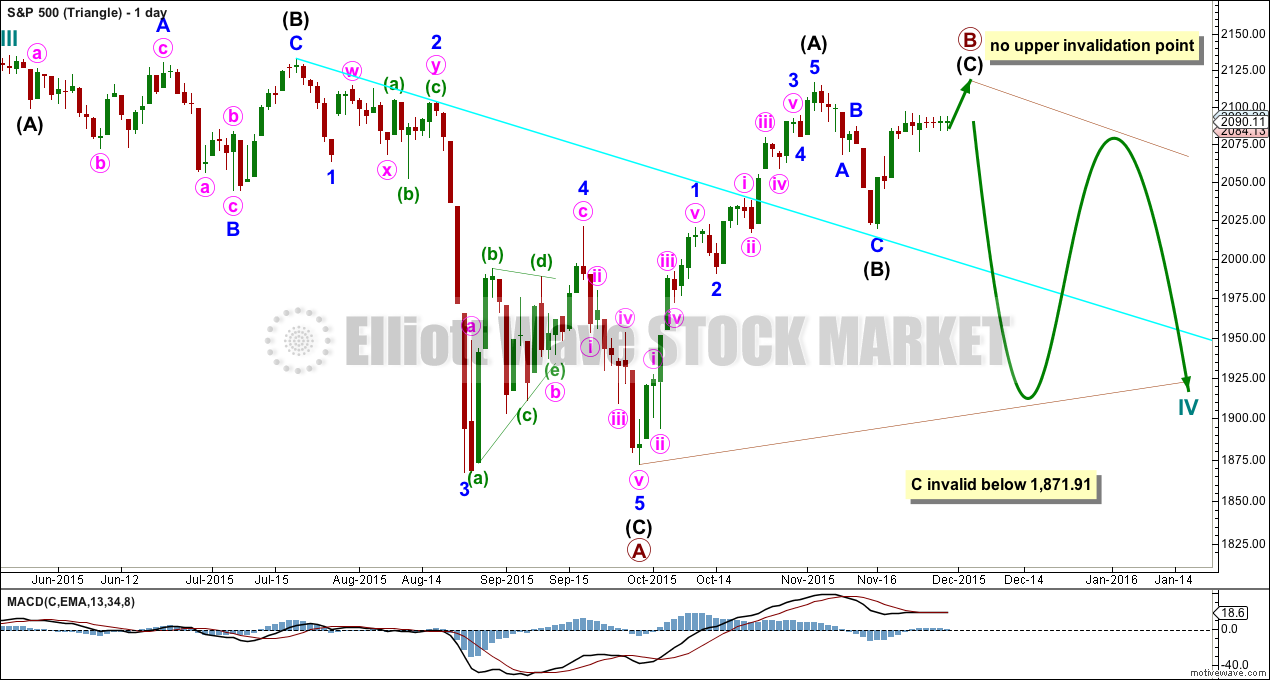
DAILY CHART – TRIANGLE
Cycle wave IV may unfold as a shallow triangle. This would provide alternation with the 0.41 zigzag of cycle wave II.
Primary wave B may be unfolding as a zigzag. Primary wave B may make a new high above the start of primary wave A at 2,134.72 as in a running triangle. There is no upper invalidation point for this wave count for that reason.
The whole structure moves sideways in an ever decreasing range. The purpose of triangles is to take up time and move price sideways. A possible time expectation for this idea may be a total Fibonacci eight or thirteen months, with thirteen more likely. So far cycle wave IV has lasted six months.
HOURLY CHART
Again, both hourly charts are the same today.
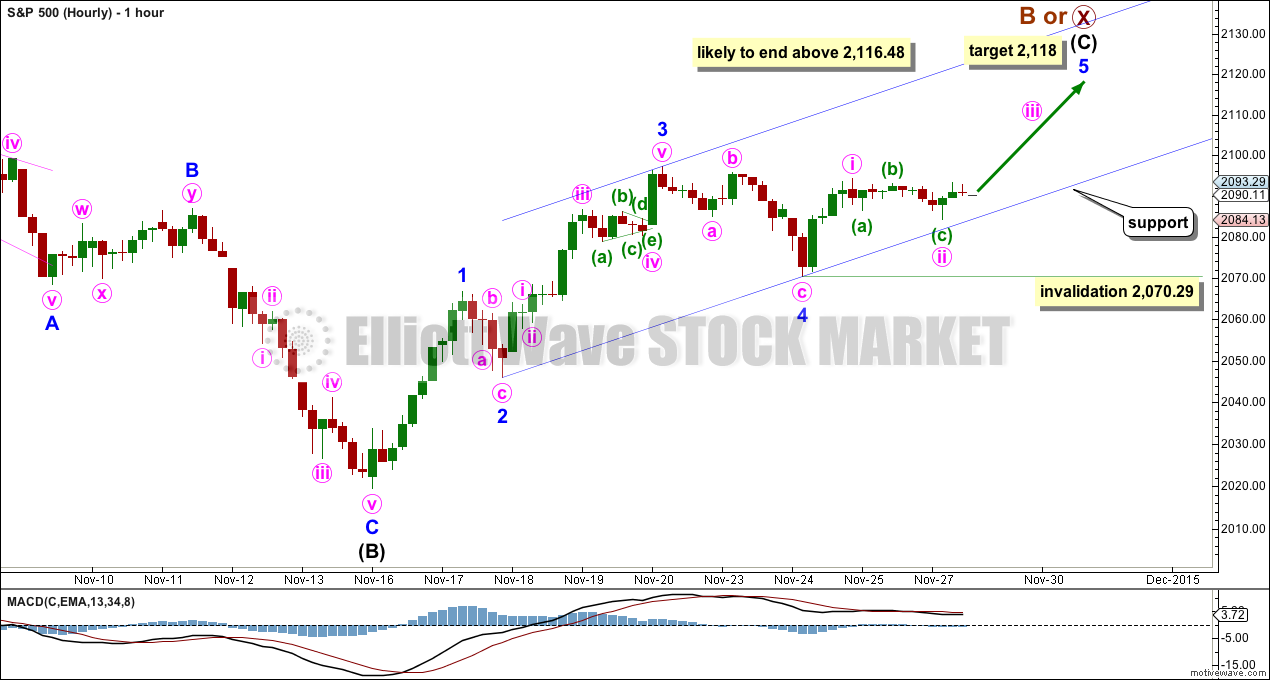
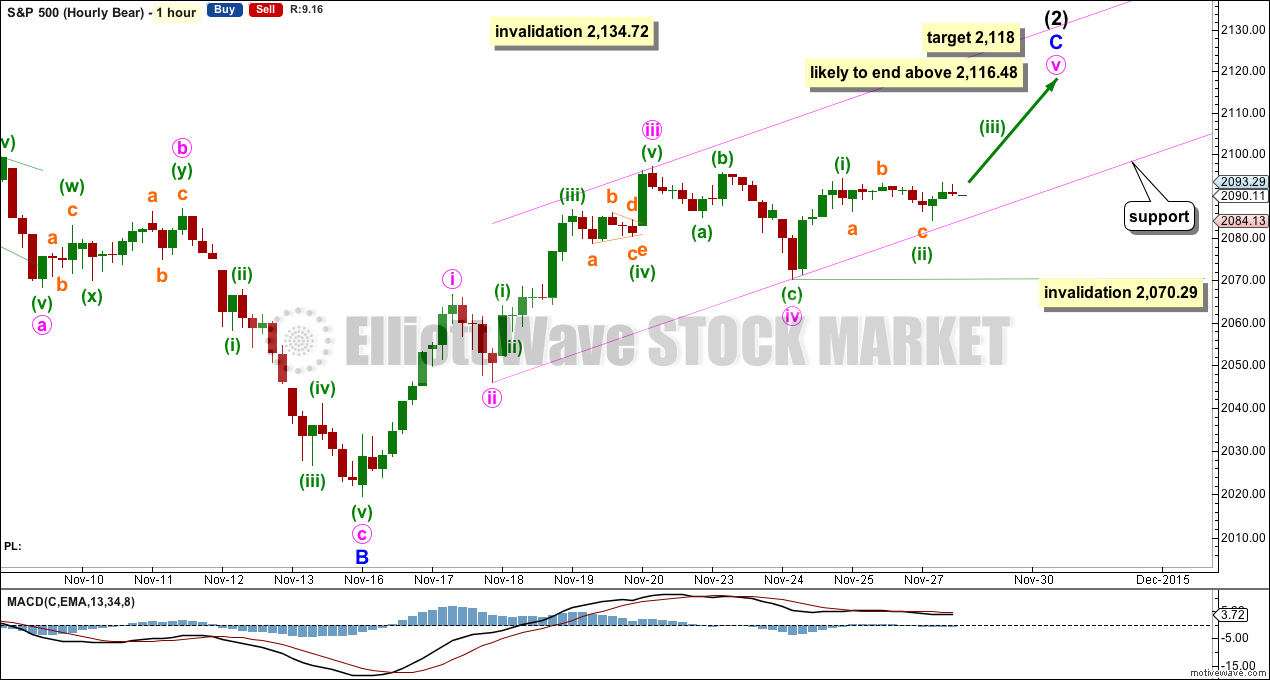
At 2,118 minor wave 5 would reach equality in length with minor wave 1.
Within minor wave 5, minute wave ii may not move beyond the start of minute wave i below 2,070.29.
If this hourly wave count is invalidated by downwards movement, then it may be an outside possibility that intermediate wave (C) is over and truncated. The possibility exists, but because the truncation would be large at 19.42 it has an exceptionally low probability. I mention this only because the next downwards movement is expected to be very strong as a third wave. Look out for surprises to the downside as we near the end of this upwards zigzag.
The structure of minor wave 5 is still incomplete. It is extremely unlikely to be over at the high labelled minute wave i because then minor wave 5 would be truncated and intermediate wave (C) would also be truncated. The probability is very low.
Price may continue to find support about the lower edge of the channel. The S&P does not always fit neatly into channels at the end of its trends though. It has a tendency to form rounding tops and when it does that it breaches the channel yet continues further before a trend change. The best way to identify a trend change is price. At this stage, only a new low below 2,070.29 would indicate a trend change.
ALTERNATE BULL ELLIOTT WAVE COUNT
DAILY CHART
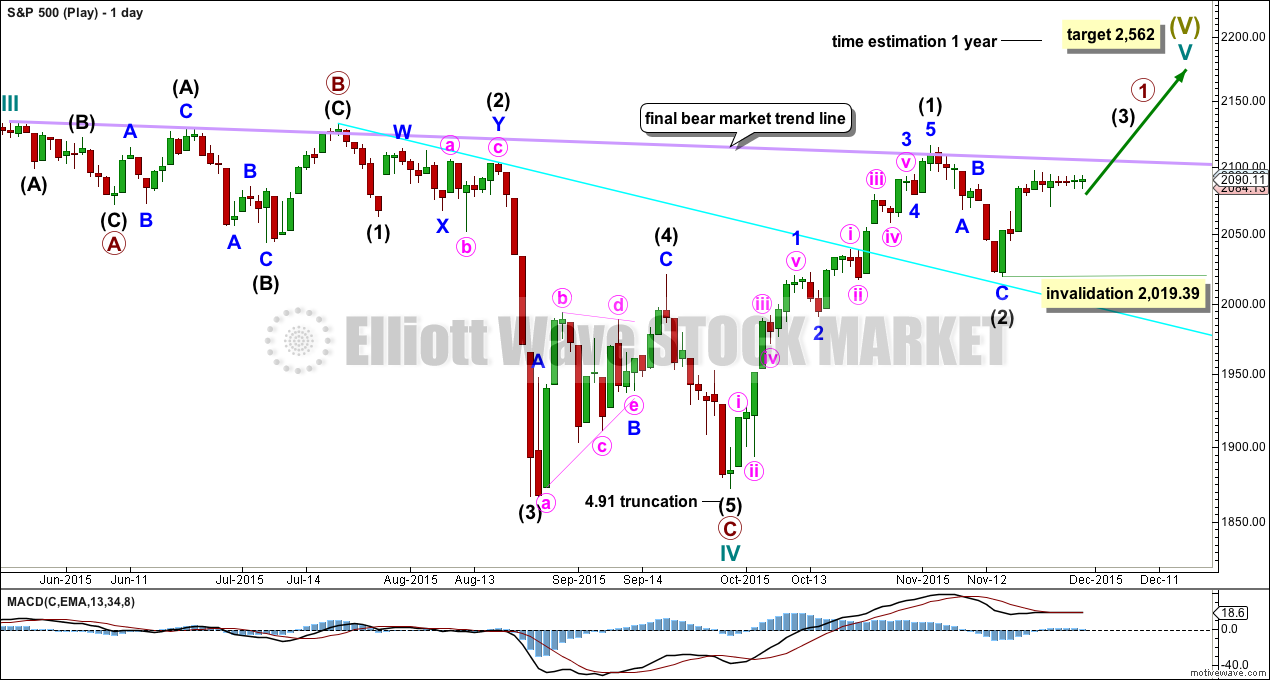
It is possible to see cycle wave IV a completed flat correction. This would provide some structural alternation with the zigzag of cycle wave II.
This is a regular flat but does not have a normal regular flat look. Primary wave C is too long in relation to primary wave A. Primary wave C would be 3.84 short of 4.236 the length of primary wave A. While it is possible to also see cycle wave IV as a complete zigzag (the subdivisions for that idea would be labelled the same as the bear wave count below, daily chart) that would not provide structural alternation with the zigzag of cycle wave II, and so I am not considering it.
This idea requires not only a new high but that the new high must come with a clear five upwards, not a three.
At 2,562 cycle wave V would reach equality in length with cycle wave I. Cycle wave I was just over one year in duration so cycle wave V should be expected to also reach equality in duration. Cycle degree waves should be expected to last about one to several years, so this expectation is reasonable. It would be extremely unlikely for this idea that cycle wave V was close to completion, because it has not lasted nearly long enough for a cycle degree wave.
I added a bear market trend line drawn using the approach outlined by Magee in “Technical Analysis of Stock Trends”. When this lilac line is clearly breached by upwards movement that shall confirm a trend change from bear to bull. The breach must be by a close of 3% or more of market value. If it comes with a clear five up, then this wave count would be further confirmed.
While price remains below the bear market trend line, we should assume the trend remains the same: downwards.
Intermediate wave (1) is a complete five wave impulse and intermediate wave (2) is a complete three wave zigzag. Subdivisions at the hourly chart level would be the same for this wave count as for the other two wave counts; A-B-C of a zigzag subdivides 5-3-5, exactly the same as 1-2-3 of an impulse.
For this wave count, when the next five up is complete that would be intermediate wave (3). Within intermediate wave (3), no second wave correction may move beyond the start of its first wave below 2,019.39.
This wave count does not have support from regular technical analysis and it has a big problem of structure for Elliott wave analysis. I do not have confidence in this wave count. It is presented as a “what if?” to consider all possibilities.
BEAR ELLIOTT WAVE COUNT
DAILY CHART
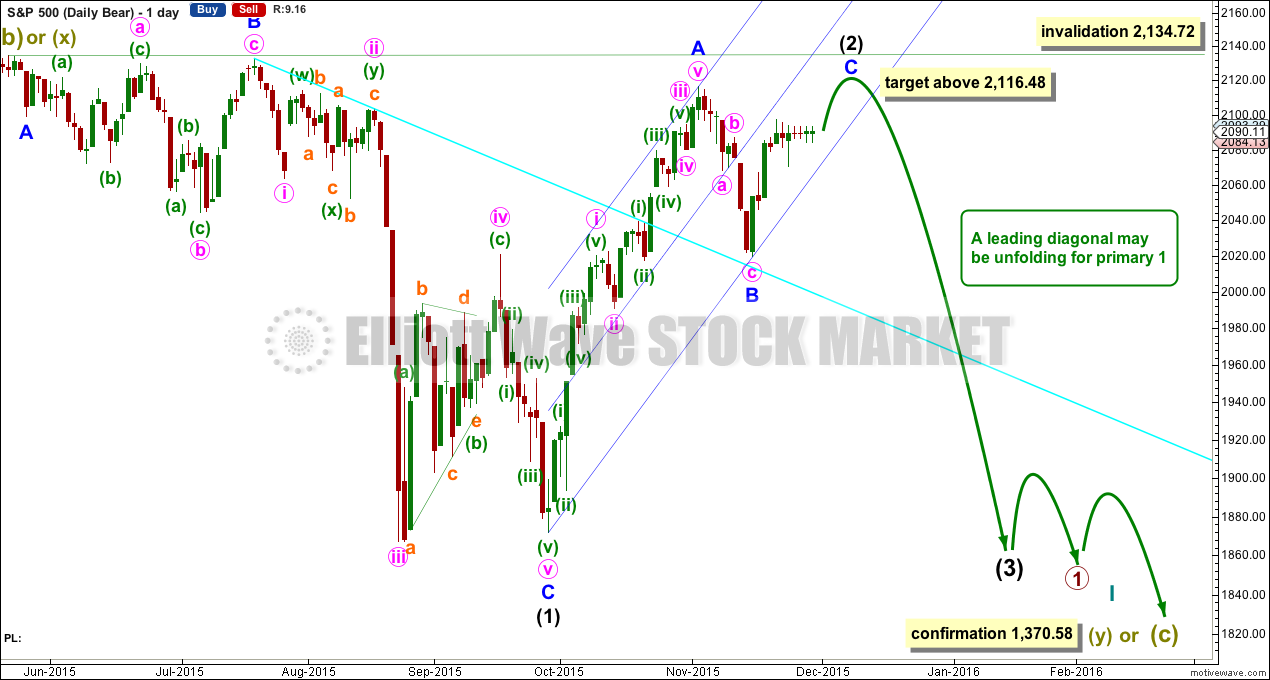
This bear wave count has a better fit at Grand Super Cycle degree and is better supported by regular technical analysis at the monthly chart level. But it is a huge call to make, so I present it second, after a more bullish wave count, and until all other options have been eliminated.
There are two ideas presented in this chart: a huge flat correction or a double flat / double combination. The huge flat is more likely. They more commonly have deep B waves than combinations have deep X waves (in my experience).
A huge flat correction would be labelled super cycle (a)-(b)-(c). It now expects a huge super cycle wave (c) to move substantially below the end of (a) at 666.79. C waves can behave like third waves. This idea expects a devastating bear market, and a huge crash to be much bigger than the last two bear markets on the monthly bear chart.
The second idea is a combination which would be labelled super cycle (w)-(x)-(y). The second structure for super cycle wave (y) would be a huge sideways repeat of super cycle wave (a) for a double flat, or a quicker zigzag for a double combination. It is also possible (least likely) that price could drift sideways in big movements for over 10 years for a huge triangle for super cycle wave (y).
The bear wave count sees a leading diagonal for a primary degree first wave unfolding. Within leading diagonals, the first, third and fifth waves are most commonly zigzags but sometimes may appear to be impulses. Here intermediate wave (1) is seen as a complete zigzag.
Intermediate wave (2) is an incomplete zigzag within the leading diagonal. It may not move beyond the start of intermediate wave (1) above 2,134.72. This wave count expects minor wave C to end midway within its channel, above the end of minor wave A at 2,116.48 but not above 2,134.72.
HOURLY CHART
This hourly wave count is again the same as the first, except for the degree of labelling.
TECHNICAL ANALYSIS
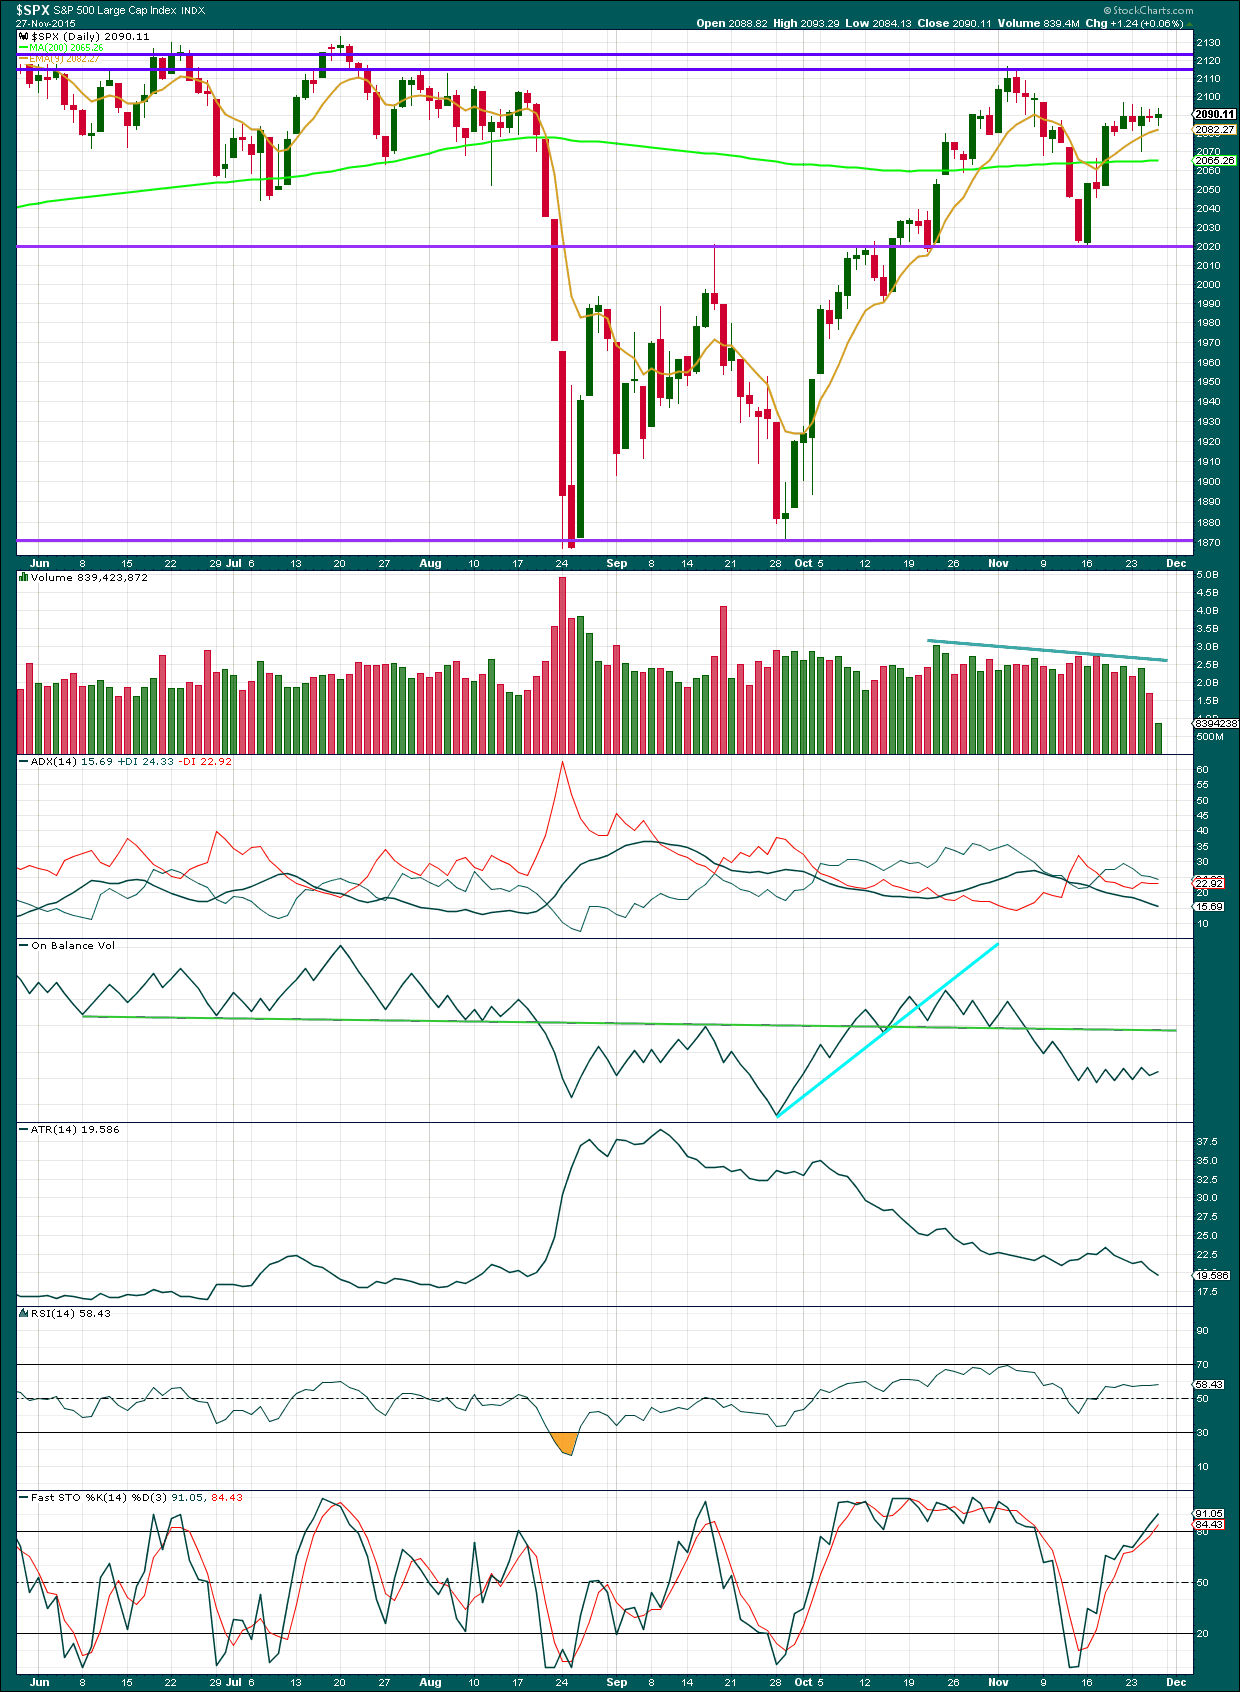
Click chart to enlarge. Chart courtesy of StockCharts.com.
Daily: Price has drifted sideways in a small consolidation on declining volume. ADX indicates the market is not trending, so the upwards swing may be expected to continue until Stochastics is overbought and price reaches resistance.
So far Stochastics is overbought, but price has not yet reached either of the upper horizontal lines of resistance. More upwards movement may be expected until price finds resistance.
Currently, the 9 day EMA looks to be providing some resistance. But with price not trending, it should be expected that price will whipsaw about moving averages.
A note on Dow Theory: for the bear wave count I would wait for Dow Theory to confirm a huge market crash. So far the industrials and the transportation indices have made new major swing lows, but the S&P500 and Nasdaq have not.
S&P500: 1,820.66
Nasdaq: 4,116.60
DJT: 7,700.49 – this price point was breached.
DJIA: 15,855.12 – this price point was breached.
To the upside, for Dow Theory, I am watching each index carefully. If any make new all time highs, that will be noted. If they all make new all time highs, then a continuation of a bull market would be confirmed. So far none have made new all time highs.
This analysis is published about 7:03 p.m. EST.

ES FUTURES at 2090…
What a great BEAR TRAP…
AT THIS RATE TOMORROW WE GAP UP…
LESSON OF THE DAY – WAIT FOR CONFIRMATION OF A BREAK DOWN… 🙂
NO JINX…
As an aside, I think the ongoing divergence with the transports index is noteworthy. The index failed to even “kiss” the underside and now appears to be pealing away from the 200 day MA with a nice fat red candle printed today. For the ETF that tracks the index (IYT), it was a big fat bearish engulfing candle. Looks like we will see that spike tomorrow and if it does, on all my longs…I AM TAKING THE MONEY AND RUN! …running for dear life… there’s a storm a’comin’ 😀
vernecarty,
When you say spike you mean SPX final target of 2118+?
Check out SOX. That is also a leading indicator
Of all the US indices the transportations are the most bearish. It’s the only one also which has made a major new swing low (I have that at 7,700.49, it was the low for 15th October 2014).
I agree. Bearish engulfing candlesticks, failure to break above resistance at the 200 day MA. Very bearish.
FUTURES PUSHING HIGHER – 2083 CASH PRINT AS OF NOW…. SO…. NEW MONTH – NEW MONEY! BULLISH!!!!
UP UP AND AWAY – ES FUTURES
UP UP AND AWAY – NAS FUTURES
BREAK OUT…??
ES Futures on a rip…
Welcome to the new week everybody.
For a quick update before markets close see my comment in response to vernecarty below.
The wave count will be changed slightly at the hourly chart level to see a fourth wave triangle drifting sideways for minor wave 4 (minute iv for the hourly bear).
The triangle invalidation point will be the same as on the hourly charts; 2,070.29.
But the final invalidation point on the hourly charts will be 2,063.66; if this morphs into a combination then it can’t move into first wave price territory. It’s absolutely essential when you think a triangle is unfolding to consider a combination alongside the idea.
A little more down from here to complete wave C of the triangle… then a little up for D… then a little down for E. In short, more sideways movement in a narrowing range probably for at least another day if not up to three.
Triangles exist to take up time, move price sideways and test our patience. They do the latter rather well.
Awesome! Thanks for the update!
Thanks Lara!
This action looking increasingly less like a continuing second wave and it is certainly not behaving like a third. If it is not a second and not a third then what??! I think is again looking like some sort of triangle and these are common just before the final wave in a movement. Is some kind of leading diagonal down also a possibility??
There is something strange about the lack of direction, as if everyone is waiting…
Draghi on wed and the report Friday!
Maybe that is the holdup…nobody wants to commit until the banksters give their spiel…as if it ultimately mattered. Kind of boring watching the tape so I am off to do something productive…not that making money in the markets is not!!! 😀
It looks like a fourth wave triangle. I think that minor 4 is actually not over, and this sideways drift is a triangle for minor wave 4.
MACD is flat and just above zero on the hourly chart. That supports a triangle unfolding.
The wave count at the hourly chart level will be changed slightly to see a triangle. The invalidation point has to be moved back down to the high of minor 1 at 2,066.69 to allow for the possibility that this will morph into a combination. Too many times I have expected a triangle was unfolding only to see the triangle invalidated at the last minute and the structure turn out to be a combination. But both of those are sideways moves, so no significant downwards movement would be expected at this stage for either.
This means that the channel on the hourly chart won’t be useful, I’ll remove it. I’ll use the channel on the daily chart and copy it over to the hourly. Look for support at the lower edge.
It also means that the final target cannot be properly calculated until the end of minor 4 is known. Which may not be for another day or two.
For now the final target will be expected to be above 2,116.48 but below 2,134.72.
If the triangle holds then when it is done a short sharp spike up for a fifth wave should end this thing.
Yep yep Yep!
vernecarty
what is your take on the price action so far?
BEARISH YET?
I have BEEN bearish for quite some time to tell you the truth. What do I think is going to happen? There will be one day of a huge spike up in the indices in response to some drivel from the banksters and the market will just as quickly head in the opposite direction with a vengeance. I suspect this is the calm before the storm and we should be back to 500 point swings soon. Of course I could be completely mistaken, but that is my take matey…. 😀 😀 😀
Come on – lets MELT UP THESE US INDICES ALREADY….
Sitting on the Daily middle BB
That is right- SUPPORT. CLASSIC OLD HEAD FAKE TRICK…
John
you in the UK or the states?
Mostly people in UK use the investing.com for CFDs…
oh man
BOUNCING IT OFF OF SUPPORT!!!! GOT TO SEE WHAT HAPPENS HERE….
Testing support
john
what charting tool do you use?
Investing.com for futures (I won’t post the link , I could take a few hours B4 Lara OKs it)
I also use Wordens TC2000
I know. Sorry!
Time zone differences
uh oh Danger at the days lows….
SUPPORT STILL HOLDING…..
The monthly close – candle. I wouldn’t be surprised to see some WINDOW Dressing at the CLOSE -> UP . BULLISH PROBABLY…
SPX Double bottom on 5min….
We are clearly not in a third wave up at this point so for the bear wave count minuette two must be extending. It really should end soon and a third up begin for that count to remain viable. I am maintaining my upside hedges for now…
I think we should be by close of today or tomorrow to the upside. We got to close around 2093 or 2095+ for a decisive break higher…
These choppy pull backs are nothing more but BEAR TRAPS….
I completely agree. Anyone trying to sell these declines is wasting their time, unless they have a long view as the declines we are seeing are clearly corrective and not impulsive. When this trend starts down there will be no doubt… (loved “don’t speak” by that band) 🙂
DISCIPLINE IS THE WORD OF THE WEEK….
I MUST ALWAYS Trade. Im thinking about opening a paper account to get the fix out.. 🙂
Will this just continue to grind sideways again awaiting the news later this week? FED’s beige book and speech from Yellen on Wednesday; ECB meeting on Thursday (pump more money?)…this might be the last push up to 2116-2134. What do you think?
Cincuenta
Yes, this is the week we should MELT up. If we close Friday above 2122. Then next week it could get dragged into for the FINAL FINAL TOP.
Key level remains 2070.29. The market is behaving like it want to gap down hugely. I agree now is a time to be extremely cautious. Just about everyone is expecting at least one push higher and it ain’t necessarily so…
vernecarty,
Bears are going to bail out and DROP THE BALL. SLOW DRIP UP IN PROGRESS POTENTIALLY….
Not sure about the GAP DOWN but there is hardly any VOLUME out there so this could get really really slow….
RANGE BOUND…
I expect there will be some kind of central bankster blather in the near future to spur the final run up. These announcements often accompany tops. I am keeping some powder dry for what will hopefully be the last pop to the upside. Nothing definitive so far.
wise
hi
all
SPX 15min
I am on the SIDE LINES _ NO NEED TO PARTICIPATE YET….
hi
all
Might be a choppy tight range day. We got to break 2084ish to the downside to head lower 10-15 points. Chicago PMI terrible…I am out…
hi
all
VIX getting clobbered with confirmation MACD cross over down. So, most prices will get crushed. I am definitely not net short here. This is where you loose the most money shorting…
Playing with lines, I don’t think these lines are of any real importance , but it is interesting to see the minor lines that exist
The other HR ES
John
Watch the range – I am not jumping the gun here. Waiting for a decisive break either way – short term – UP or DOWN..
VERY UNCERTAIN LEVELS HERE… ANYTHING CAN HAPPEN HERE….ANYTHING. STAY ALERT!
There is some breaking news about Russia , Don’t know if it is BS……It was on twitter posted by some well known traders
That jet looks like a transformer. Pretty nice engineering…
Not sure why the landing gear is still enabled on this pic…
Payload may be limiting retraction…
Erdogan is not nearly as clever as I thought he was. He probably got talked into the lunacy of downing that Russian jet by American operatives trying to provoke Putin who happens to be a whole lot smarter than these guys. Not only has Erdogan cost his economy billions by his one act of incredibly stupidity and recklessness, I predict he will now show himself nothing but a sneaky coward now that the Russians are prepared for him. I hope Putin continues to ignore his bleating about “talking face to face”. I guess he will just show his power by locking up a few more journalists.
What a surprise – bullish is the path of least resistance.. As bearish as all the charts seemed heading into today we again move higher. Don’t fight the tape….IMO
Asia($SSEC) sell off swooned down another -2.5% a total of 2 trading days of -8% and now back above the 50DMA with just -.93% so far today. So net-net-net about -6.5%. Hopefully they can swing it higher…. Thanks PBOC “Plunge Protection Team” –
All losses erased and postive -nice….
Vernecarty
It’s all about the utter most discipline this week.
Vernecarty
Buy the dip showed up – can’t blame them….
Vernecarty
Cash price action and closing print tommorow should give an idea – buy the dip can show up 30 min before cash open 😉
Vernecarty,
Typically this week is bullish as the new month “new money” comes in.
It would be a good surprise to get a small 10-15 point pull back the next few days before we resume higher.
Right now it looks like we are basing at the highs which is why those candles are so small.
vernecarty,
Your views early/end of this upcoming week?
Short or Long in which segment?
Thanks,
Options2014
Hey
Lara,
Great work as usual with precision. I am trying to understand the speculative timing part. When you say “It may end at the end of next week”
Would that date be 12/4/15 or 12/11/15?
Thanks,
Options2014
Minute waves i and ii lasted about 2.5 light volume days, so I am expecting up to another 4 days or so, but I am 80% positioned already for the next move down.
Thanks Ben!
Ben
Before I buy or sell I look at this statement:
Better to be late and right than early and wrong…
I am about 70 % in. Looking for UVXY to hit 25.5 and will enter remaining positions on contingency order
I have been long miners and it is looking like gold is in an ending diagonal. From the look of the chart, this would mean one more bounce before a final low so I am probably going to have to roll my December positions.
vernecarty,
k, so you dont expect we pull back first and then shoot higher on SPX?
Tons of analyst looking for 2070-2060 early this week and then resume higher.
Lets see what the price action is tonight FUTURES session as the monthly CANDLE on the SPX could change and the closing print of 2092+ on the SPX tomorrow does favor higher prices first imo.
vernecarty,
Futures currently in a 1-3 point range. Unless we break 5-10 point range this tape is not going down imo…
Lara has the abc correction for minuette two completed so we should be seeing upwards movement for minuette three. Since minuette one was a pretty strong push higher I was expecting a similar move for minuette three and if it started last Friday, it was surprisingly sluggish- probably due to the low volume (lowest of the year!) of shortened holiday weekend. We may simply get a slow, tortured grind higher for the last three subwaves to complete upwards movement. I would prefer a spike higher in the markets and a spike lower in the VIX to signal a trend change. An outside reversal would also be good to see. The spread on the UVXY 55 December 31 calls is ALREADY ridiculous so these guys know what’s coming. I am trying to get em for half a buck. If I don’t get filled by week-end I am buying at the market, which I generally try to avoid. The move down should be strong whichever count is correct.
Futures pointing slightly lower…
Vernecarty,
I think Friday is the key to this markets direction – The last jobs report. That should mark the reversal no jinx….
I wouldn’t be surprised by an ending diagonal here either.
Ben
I highly doubt it. The narrow sideways price action and longer term view of how bull markets end don’t end like this. I looked at all the major market trend changes and this doesn’t look like it here with 5-6 days grinding sideways. Just saying.
In fact, this whole thing could get dragged on for 2-3 more weeks depending on what happens this week…
To this day I am so amazed on how quick traders and investors can get to try to sell this maniac bull market without good signal indicators in place….
#istudychartsforfun…