A small inside day completes a doji candlestick, which fits the Elliott wave count.
Summary: The trend is still down, but a bear market rally continues and is not done yet. It may end at the end of next week. A new high above 2,116 is expected. The target for this rally to end is now at 2,118. Thereafter, the downwards trend should resume in force. This bear market rally is extremely unlikely to make a new all time high. It is expected to stop before 2,134.72.
To see how each of the bull and bear wave counts fit within a larger time frame see the Grand Supercycle Analysis.
To see last analysis of weekly and monthly charts click here.
If I was asked to pick a winner (which I am reluctant to do) I would say the bear wave count has a higher probability. It is better supported by regular technical analysis at the monthly chart level, it fits the Grand Supercycle analysis better, and it has overall the “right look”.
New updates to this analysis are in bold.
BULL ELLIOTT WAVE COUNT
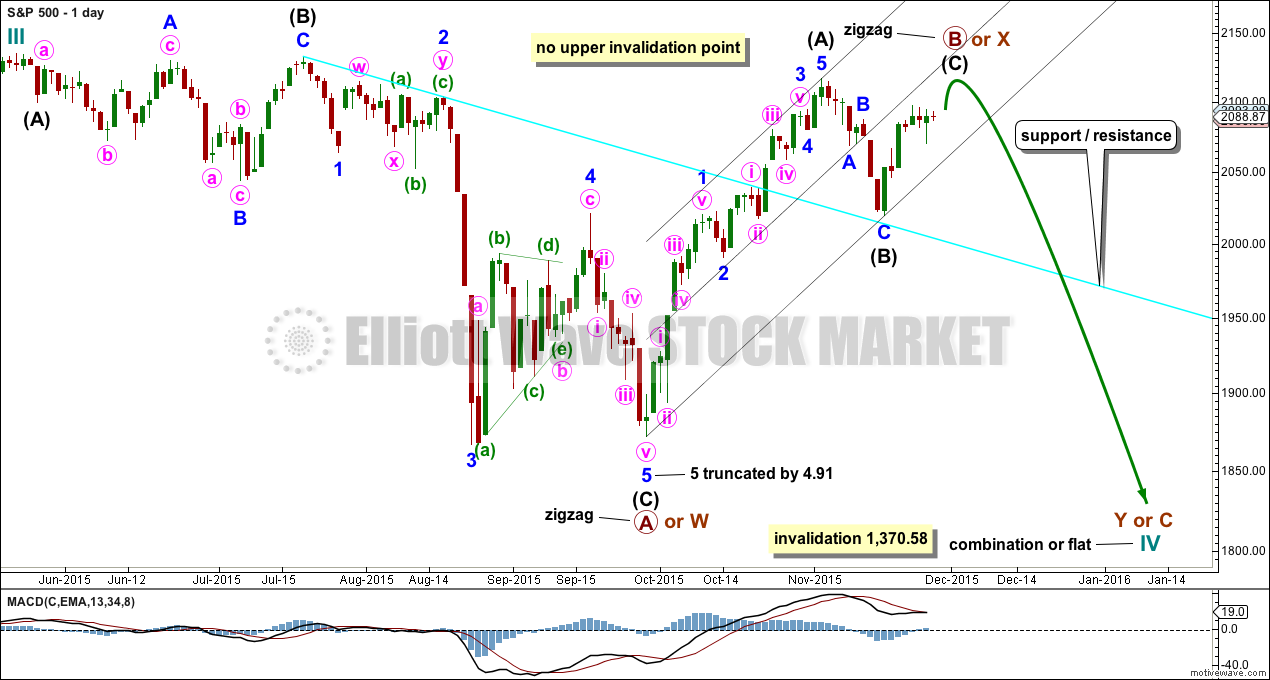
DAILY CHART – COMBINATION OR FLAT
Cycle wave IV should exhibit alternation to cycle wave II.
Cycle wave II was a shallow 0.41 zigzag lasting three months. Cycle wave IV should exhibit alternation in structure and maybe also alternation in depth. Cycle wave IV may end when price comes to touch the lower edge of the teal channel which is drawn about super cycle wave V using Elliott’s technique (see this channel on weekly and monthly charts).
Cycle wave IV may end within the price range of the fourth wave of one lesser degree. Because of the good Fibonacci ratio for primary wave 3 and the perfect subdivisions within it, I am confident that primary wave 4 has its range from 1,730 to 1,647.
If a zigzag is complete at the last major low as labelled, then cycle wave IV may be unfolding as a flat, combination or triangle.
Primary wave B or X is an incomplete zigzag unfolding upwards. If cycle wave IV is an expanded flat correction, then primary wave B may make a new high above the start of primary wave A at 2,134.72. If cycle wave IV is a combination, then primary wave X may make a new high above the start of primary wave W. There is no upper invalidation point for these reasons.
Primary wave A or W lasted three months. When it arrives primary wave Y or C may be expected to also last about three months.
Intermediate waves (A) and (B) together lasted a Fibonacci 34 days within primary wave B or X. So far intermediate wave (C) has lasted seven days. It is unlikely it can complete in a Fibonacci eight. The next number in the sequence is thirteen which would see it continue for a further six days.
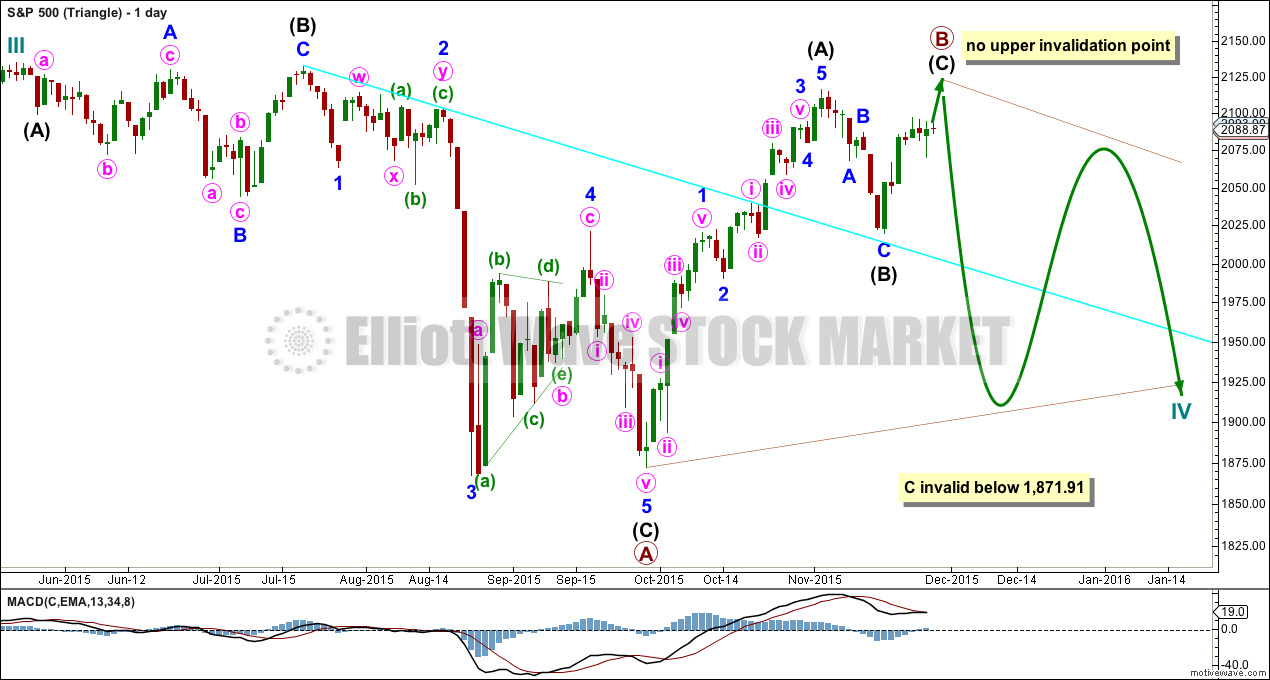
DAILY CHART – TRIANGLE
Cycle wave IV may unfold as a shallow triangle. This would provide alternation with the 0.41 zigzag of cycle wave II.
Primary wave B may be unfolding as a zigzag. Primary wave B may make a new high above the start of primary wave A at 2,134.72 as in a running triangle. There is no upper invalidation point for this wave count for that reason.
The whole structure moves sideways in an ever decreasing range. The purpose of triangles is to take up time and move price sideways. A possible time expectation for this idea may be a total Fibonacci eight or thirteen months, with thirteen more likely. So far cycle wave IV has lasted six months.
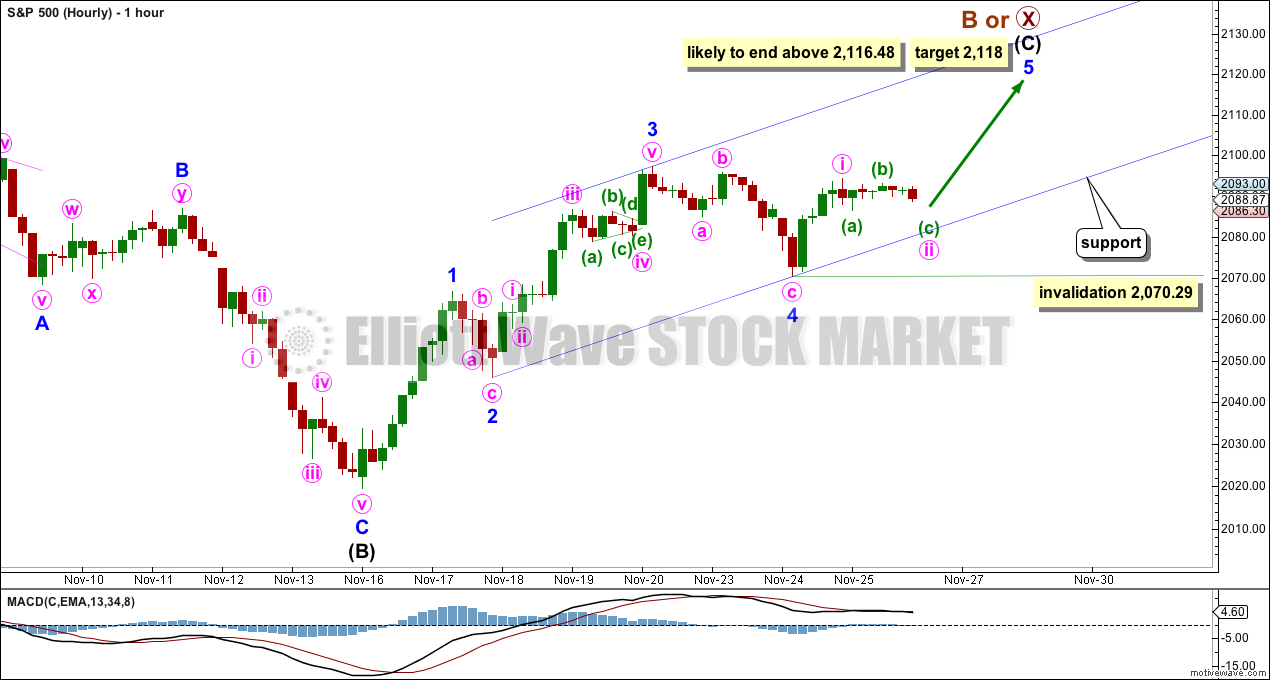
HOURLY CHART
Again, both hourly charts are the same today.
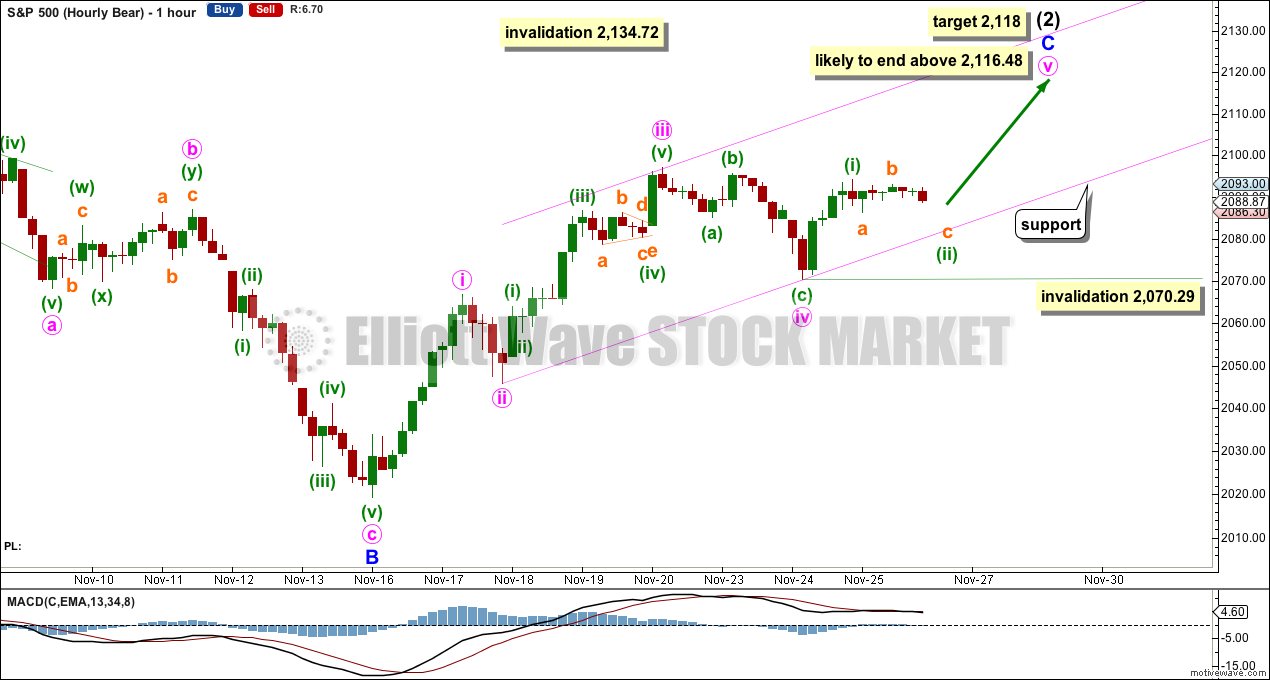
At 2,118 minor wave 5 would reach equality in length with minor wave 1.
Within minor wave 5, minute wave ii may not move beyond the start of minute wave i below 2,070.29.
If this hourly wave count is invalidated by downwards movement, then it may be an outside possibility that intermediate wave (C) is over and truncated. The possibility exists, but because the truncation would be large at 19.42 it has an exceptionally low probability. I mention this only because the next downwards movement is expected to be very strong as a third wave. Look out for surprises to the downside as we near the end of this second wave correction.
Minor wave 5 may come to a slow end due to the US holiday. The structure is still incomplete and still needs more upwards movement. Along the way up, downwards corrections may find support at the lower edge of the Elliott channel.
ALTERNATE BULL ELLIOTT WAVE COUNT
DAILY CHART
It is possible to see cycle wave IV a completed flat correction. This would provide some structural alternation with the zigzag of cycle wave II.
This is a regular flat but does not have a normal regular flat look. Primary wave C is too long in relation to primary wave A. Primary wave C would be 3.84 short of 4.236 the length of primary wave A. While it is possible to also see cycle wave IV as a complete zigzag (the subdivisions for that idea would be labelled the same as the bear wave count below, daily chart) that would not provide structural alternation with the zigzag of cycle wave II, and so I am not considering it.
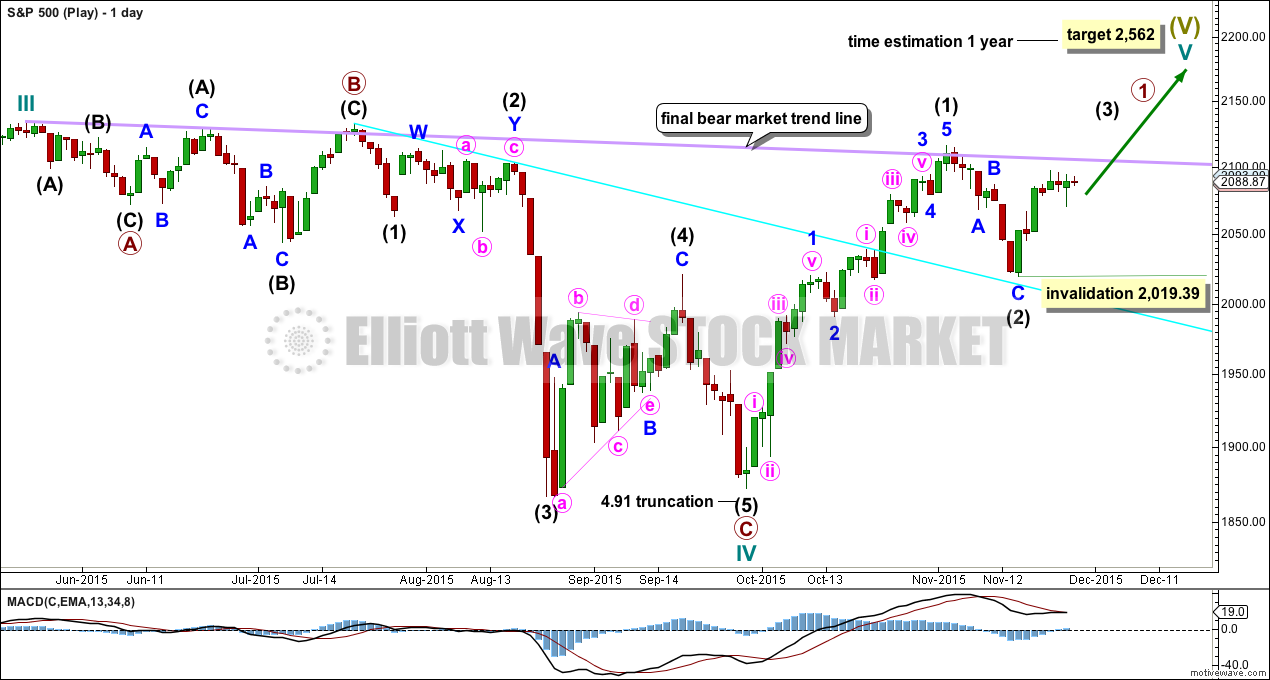
This idea requires not only a new high but that the new high must come with a clear five upwards, not a three.
At 2,562 cycle wave V would reach equality in length with cycle wave I. Cycle wave I was just over one year in duration so cycle wave V should be expected to also reach equality in duration. Cycle degree waves should be expected to last about one to several years, so this expectation is reasonable. It would be extremely unlikely for this idea that cycle wave V was close to completion, because it has not lasted nearly long enough for a cycle degree wave.
I added a bear market trend line drawn using the approach outlined by Magee in “Technical Analysis of Stock Trends”. When this lilac line is clearly breached by upwards movement that shall confirm a trend change from bear to bull. The breach must be by a close of 3% or more of market value. If it comes with a clear five up, then this wave count would be further confirmed.
While price remains below the bear market trend line, we should assume the trend remains the same: downwards.
Intermediate wave (1) is a complete five wave impulse and intermediate wave (2) is a complete three wave zigzag. Subdivisions at the hourly chart level would be the same for this wave count as for the other two wave counts; A-B-C of a zigzag subdivides 5-3-5, exactly the same as 1-2-3 of an impulse.
For this wave count, when the next five up is complete that would be intermediate wave (3). Within intermediate wave (3), no second wave correction may move beyond the start of its first wave below 2,019.39.
This wave count does not have support from regular technical analysis and it has a big problem of structure for Elliott wave analysis. I do not have confidence in this wave count. It is presented as a “what if?” to consider all possibilities.
BEAR ELLIOTT WAVE COUNT
DAILY CHART
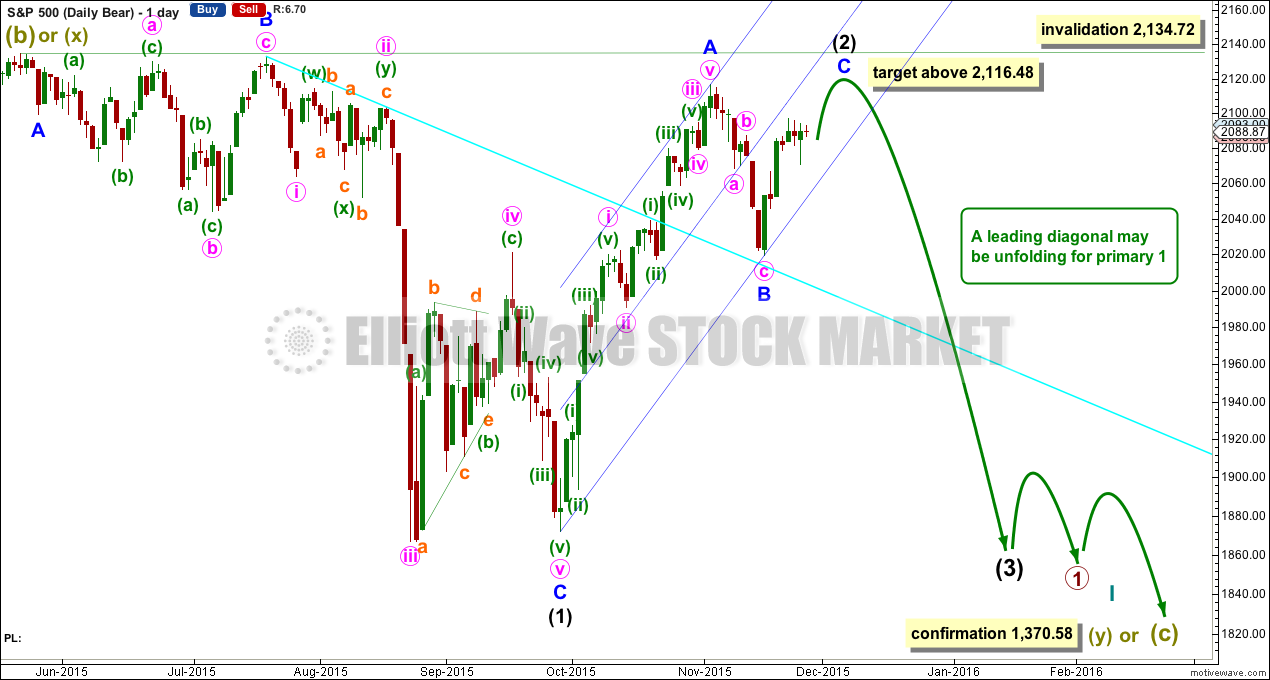
This bear wave count has a better fit at Grand Super Cycle degree and is better supported by regular technical analysis at the monthly chart level. But it is a huge call to make, so I present it second, after a more bullish wave count, and until all other options have been eliminated.
There are two ideas presented in this chart: a huge flat correction or a double flat / double combination. The huge flat is more likely. They more commonly have deep B waves than combinations have deep X waves (in my experience).
A huge flat correction would be labelled super cycle (a)-(b)-(c). It now expects a huge super cycle wave (c) to move substantially below the end of (a) at 666.79. C waves can behave like third waves. This idea expects a devastating bear market, and a huge crash to be much bigger than the last two bear markets on the monthly bear chart.
The second idea is a combination which would be labelled super cycle (w)-(x)-(y). The second structure for super cycle wave (y) would be a huge sideways repeat of super cycle wave (a) for a double flat, or a quicker zigzag for a double combination. It is also possible (least likely) that price could drift sideways in big movements for over 10 years for a huge triangle for super cycle wave (y).
The bear wave count sees a leading diagonal for a primary degree first wave unfolding. Within leading diagonals, the first, third and fifth waves are most commonly zigzags but sometimes may appear to be impulses. Here intermediate wave (1) is seen as a complete zigzag.
Intermediate wave (2) is an incomplete zigzag within the leading diagonal. It may not move beyond the start of intermediate wave (1) above 2,134.72. This wave count expects minor wave C to end midway within its channel, above the end of minor wave A at 2,116.48 but not above 2,134.72.
HOURLY CHART
This hourly wave count is again the same as the first, except for the degree of labelling.
TECHNICAL ANALYSIS
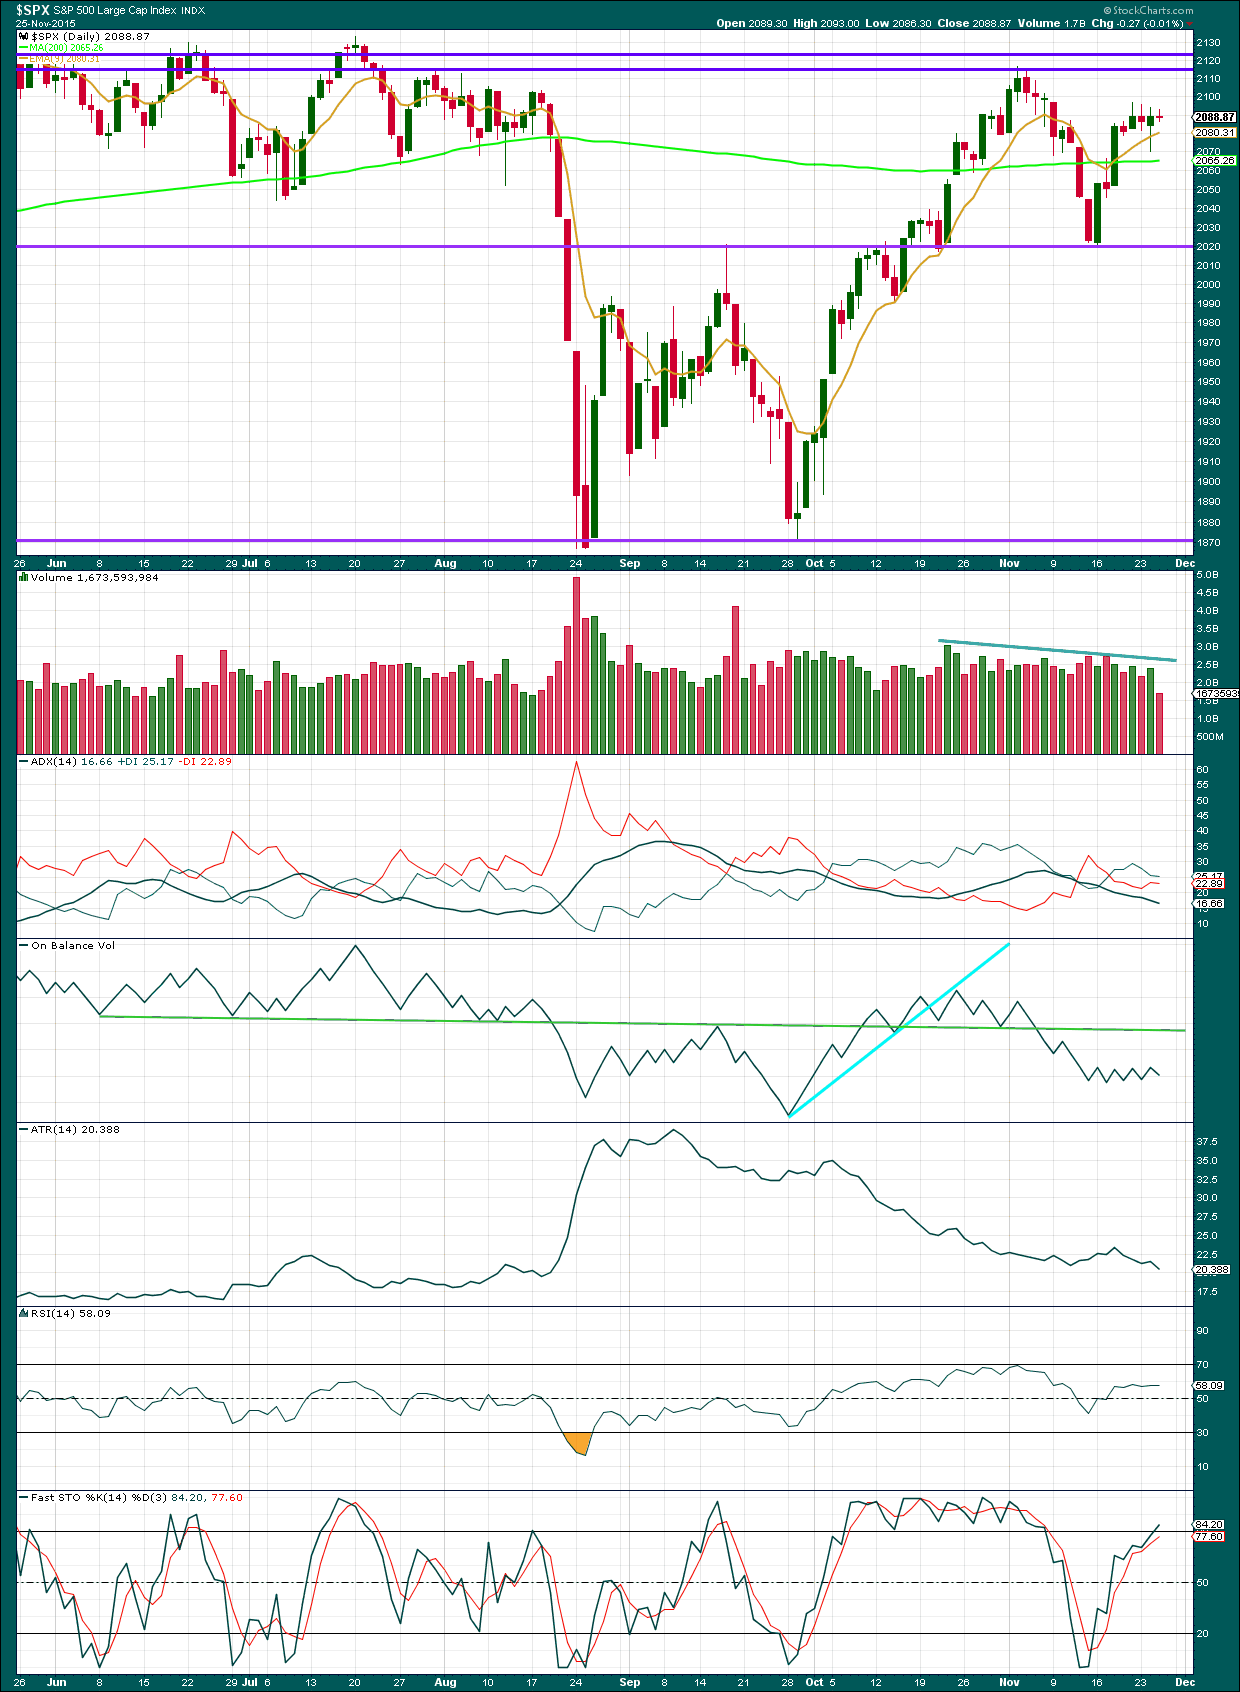
Click chart to enlarge. Chart courtesy of StockCharts.com.
Daily: Price is range bound between the purple horizontal lines of support and resistance. Volume is declining. At this stage, this overall movement looks more like a consolidation than a trend.
ADX agrees and is declining indicating a consolidating market. ATR also agrees and the range price is moving in is declining to flat.
A range bound approach to this market would currently expect some more upwards movement until price reaches resistance and Stochastics reaches overbought at the same time. Stochastics is entering overbought territory, but price has not yet reached resistance.
The first two days of 22nd and 23rd October within this range are upwards days and have strongest volume. This would indicate an upwards breakout from this current range may be more likely than downwards. However, On Balance Volume disagrees: the break of OBV below its green trend line was a leading bearish indicator.
A note on Dow Theory: for the bear wave count I would wait for Dow Theory to confirm a huge market crash. So far the industrials and the transportation indices have made new major swing lows, but the S&P500 and Nasdaq have not.
S&P500: 1,820.66
Nasdaq: 4,116.60
DJT: 7,700.49 – this price point was breached.
DJIA: 15,855.12 – this price point was breached.
To the upside, for Dow Theory, I am watching each index carefully. If any make new all time highs, that will be noted. If they all make new all time highs, then a continuation of a bull market would be confirmed. So far none have made new all time highs.
This analysis is published about 7:06 p.m. EST.

Hi
all,
A quote I want to share with everyone ….
Be aggressive at high probability moments, but risk small amounts to make big profits. -Paul Tudor Jones
I’ll be updating the analysis and preparing a video for you all later today.
Not much has changed, but NY did trade a few hours on Friday. So that needs to be updated.
I hope all members in the USA had a fabulous Thanksgiving!
Tony CaldaroSPX PW5 target 2214 -2219 ………Holy smokes !
If correct….it means it will break through the upper channel line or slowly rise till 2017
John
I have checked Tony’s work. It really isn’t that reliable to be honest. He is retired and does this for fun and his counts keep changing day by day so not really accurate imo…
I am wrong, he has it up in the 2500s ……….
Groan
Lara, What do you make of this?!
Well it’s possible in the sense that anything is possible.
My response would be to take a look at my analysis of monthly charts. I’m not expecting a new all time high at this stage because those charts are still very bearish.
hi
All,
Have an awesome weekend. I will try not to look at charts 🙂
That’s all she wrote. SPY 210 calls will expire worthless. Bought back 209.5 puts for small gain. Have a great week-end everyone and finish up that Turkey…or feed it to Fido….Bye’….
Sneaky little devil; looks like it was indeed a small degree second wave. Will it pop into the close as originally expected??!!
The price action is moving up. It could be early next week – Mon-Wed…
hi
All,
BULLISH!!!!!
cheers…
Round number resistance at 2010 in play. That third wave up is starting to look a bit tardy, and may even be a no-show….
bullish
hi
All,
Only 1 hour left of trading…
Holiday tape is usually BULLISH!!!!!
cheers…
Proprietary market signal issued for at least 2010.00 today. Calls should go in the money shortly.
vernecarty
nice.. lets see that play out 🙂
Proprietary market signal? you mean your trading style?
I get a signal for block purchases that can show up ahead of the tape…any good live streaming quotes service can provide it… 😀
Not looking good. We should be blasting higher not turning downward. If this is a small degree second wave it needs to reverse immediately. If we take out this morning’s lows a fifth wave truncation will have my vote…
vernecarty
I am bullish no volume to push it lower so…..no reason to get bearish yet….
Sideways
Setting up for a down Monday
Long term
John,
I don’t know. Big call to make.
I agree. I would not want to be long over the week-end. I still think we are going to see a big move and since it did not happen today to the upside as called for by the wave counts, odds probably lower that it will happen next week. On the sidelines for now until picture clarifies somewhat.
why would you want to be out of the market when it is grinding higher?
The “grind” is a bit less than enthusiastic don’t you think? Very anaemic candles the last few days as well as this trading session. I think we are setting up for a monster gap to the downside.
I agree about the candles. When are you looking for the downside Mon-Tue or Wed? I like to see it later in the week to make the Weekly candle stick out…
John,
Down Monday – your point level?
Setting up down but no initial target???
Channel resistance
VIX : No fear
I think traders got Russia/Turkey and Thanksgiving/Turkey all mixed up
Actually no pro traders at all this week 🙂 most of them off.
I smoked my Turkey; China seems to think Russia will do the same… 😀
China only matter when it matters. When they sky rocketed we couldn’t and just like OIL we didn’t come crashing down until it dropped -55% So… till Monday..
I had never heard of this before ,but a friend tried to deep fry a turkey, almost burnt down his house
MACD 5-15min cross over up – no reason to go down…
Sooo… are you long into the week-end, pray tell?
ahhh. I dont always have to trade. So in this case NO.
I was long several times today – can’t ask for more. Greed is not good…I read that somewhere…
I moved minute ((ii)) right and I think that it is an opportunity to deal long.
I think you are right on the money…
vernecarty
Elaborate further on “right on the money” ?
I think wave two did just moved lower.
Speaking of seasonal bias, they will probably report lack-luster sales for black Friday over the week-end with corresponding market reaction next week…
So – lack luster sales – BEARISH outlook now?
Are you bullish or bearish now?
I am flexible and will take what the market gives me…
I think we are very close to the end of upwards movement. According to the wave count, we need a third wave up for minuette three, a small correction for minuette four, and a final wave up for minuette five to end BELOW 2134.72
After that, down we go…big time…
vernecarty
I agree – but the waves in the waves are tricky. Let us see – how the day ends…
Slight breach of the uptrend channel. Either it turns around here or we head towards 2070 in a hurry…
Long lower shadow at 2084 so that’s probably it. We will probably close in the green today….
Yep…they were messin’ with the bears this morning. OK, let’s get past 2100 so I can cash in those SPY calls and that bullish put spread… thank you!
We SHOULD see a strong spike higher into the close…
Vernecarty,
Why should we see that STRONG spike at the close? Technically, the market shouldn’t do anything – just saying matey…
I assume you are following the market analysis provided by Lara. It calls for a third wave up…
vernecarty
I am but things are chopping around. Getting unstable out there – see my point?
I do. That’s why a trading plan with clearly defined stops is so important. I too had itchy fingers this morning but decided to sit tight and let the market commit…
vernecarty
The market has voted – BULLISH!
vernecarty
The stops with options is so small.
for example I buy to open : 2.50
What is my stop 2.45 before it spikes to 2.70? With this fast market it can whipsaw you – see my point?
Tricky stops with options.
vernecarty,
Up – down 1-4 points – no volume. They had every chance to take it 2100 this week and they couldn’t and now next week is seasonally bearish… “media stocks” getting crushed again now – that is what happened last time before we sold off… just saying…
Sit tight matey; remember the market’s job is to keep everyone guessing and off-balance. This is where Lara’s analysis is so invaluable as it helps to allow us to filter out the noise and key in on the important inflection points. The head-fake this morning was probably the end of minuette two.
We could still see an outside reversal day after the spike higher…stand by…
Thanks vernecarty…
NDX down 20 points since the spike of this morning…. just saying..
Thanks vernecarty…
TIME TO GO LONG-
SPX and NDX holding up now…
PHEW….
NDX HAMMER
aa
Avner,
Are you looking for the market to head lower? If so, what is your SPX target now?
Short-term long destination exactly according to Lara, only futures this less than 10 points.
Avner,
O.k, thanks Aver…
Avner,
What is your view based on the SPX close?
Thanks,
Options2014
Lara,
Would you like this building is a combination is correct ? (in yellow)
Avner.
Futures indicating massive central banks infusion in attempt to combat contagion from the debacle (not so unpredictable) in China where the government has been using intimidation and huge liquidity injections to try and keep the market afloat. What most folk don’t know about the so-called “China miracle” (despite their well-known reserves), is that their total debt to GDP is the largest by far in the global economy, around 100 times! China 3x bear fund (YANG) probably headed back to around 150 before this is done. Last blood-bath in China was an early signal for what was about to happen in US markets. Batten down the hatches…
vernecarty
what about wave 5? where do we stand with that?
what is your bottom line in the sand target SPX?
CB only intervene when there is total chaos. They did keep China up for a little bit but it only lasted a few weeks. So, it is what it is. They are just doing there job good!
Wave count still calling for sharp third wave up and I think odds are we will see one. I am watching the 2070 level to make sure it holds…otherwise we may have to consider a truncation is in play…
vernecar
I am looking at 2050 now…. Just saying…
If it goes to 2050 upward movement is over and it is going to go lot lower…
vernecarty,
Tricky market. Looks choppy – they are holding it in a tight range. Consistent selling and now bouncing it now..
Not worth holding a trade in this tape…
Bearish price action yet not really going anywhere?
vernecarty
HUGE Hammer on 15 min SPX…. The games continue….
Target exactly according to Lara
What you wrote is true… and currently very strong struggle-buyers and sellers on the Pivo expansion 161.8 . See Graph in my last here.
Vernecarty and Avner,
SPX HAMMER AND MACD CROSS OVER –
BULLISH AGAIN —
Hi
All
Asia had a unpredictable issue down big time -5% Shanghai index so let’s monitor the spx close today – things can change very very fast…
Not sure about wave 5 highs given the recent climate now….
Maybe we get a good size pull back ??
No update for Thursday 26th November, NYSE is closed.
Happy Thanksgiving everybody in the USA!
Thanks Lara!
Lara
I am just curious about the NDX 100. Do you think that it is a high probability and most likely to test and pass the year 2000 high of 4816? My guess is yes and then all the indices roll over?
That could drag the S&P(as the 2 sectors of the SPX – Technology and Finance has been leading for 6 years now) near the 2134.72 inflection point…
Laters,
Options2014
A future hints to Pibo’ 8 days anyway … maybe ?
avnerilan,
That is the triangle break out now in the FUTURES session. So, It has been confirmed that we are defenitely moving up. The initial target as posted by Lara is 2118 but it could possibly go higher and it could run 6 more trading days. Today the SPX CASH index is closed in the US so I can take a guess it doesn’t count as 1 day of trading and so that leaves us with tomorrow with only 3 hours which if you ask me hardly counts as a full day of trading so either early next week or late next week for the initial target of 2118. If we breach the 2118 level then it could go slightly higher 2122-2129 even as close to 2134.72…
Attached is yesterdays SPX CASH close. Notice how it landed right on support 2089-2088. Now it is up on the futures session and it hit 2098 at the highs. Which means that it has cleared the significant resistance level 1.
BULLISH!
regards,
Options2014
avnerilan,
Hold on tight as this could be a SHARP move higher. Ultimately – Futures price action is just NOISE unless it is persistent into the CASH OPEN with either direction UP or DOWN. It is all about the CASH INDEX price action, DAILY OPEN, INTRADAY and CLOSING PRINT….
Laters,
Options2014
I didn’t know there are no trademarks in the U.S. today so, obviously, it isn’t will perfect that which concerneth fibo 8 days. trading future contract is conducted as usual and continue today “by the book”. it’s very interesting to use with lara labeling and bundle up on graph future with certain changes.
The problem with futures count compared to the cash is there will be deviation but I don’t think by that much unless there is a large outsized move. I have seen futures just turn around. Take a look at LAST Monday when we hit ES futures 1998 and then the CASH was way(2020 about ~1%) off by the open…
I have traded Futures in the night session for years. However, it is very very hard to hold positions over night unless we have a large move as you can get stopped or wiped out. Either way you are safer trading Futures ONLY during the CASH hours imho. You could get stopped out FAST once Asia and Europe open. It could be a PAIN trade.
Laters,
Options2014….
Laters,
I’m Agree with you wherever you go, all what you’ve written is true and is well known.
thanks,
Avner
Avner,
Thanks, I think this last UP move on the SPX is also waiting for the NDX 100 to complete it final all time high target retest or more. Check out the BULL FLAG on the 60min chart. It has a target of the recent highs of 4737. However,in addition my educated guess is that it has a very very strong potential to surpass it to the year 2000 high of 4816+….
Every retail investor,newbie QE trader is all about F A N G(FACEBOOK, AMAZON, NETFLIX and GOOGLE) Those are the ones responsible for creating this TECH 2.0 bubble…