I have only bear wave counts for FTSE.
Summary: So far I have not been able to find other bull alternatives which fit. Of all the markets I currently analyse, FTSE is the clearest bear. I have two wave counts for FTSE. Both see the all time high as a trend change at cycle degree (the degree may be wrong; it may be super cycle degree).
To see monthly and weekly charts and the bigger picture see last analysis here.
New updates to this analysis are in bold.
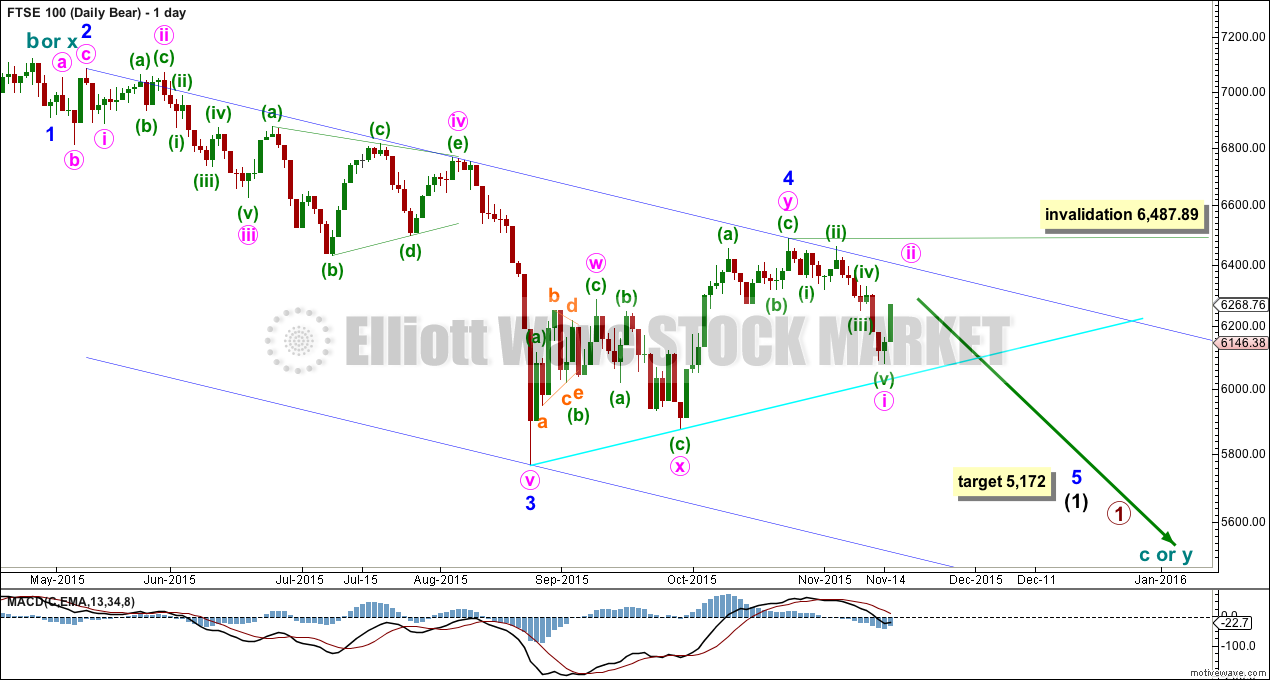
FIRST WAVE COUNT
So far downwards movement may be 1-2-3-4 with a fifth wave needed.
If the next wave down shows a decrease in momentum beyond that seen for minor wave 3, then this first wave count would be preferred. At 5,172 minor wave 5 would reach equality in length with minor wave 3.
The channel is drawn using Elliott’s second technique. In this instance minor wave 5 may find support at the lower edge. Along the way down, upwards corrections against the trend should find resistance at the upper edge. If this wave count is wrong, the first indication would be a breach of the upper edge of the channel.
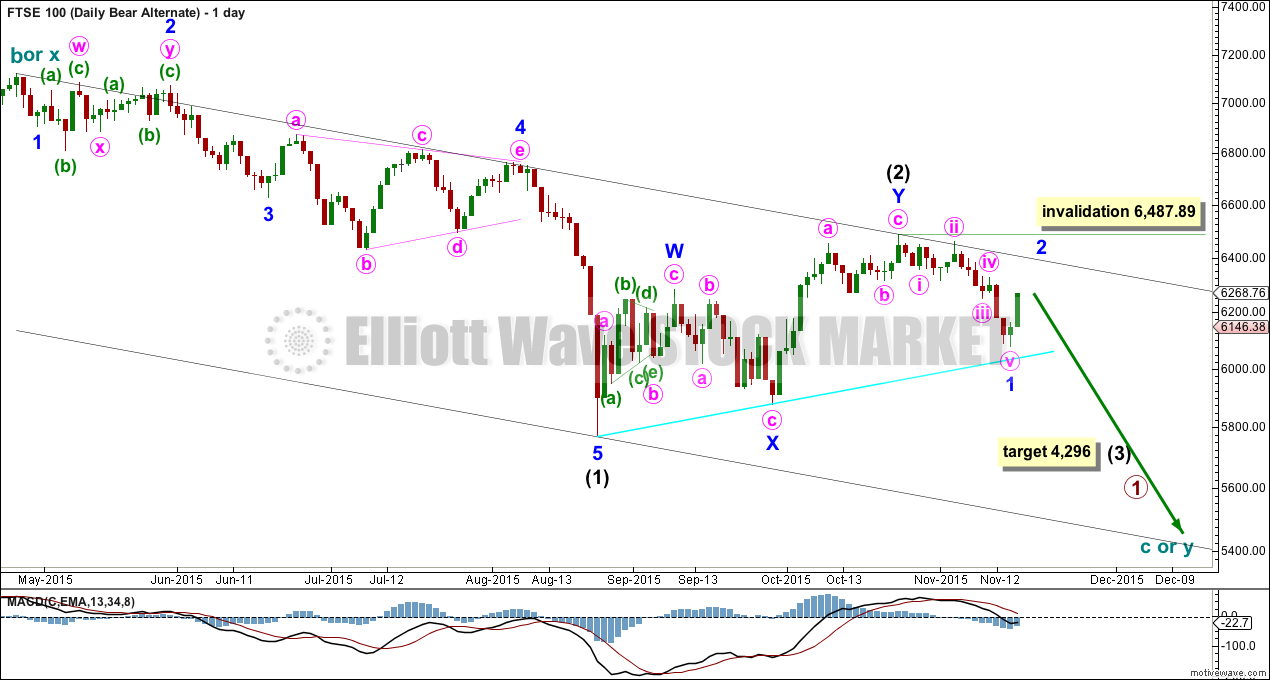
SECOND WAVE COUNT
Thanks to a member, Stuart, for sending this idea to me. The implications are important. The next wave down for FTSE may be a strong third wave.
If the next wave down shows an increase in momentum, then this would be the preferred wave count for FTSE.
At 4,296 intermediate wave (3) would reach 1.618 the length of intermediate wave (1).
Minor wave 2 may not move beyond the start of minor wave 1 above 6,487.89 within intermediate wave (3). Again, if this wave count is wrong, first indication would come with a breach of the upper edge of the black channel. This channel is a base channel about intermediate waves (1) and (2). Along the way down, upwards corrections should find resistance at the upper edge of that channel.
If a third wave down is underway, then it should have the power to break below the lower edge of this base channel. If that happens, this wave count would be strongly preferred over the first wave count. A third wave would be confirmed.
TECHNICAL ANALYSIS
DAILY CHART

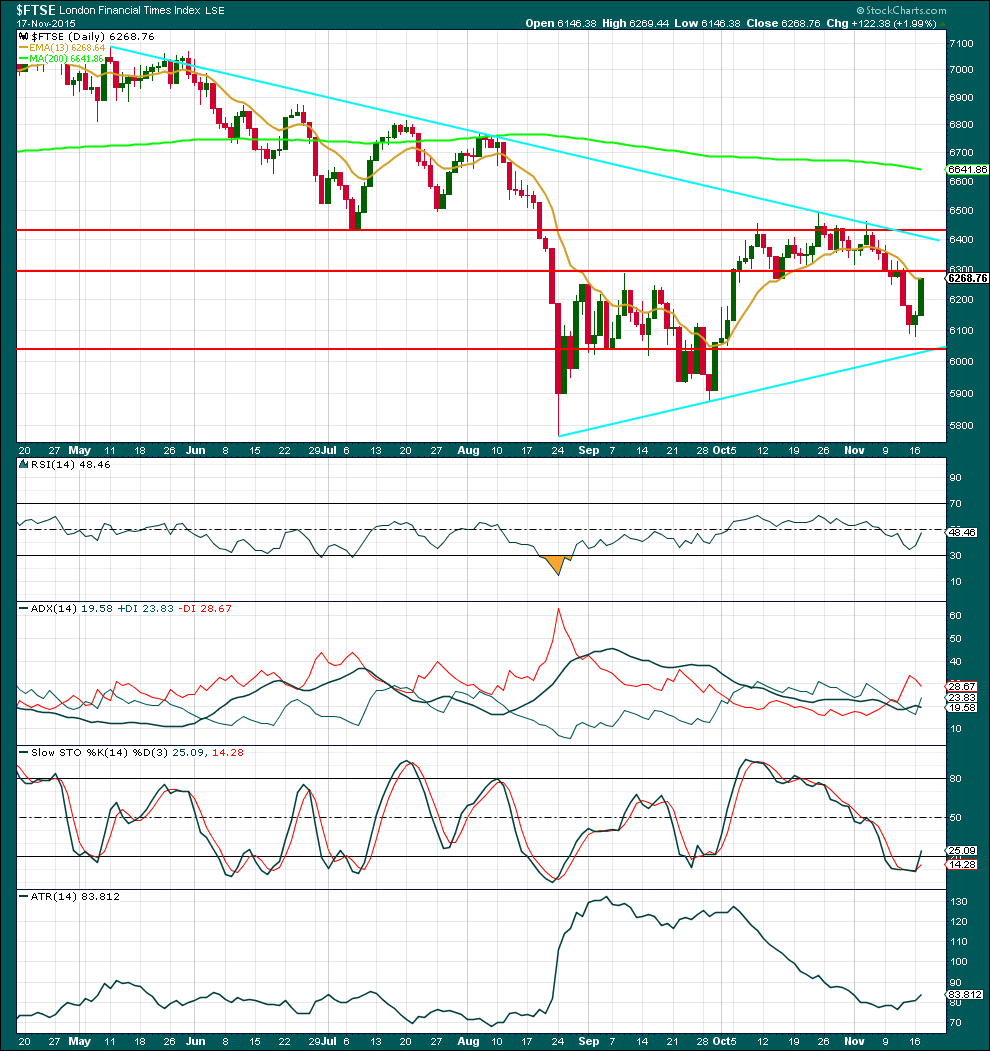
Click chart to enlarge. Chart courtesy of StockCharts.com.
There is no volume data on either the FXCM feed or StockCharts. Volume analysis is done from Yahoo Finance data.
Price has essentially been moving sideways since the low of 24th August. During this time, the downwards day of 18th September has strongest volume which indicates a breakout from this sideways move is more likely to be downwards than upwards.
Overall, ADX is pointing lower. The consolidation is maturing, the trend should resume soon, but for now the breakout has not yet happened.
A new low below the low of 24th August and an increase in volume would add confidence that a downwards breakout is underway.
Prior to that, a break below either the lowest red horizontal trend line or the lower cyan sloping trend line would indicate a breakout if it comes on a downwards day with higher volume.
Price has broken through support at the second horizontal line and is finding support just above the lower horizontal line. A breakout may now be much closer.
ATR is beginning to turn upwards indicating a possible start to a new trend.
This analysis is published about 01:42 a.m. EST.


SORRY!!!!!!!!!!! Posted on the wrong thread
The 200DMA and Lara’s line are still resistance Red dashed line /channel top, is sopport
ES Daily :Here the price is still inside the red channel 2060.10 fib is also resistance
Looks like a battle between the stochastic & the MACD in each time frame which could mean a lot of chop ….it is also options week
Lara’s line at 2061.94 is a brick wall
Thank you kindly for the mention Lara, but feel it’s only fair to point out that the idea of the alternate count was inspired by your original analysis, and further more you’ve taken the idea and turned it into something far more useful/tradable with revised targets and invalidation points. Thank you for the great update!
Also – I’m new to this site, but would like to also use this post to thank all the current members for their comments and contributions to the daily updates – notably John for regularly posting the additonal charts and vernecarty for the insights/analysis and trading ideas. Thanks to all for making this a great trading and EW community!
Stuart
Thanks Stuart!
Thanks Stuart
As the membership here grows this site is turning into more than just a daily EW analysis service. The kind sharing of members, particularly vernecarty and John, is turning this into a place where we can all learn more TA and help each other be better traders. And make more money!