
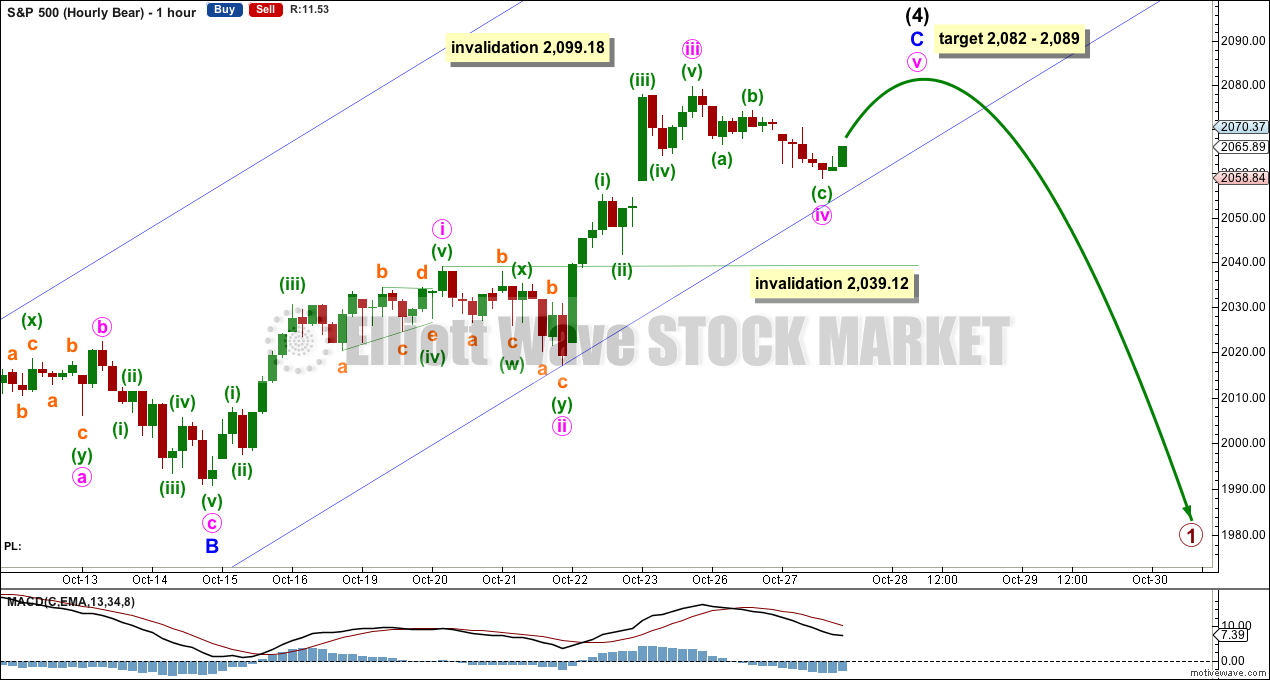
The fourth wave correction continued a little lower to complete a small red doji with a long lower shadow.
Summary: A short brief fifth wave upwards to the target at 2,082 – 2,089 would complete this entire structure for a bear market rally. If the target is met tomorrow, then the rally would have lasted a Fibonacci 21 days, and so give or take a day either side of this expectation would be reasonable.
To see how each of the bull and bear wave counts fit within a larger time frame see the Grand Supercycle Analysis.
To see last analysis of weekly and monthly charts go here.
If I was asked to pick a winner (which I am reluctant to do) I would say the bear wave count has a higher probability. It is better supported by regular technical analysis at the monthly chart level, it fits the Grand Supercycle analysis better, and it has overall the “right look”.
New updates to this analysis are in bold.
BULL ELLIOTT WAVE COUNT
DAILY CHART – COMBINATION
Click chart to enlarge.
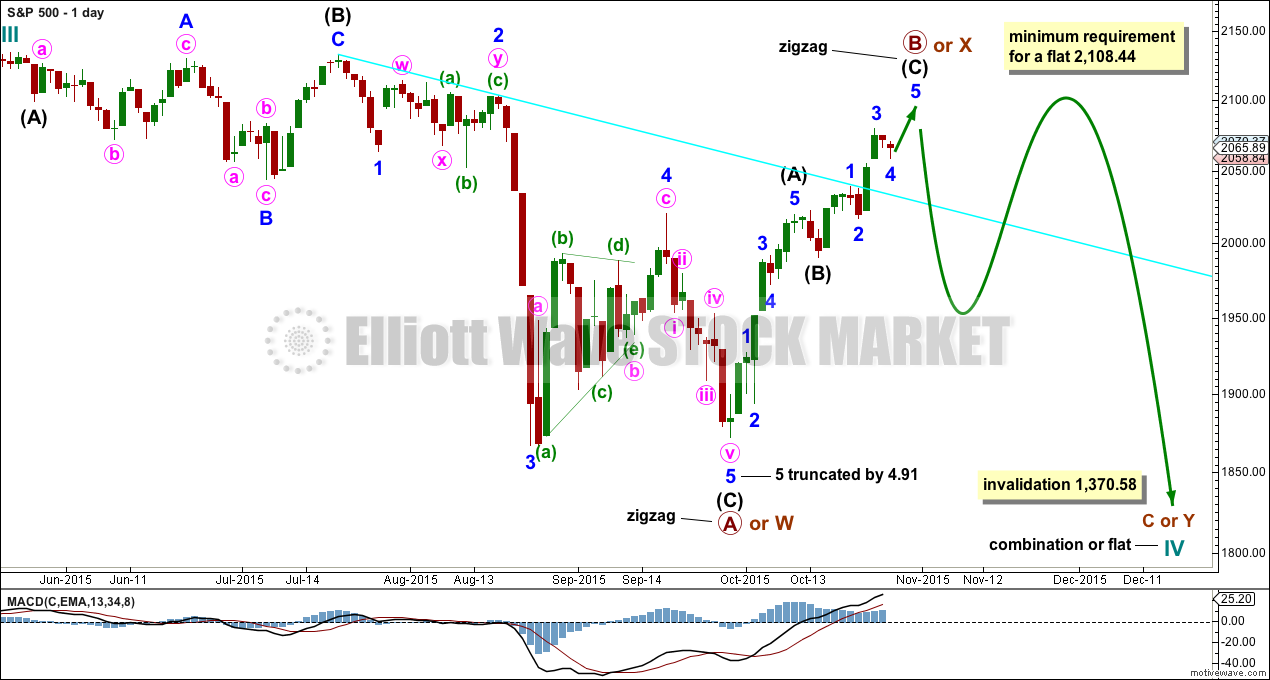
Cycle wave IV should exhibit alternation to cycle wave II.
Cycle wave II was a shallow 0.41 zigzag lasting three months. Cycle wave IV should exhibit alternation in structure and maybe also alternation in depth. Cycle wave IV may end when price comes to touch the lower edge of the teal channel which is drawn about super cycle wave V using Elliott’s technique (see this channel on weekly and monthly charts).
Cycle wave IV is likely to end within the price range of the fourth wave of one lesser degree. Because of the good Fibonacci ratio for primary wave 3 and the perfect subdivisions within it, I am confident that primary wave 4 has its range from 1,730 to 1,647.
If a zigzag is complete at the last major low as labelled, then cycle wave IV may be unfolding as a flat, combination or triangle.
Primary wave B or X upwards is continuing, most likely as a single zigzag. If upwards movement reaches to 2,108.44 or above, then cycle wave IV may be unfolding as a flat correction. At that point, primary wave B would meet the minimum length of 90% the length of primary wave A. If upwards movement does not meet the minimum requirement for a flat correction, then cycle wave IV may be a combination or triangle.
Primary wave B within a flat correction may make a new high above the start of primary wave A at 2,134.72 as in an expanded flat. There is no upper invalidation point for this wave count for that reason. Likewise, X waves within combinations may also move beyond the start of the first structure labelled primary wave W. There is no minimum or maximum length for an X wave within a combination.
DAILY CHART – TRIANGLE
Click chart to enlarge.
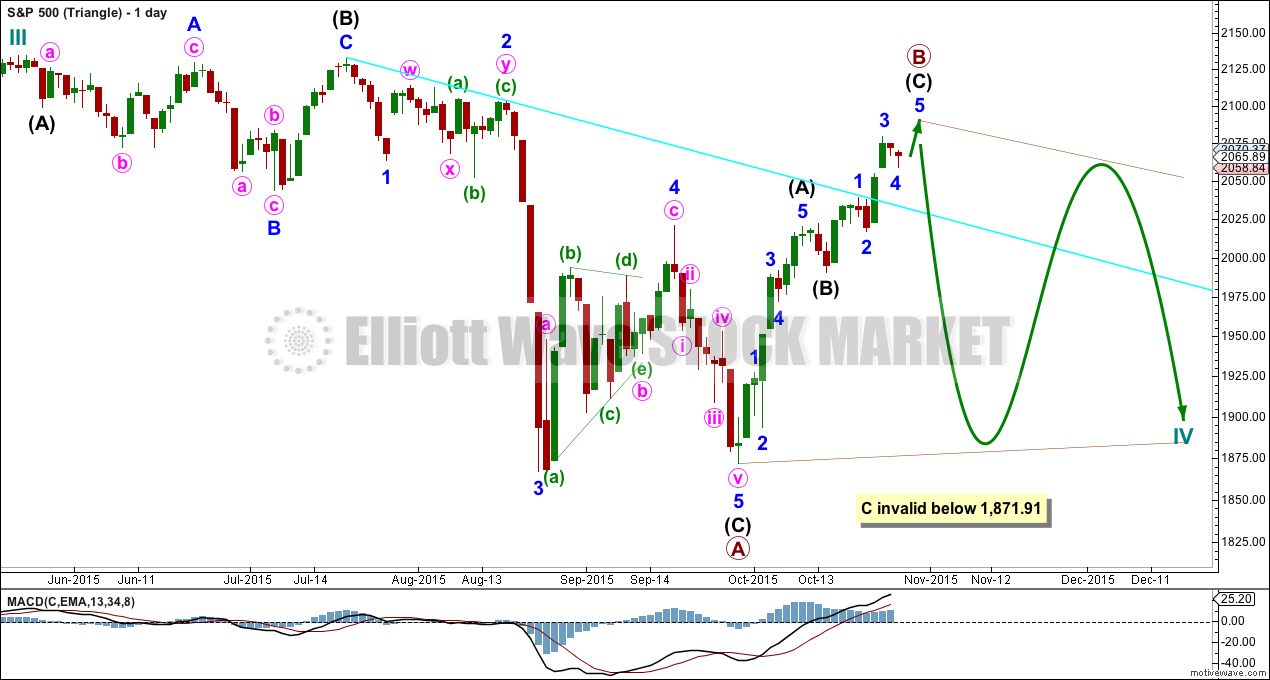
Cycle wave IV may unfold as a shallow triangle. This would provide alternation with the 0.41 zigzag of cycle wave II.
Primary wave B may be unfolding as a zigzag.
Primary wave B may move beyond the start of primary wave A at 2,134.72 as in a running triangle. There is no upper invalidation point for this wave count for that reason.
Primary wave C of a barrier or contracting triangle may not move beyond the end of primary wave A at 1,871.91.
The whole structure moves sideways in an ever decreasing range. The purpose of triangles is to take up time and move price sideways.
The hourly chart below works in exactly the same way for both of these daily charts, and so only one hourly chart for these two ideas will be presented today.
HOURLY CHART
Click chart to enlarge.
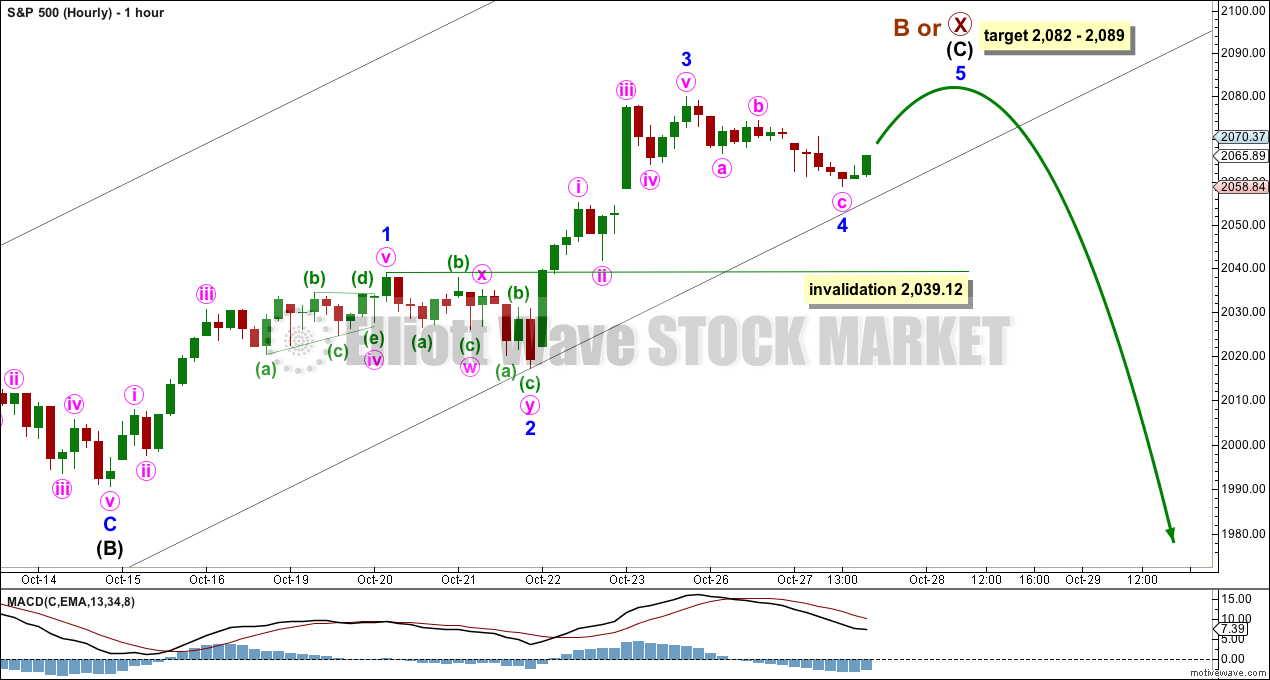
Minor wave 4 did not complete as a triangle. It looks like it may be a single or double zigzag. There is some alternation between minor waves 2 and 4: minor wave 2 was a 0.45 double combination and minor wave 4 is a slightly more shallow 0.33 single or double zigzag.
There is no Fibonacci ratio between minor waves 1 and 3. This makes it more likely that minor wave 5 shall exhibit a Fibonacci ratio to either of 1 or 3. At 2,089 minor wave 5 would reach 0.618 the length of minor wave 1. This is somewhat close to 2,082 where intermediate wave (C) would reach 0.618 the length of intermediate wave (A). I favour the upper edge of this target zone because it is calculated at a lower wave degree.
When the best fit channel about primary wave B or X is clearly breached by downwards movement that shall provide earliest confirmation of a trend change.
If minor wave 4 continues any further, it may not move into minor wave 1 price territory below 2,039.12.
At this stage, a new low below 2,039.12 (if this happens before a new high) would indicate the entire structure for primary wave B or X should be over.
ALTERNATE BULL ELLIOTT WAVE COUNT
DAILY CHART
Click chart to enlarge.
It is possible to see cycle wave IV a completed flat correction. This would provide some structural alternation with the zigzag of cycle wave II.
This is a regular flat but does not have a normal regular flat look. Primary wave C is too long in relation to primary wave A. Primary wave C would be 3.84 short of 4.236 the length of primary wave A. While it is possible to also see cycle wave IV as a complete zigzag (the subdivisions for that idea would be labelled the same as the bear wave count below, daily chart) that would not provide structural alternation with the zigzag of cycle wave II, and so I am not considering it.
This idea requires not only a new high but that the new high must come with a clear five upwards, not a three.
At 2,562 cycle wave V would reach equality in length with cycle wave I. Cycle wave I was just over one year in duration so cycle wave V should be expected to also reach equality in duration.
I added a bear market trend line drawn using the approach outlined by Magee in “Technical Analysis of Stock Trends”. When this lilac line is clearly breached by upwards movement that shall confirm a trend change from bear to bull. If it comes with a clear five up, then this wave count would be further confirmed.
While price remains below the bear market trend line, we should assume the trend remains the same: downwards.
Minor wave 3 should be complete soon. When it is done minor wave 4 may not move into minor wave 1 price territory below 2,020.13.
BEAR ELLIOTT WAVE COUNT
DAILY CHART
Click chart to enlarge.
This bear wave count has a better fit at Grand Super Cycle degree and is better supported by regular technical analysis at the monthly chart level. But it is a huge call to make, so I present it second, after a more bullish wave count, and until all other options have been eliminated.
There are two ideas presented in this chart: a huge flat correction or a double flat / double combination. The huge flat is more likely. They more commonly have deep B waves than combinations have deep X waves (in my experience).
A huge flat correction would be labelled super cycle (a)-(b)-(c). It now expects a huge super cycle wave (c) to move substantially below the end of (a) at 666.79. C waves can behave like third waves. This idea expects a devastating bear market, and a huge crash to be much bigger than the last two bear markets on the monthly bear chart.
The second idea is a combination which would be labelled super cycle (w)-(x)-(y). The second structure for super cycle wave (y) would be a huge sideways repeat of super cycle wave (a) for a double flat, or a quicker zigzag for a double combination. It is also possible (least likely) that price could drift sideways in big movements for over 10 years for a huge triangle for super cycle wave (y).
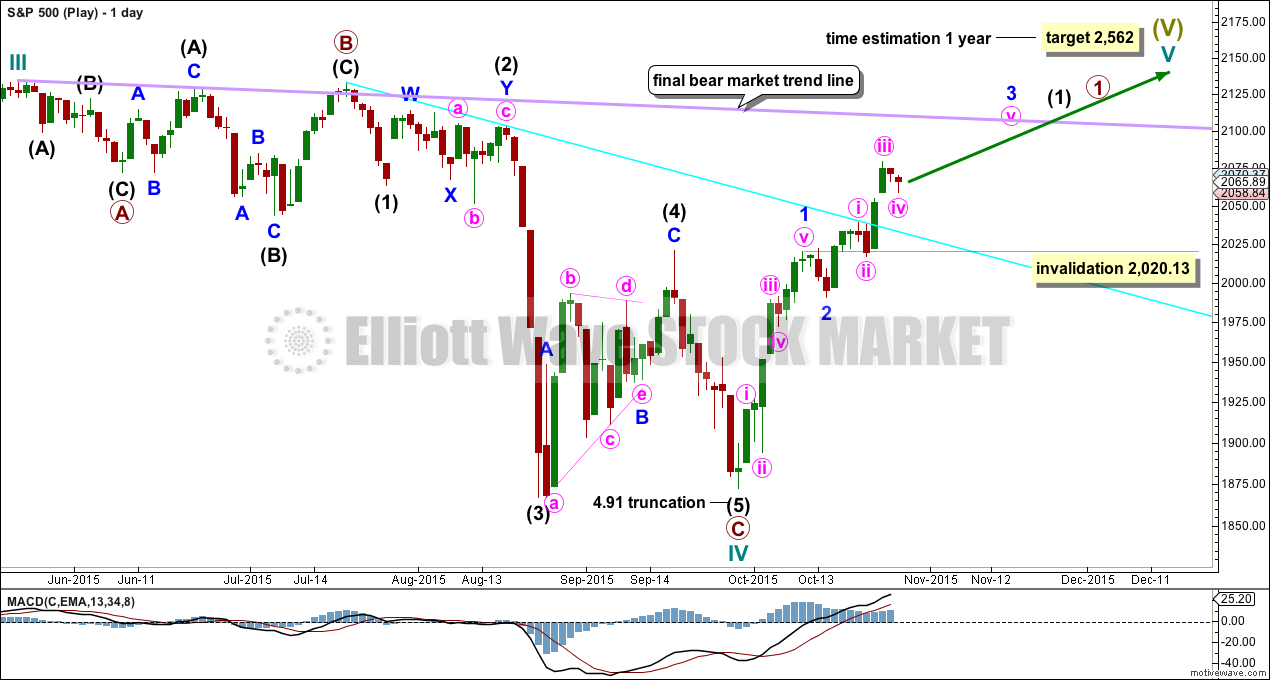
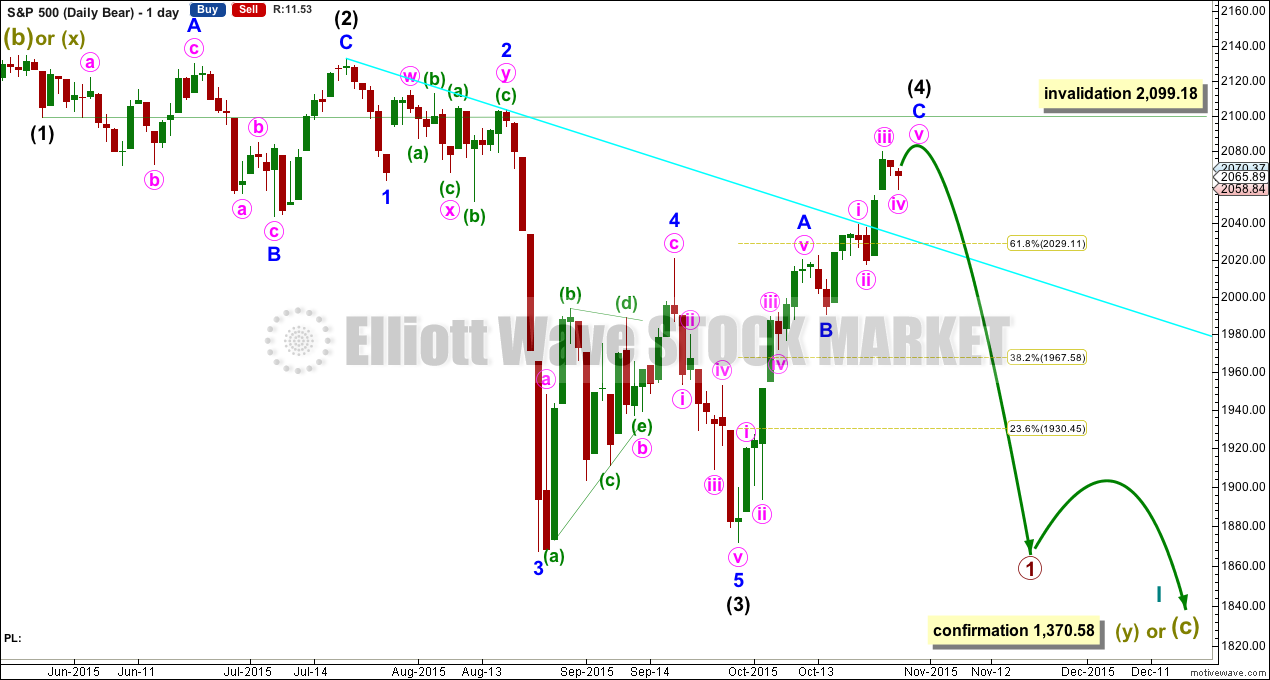
I am now seeing a third wave complete at the last major low for intermediate wave (3). Intermediate wave (3) is 17.31 longer than 6.854 the length of intermediate wave (1).
Minor wave 5 is seen as complete and slightly truncated.
A channel drawn using Elliott’s technique no longer works. Sometimes fourth waves aren’t contained within such a channel, which is why Elliott developed a second technique to use when they breach the channel.
Intermediate wave (2) was a very deep 0.95 expanded flat lasting 38 sessions. Intermediate wave (4) should exhibit alternation, is most likely to be more shallow, and be a quicker zigzag or zigzag multiple.
Intermediate wave (4) is continuing higher as a single zigzag. It may not move into intermediate wave (1) price territory above 2,099.18. If this price point is breached, then this bear wave count would revert to considering a leading diagonal unfolding for a primary degree first wave. The invalidation point for a leading diagonal would be at the all time high of 2,134.72.
HOURLY CHART
Click chart to enlarge.
The zigzag upwards for intermediate wave (4) is seen in exactly the same way as the zigzag upwards for primary wave B or X for the first two wave counts. The degree of labelling for this idea is one degree lower.
TECHNICAL ANALYSIS
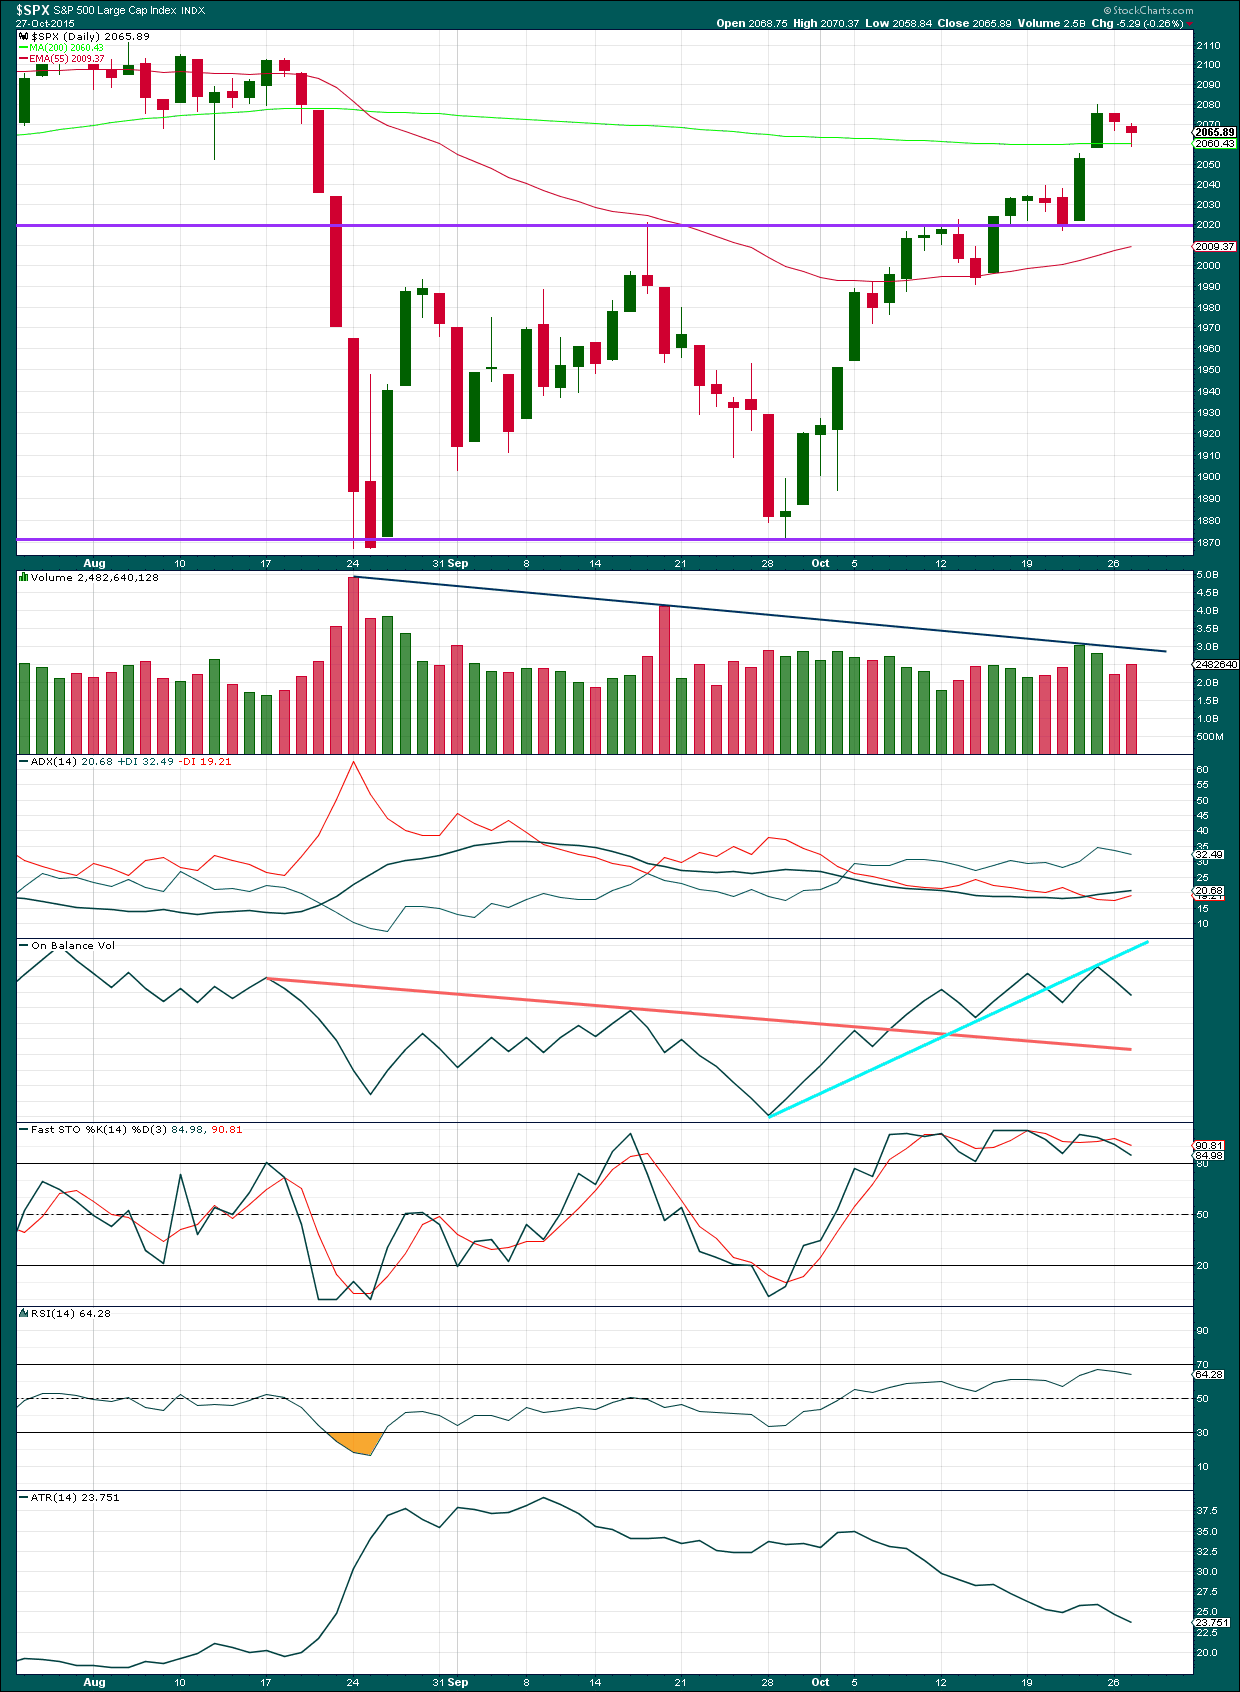
Click chart to enlarge. Chart courtesy of StockCharts.com.
Daily: Another small red candlestick looks corrective, and again comes on some increase in volume. The consistent increase in volume each time price falls is bearish.
It still looks like the strong upwards day of 22nd October with increased volume was an upwards breakout of a prior consolidation. However, the rise in price is overall not supported by volume very well. If price returns back below the horizontal trend line and if it does that on an increase in volume, then I would expect the upwards breakout was false.
The potential upwards breakout and move above the 200 day SMA is the most bullish picture from the S&P 500 for months. It gives some concern to the bear wave count, but it is not enough to fully support the very bullish alternate wave count. The picture at the monthly chart level remains very bearish. We have not had technical confirmation of an end to the bear market yet.
The black ADX line is now just above 20 and rising indicating an upwards trend is in place. ADX does tend to be a lagging indicator.
Average True Range does not agree with ADX and the range price which has moving in has been declining overall since about 9th September. This is more typical of a consolidation period than a trend. Particularly since the 5th of October ATR is clearly declining. This indicates the rise in price is not a typical trend and may very well still be part of the prior consolidation. This supports the idea that the upwards breakout may have been false.
On Balance Volume has found resistance at the bright aqua blue trend line. It may now find support at the orange line.
There is bearish divergence between Stochastics and price: as price has made new highs Stochastics has failed to confirm. This is a weak signal, but it does indicate the upwards movement in price is relatively weak.
A note on Dow Theory: for the bear wave count I would wait for Dow Theory to confirm a huge market crash. So far the industrials and the transportation indices have made new major swing lows, but the S&P500 and Nasdaq have not.
S&P500: 1,820.66
Nasdaq: 4,116.60
DJT: 7,700.49 – this price point was breached.
DJIA: 15,855.12 – this price point was breached.
This analysis is published about 07:12 p.m. EST.