
There is only one Elliott Wave count for FTSE.
Summary: I have only a bear wave count for FTSE. The bull wave count was invalidated. So far I have not been able to find other bull alternatives which fit. Of all the markets I currently analyse, FTSE is the clearest bear.
To see monthly and weekly charts and the bigger picture see last analysis here.
New updates to this analysis are in bold.
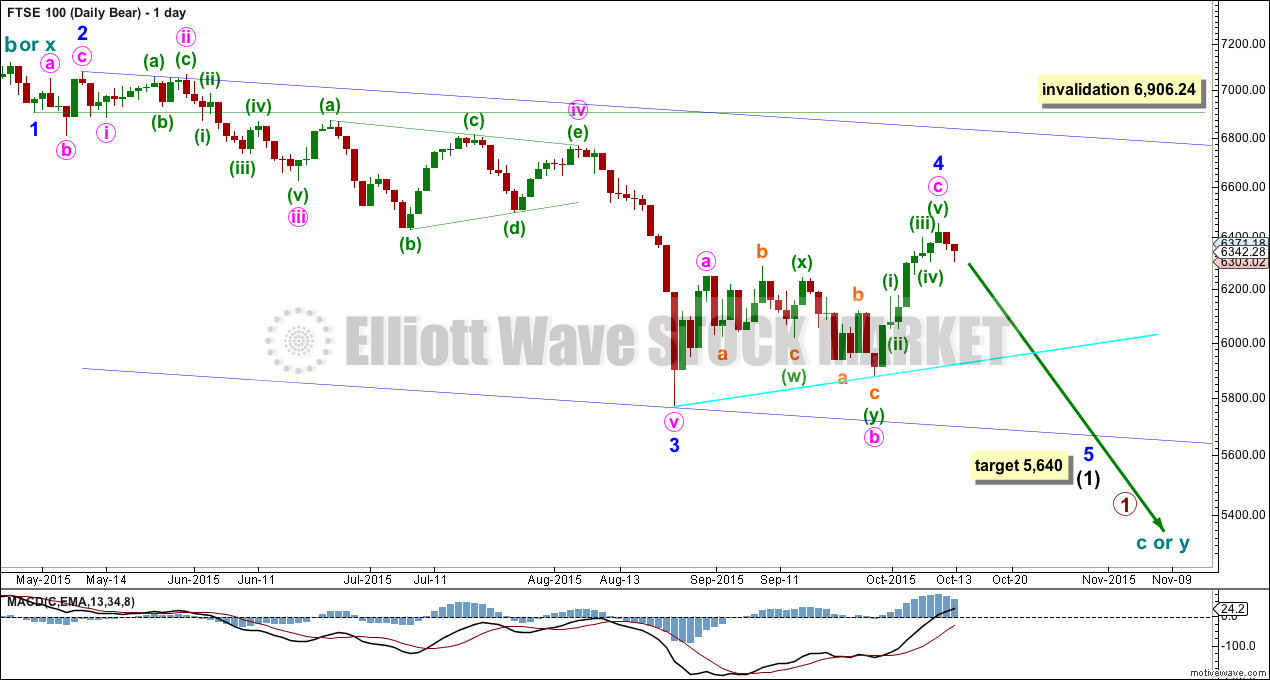
BEAR WAVE COUNT
Click chart to enlarge.
A new high above 6,284.17 invalidated the last daily FTSE chart. Minor wave 4 was not over.
Minor wave 4 still subdivides as a zigzag. Within minor wave 4, minute wave a will subdivide as a five on the hourly chart. Minute wave c continued higher and has no Fibonacci ratio to minute wave a.
There is no Fibonacci ratio between minor waves 1 and 3. This makes it a little more likely that minor wave 5 shall exhibit a Fibonacci ratio to either of minor waves 1 or 3. However, in my experience with analysis of FTSE, the FTSE does not reliably exhibit Fibonacci ratios between its actionary waves of impulses. This makes target calculation difficult. Support and resistance may be a better approach to see where minor wave 5 down should end.
At 5,640 minor wave 5 would reach 0.618 the length of minor wave 1.
If minor wave 4 continues any further, then it may not move into minor wave 1 price territory above 6,906.24.
For confidence that minor wave 5 is underway, I would want to see a break below the lower bright aqua blue trend line on increased volume. I will leave the invalidation point at 6,906.24 while price remains above that line. The risk to this analysis is that minor wave 4 is not over and will continue sideways / higher.
TECHNICAL ANALYSIS
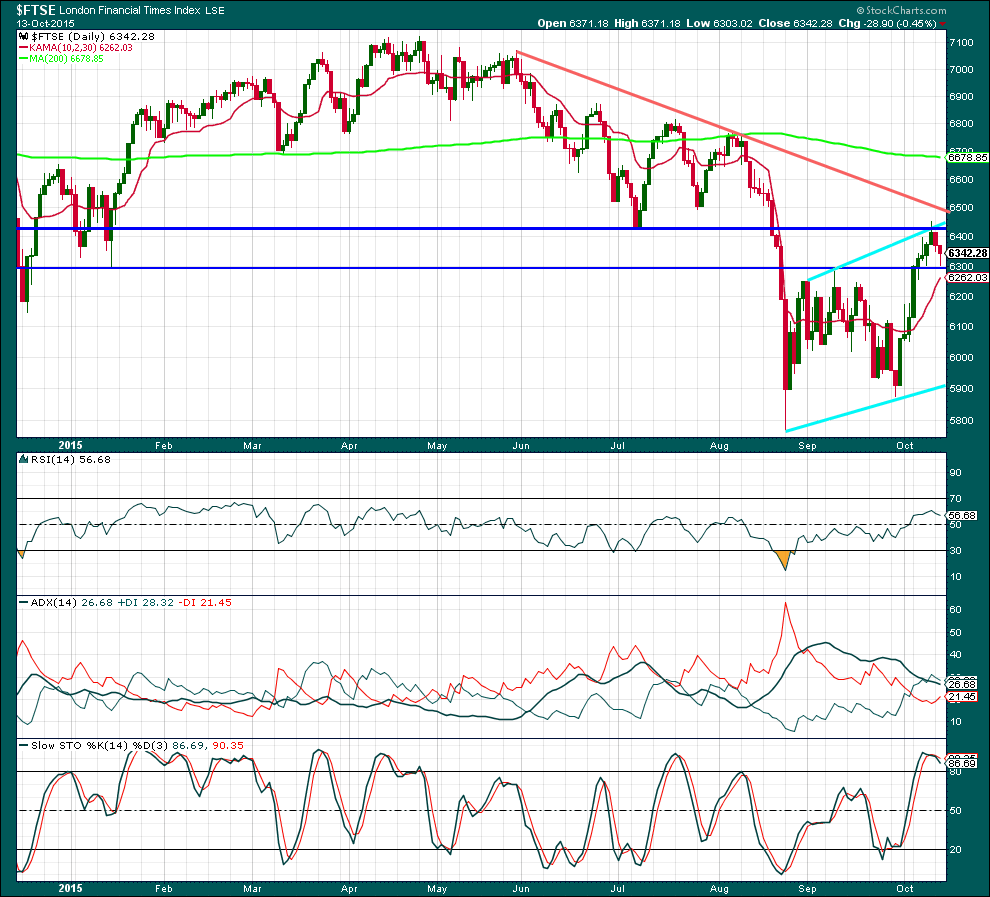
DAILY CHART
Click chart to enlarge. Chart courtesy of StockCharts.com.
There is no volume data on either the FXCM feed or StockCharts. Volume analysis is done from Yahoo Finance data.
Price has essentially been moving sideways since the low of 24th August. During this time, the downwards day of 18th September has strongest volume which indicates a breakout from this sideways move is more likely to be downwards than upwards.
Overall, ADX is pointing lower. The consolidation is maturing, the trend should resume soon, but for now the breakout has not yet happened.
A new low below the low of 24th August and an increase in volume would add confidence that a downwards breakout is underway.
Prior to that though a break below the lower bright aqua blue trend line on higher volume would indicate a downwards breakout.
Price broke above the upper horizontal line of resistance, and the breakout did come with an increase in volume. That may be an indication that price is breaking out upwards. This is not in line with the Elliott wave count and so I would want ADX to confirm this by moving higher above 20 and indicating a new upwards trend before I would have any confidence in it.
Price has found resistance at the next horizontal line and turned down from there. It may find some support at the first horizontal line now. How price behaves when it gets down to that line will be indicative. If it cannot break below that line, then downwards movement would look like a throw back and a new upwards trend may be indicated. If price breaks back below that line, then the upwards breakout may have been false, price would be back within the consolidation zone.
This analysis is published about 04:50 a.m. EST.