
Downwards movement was expected for Friday, but it did not happen.
Upwards movement remains below the invalidation point and within the recent zone of resistance.
Summary: Monday is highly likely to see some upwards movement, at least a little above 2,085.06, with the target for it to end at 2,097. Thereafter, the downwards trend should resume.
To see a weekly chart and how to draw trend lines go here.
Changes to last analysis are bold.
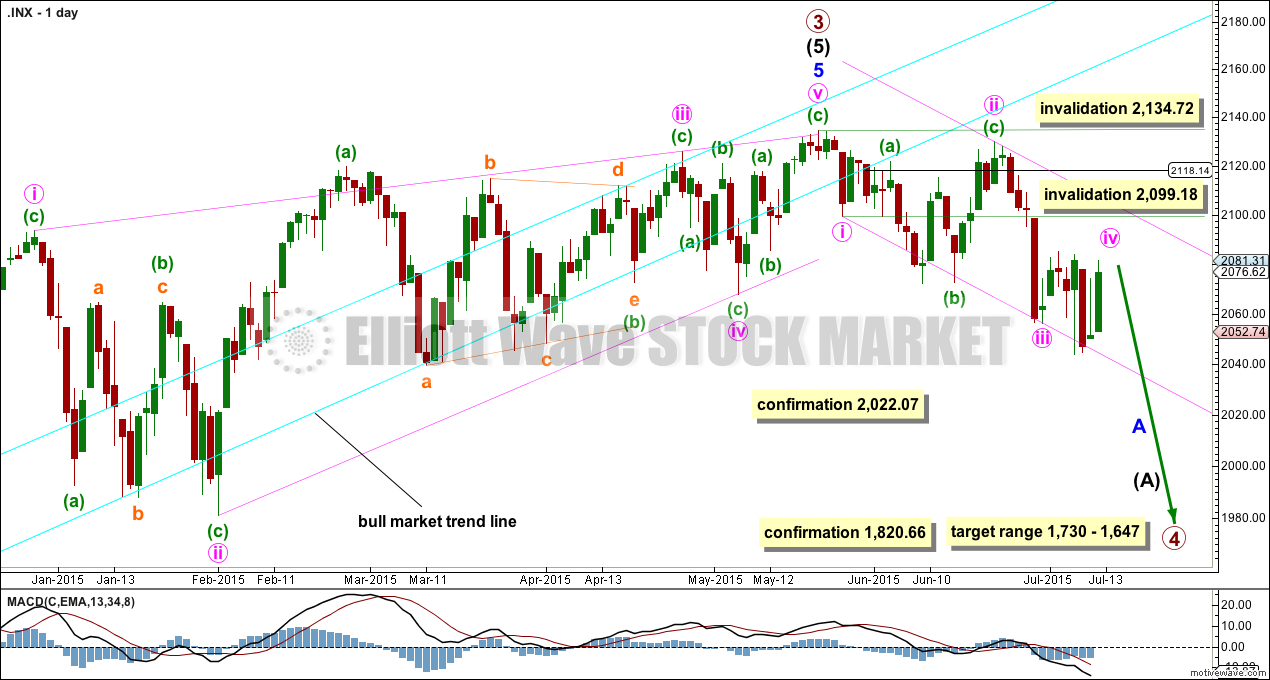
MAIN ELLIOTT WAVE COUNT
Click chart to enlarge.
It is possible that the S&P has seen a primary degree (or for the bear count below a Super Cycle degree) trend change.
This wave count now has some confirmation at the daily chart level with a close more than 3% of market value below the long held bull market trend line.
Further confirmation would come with:
1. A new low below 2,022.07 to invalidate the alternate wave count.
2. A clear five down on the hourly chart.
3. A clear five down on the daily chart.
4. A new low below 1,820.66.
As each condition is met the probability of a substantial trend change would increase.
Primary wave 4 would most likely be a time consuming flat, triangle or combination in order to exhibit structural alternation with the zigzag of primary wave 2. Primary wave 2 lasted 12 weeks. Primary wave 4 is likely to be longer in duration because combinations and triangles particularly are more time consuming than zigzags which tend to be quick corrections. Primary wave 4 may be expected to last more than 12 weeks, and may end with a total Fibonacci 21 weeks.
At this stage, a trend change is looking somewhat likely so I’ll list points in its favour:
1. ADX is above 20 and rising, and the -DX line is above the +DX line indicating a new downwards trend.
2. The long held bull market trend line, the strongest piece of technical analysis on ALL charts, has been breached now by a close more than 3% of market value.
3. There is quadruple negative divergence between price and MACD on the weekly chart.
4. There is double negative divergence between price and MACD on the daily chart.
5. There is persistent and strong negative divergence between price and RSI on the monthly chart. The last time this happened was October 2007 and we all know what happened after that…
6. A long held bull trend line on On Balance Volume going back to October 2014 has been breached and is no longer providing support (orange line added to OBV on the TA chart below).
7. DJT has recently failed to confirm the continuation of a bull market. This does not indicate a bear market, but does indicate caution.
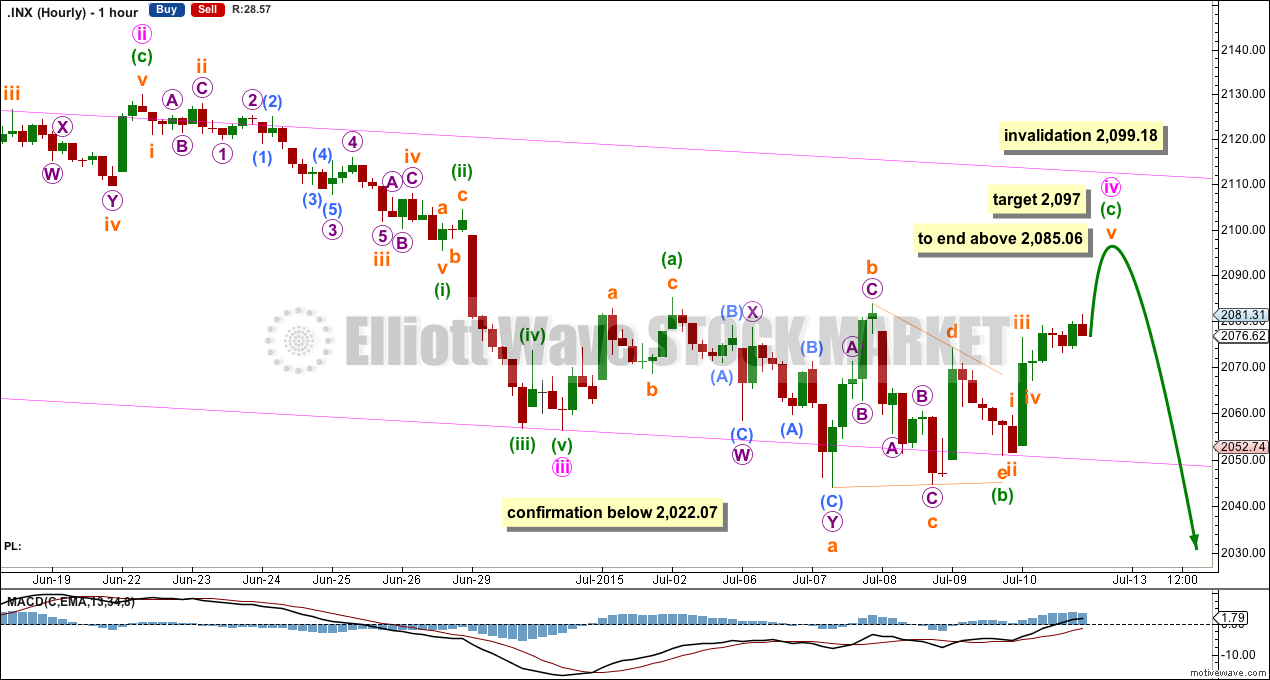
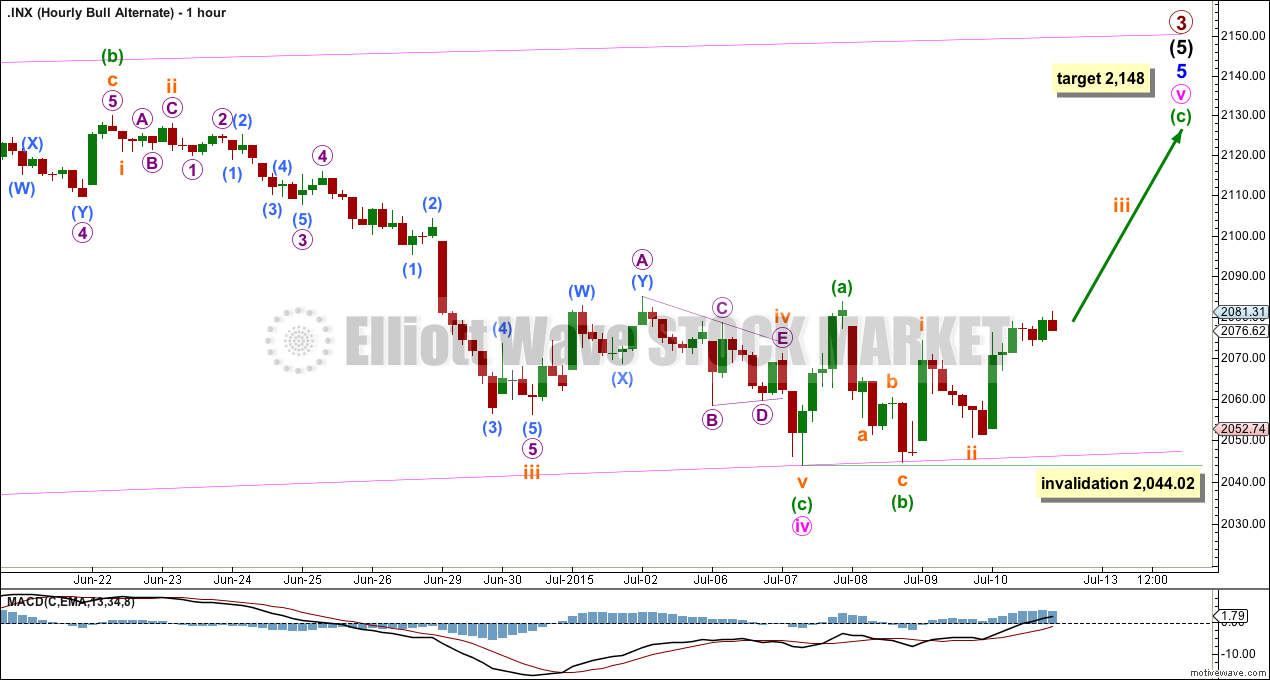
MAIN HOURLY WAVE COUNT
Click chart to enlarge.
The triangle was not invalidated, but no longer has the right look due to the triangle trend lines not clearly converging. Minute wave iv may be unfolding as an expanded flat correction. Minuette wave (b) is a 119% correction of minuette wave (a).
Minuette wave (c) would be very likely to make at least a slight new high above the end of minuette wave (a) at 2,085.06 to avoid a truncation and a very rare running flat. At 2,097 minuette wave (c) would reach 1.618 the length of minuette wave (a).
Minute wave iv may not move into minute wave i price territory above 2,099.18.
If price moves above 2,099.18, then I would use the alternate hourly wave count below. It expects exactly the same movement next, but only allows for more upwards movement before the downwards trend resumes.
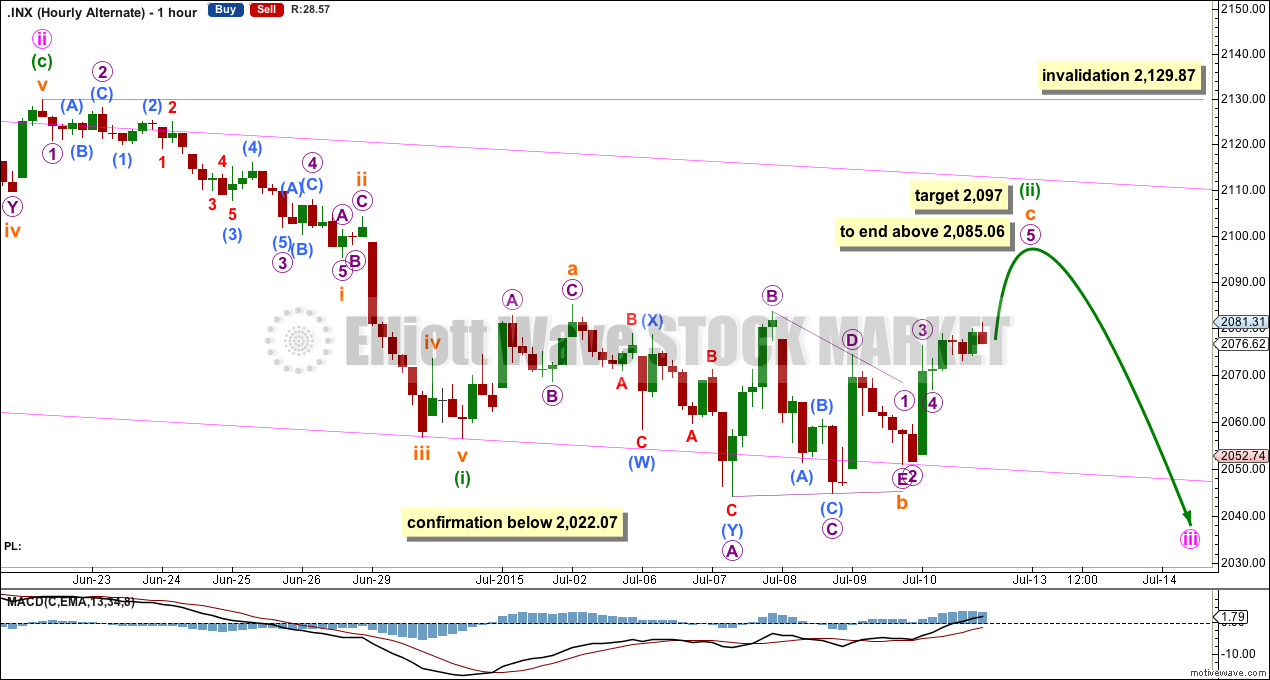
ALTERNATE HOURLY WAVE COUNT
Click chart to enlarge.
This wave count is identical to the main hourly wave count above, except for only the degree of labelling within minute wave iii which has been moved all down one degree. It may be that minute wave iii is extending further and this current correction is another second wave.
Minuette wave (ii) may not move beyond the start of minuette wave (i) above 2,129.87.
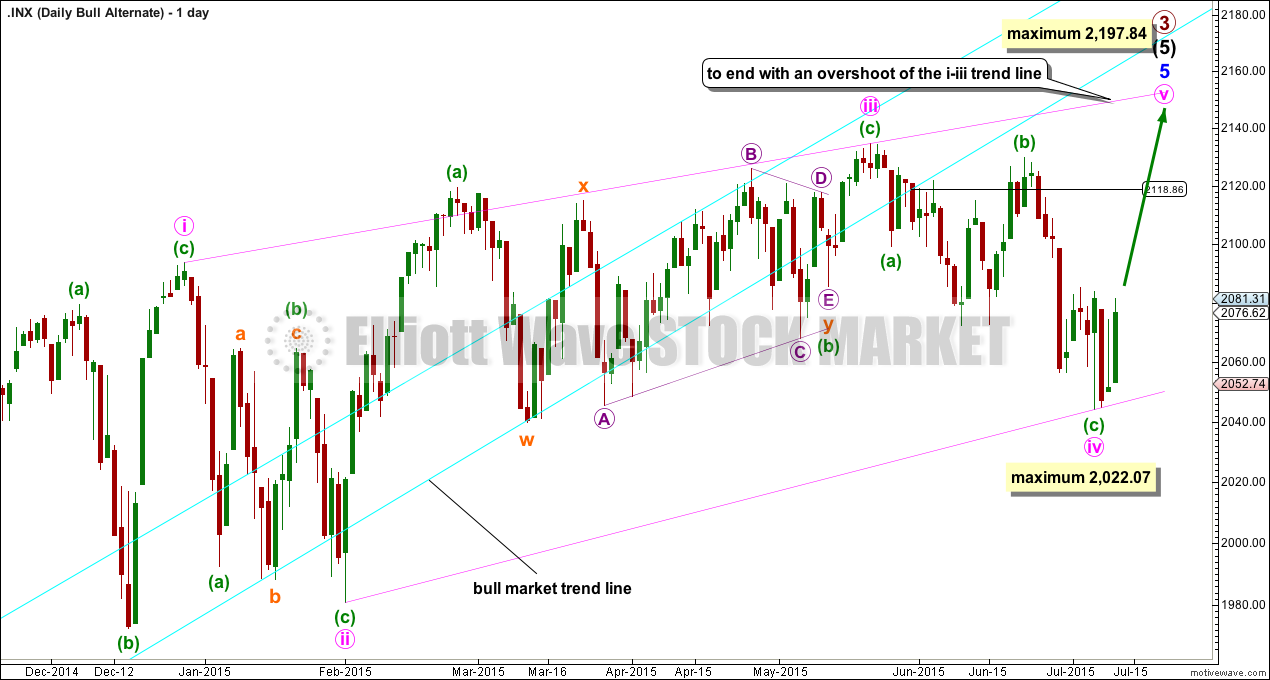
ALTERNATE ELLIOTT WAVE COUNT
Click chart to enlarge.
The ending contracting diagonal may still be incomplete. Ending diagonals require all sub waves to subdivide as zigzags, and the fourth wave should overlap first wave price territory. It is Elliott wave convention to always draw the diagonal trend lines to indicate a diagonal structure is expected.
The diagonal trend lines are no longer clearly contracting and minuette wave (c) within minute wave iv now looks like a three where it should be a five. This reduces the probability of this wave count.
If it moves any lower, then minute wave iv may not be longer than equality in length with minute wave ii at 2,022.07. If it is over here, then minute wave v up also has a limit and may not be longer than equality with minute wave iii at 2,197.84.
The best way to see where and when upwards movement may end is the upper diagonal i-iii trend line. It is very likely to be overshot. Upwards movement may find resistance at the long held bull market trend line.
Because the long held bull market trend line has now been breached by a close more than 3% of market value below it, this wave count is now an alternate and a bear market is indicated.
Click chart to enlarge.
Minute wave v may have begun with either minuette waves (a) and (b) complete, or only subminuette waves i and ii within minuette wave (a) complete. The degree of labelling within minute wave v may be correct here, or it could also be moved down one degree.
At this stage, if minuette waves (a) and (b) are complete, then at 2,148 minuette wave (c) would reach 2.618 the length of minuette wave (a).
I don’t have a lot of confidence in this target. When there is more structure upwards to analyse then the target may change, but it does not expect a reasonable overshoot of the i-iii diagonal trend line.
At this stage, I also don’t have confidence in this alternate wave count: the diagonal is not looking right at the daily chart level, ADX continues to indicate a downwards trend is in place, and volume continues to favour a bear market.
The upwards wave labelled subminuette wave i for Thursday’s session subdivides strongly as a three on the five minute chart, but it should be a five.
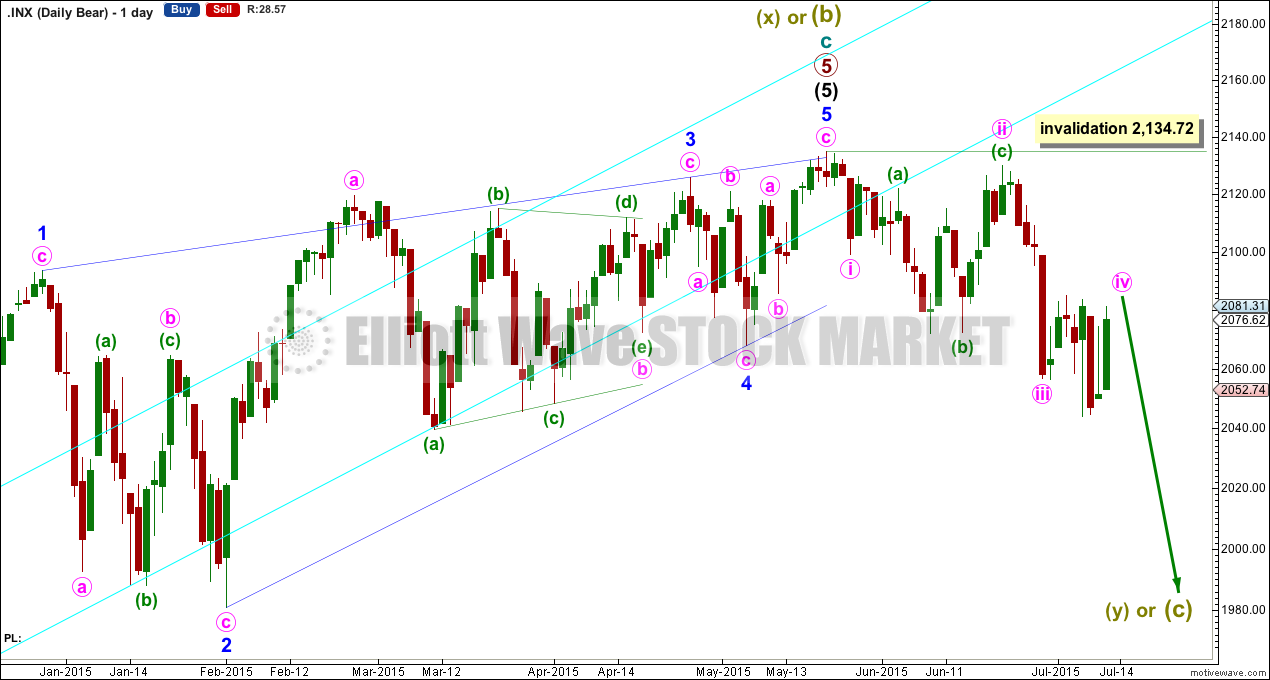
BEAR ELLIOTT WAVE COUNT
Click chart to enlarge.
The subdivisions within cycle waves a-b-c are seen in absolutely exactly the same way as primary waves 1-2-3 for the main wave count.
In line with recent Grand Super Cycle wave analysis, I have moved the degree of labelling for the bear wave count all up one degree.
This bear wave count expects a Super Cycle wave (c) to unfold downwards for a few years, and if it is a C wave it may be devastating. It may end well below 666.79.
However, if this wave down is a Super Cycle wave (y), then it may be a time consuming repeat of the last big flat correction with two market crashes within it, equivalent to the DotCom crash and the recent Global Financial Crisis, and it may take another 8-9 years to unfold sideways.
Within the new bear market, no second wave correction may move beyond the start of its first wave above 2,134.72.
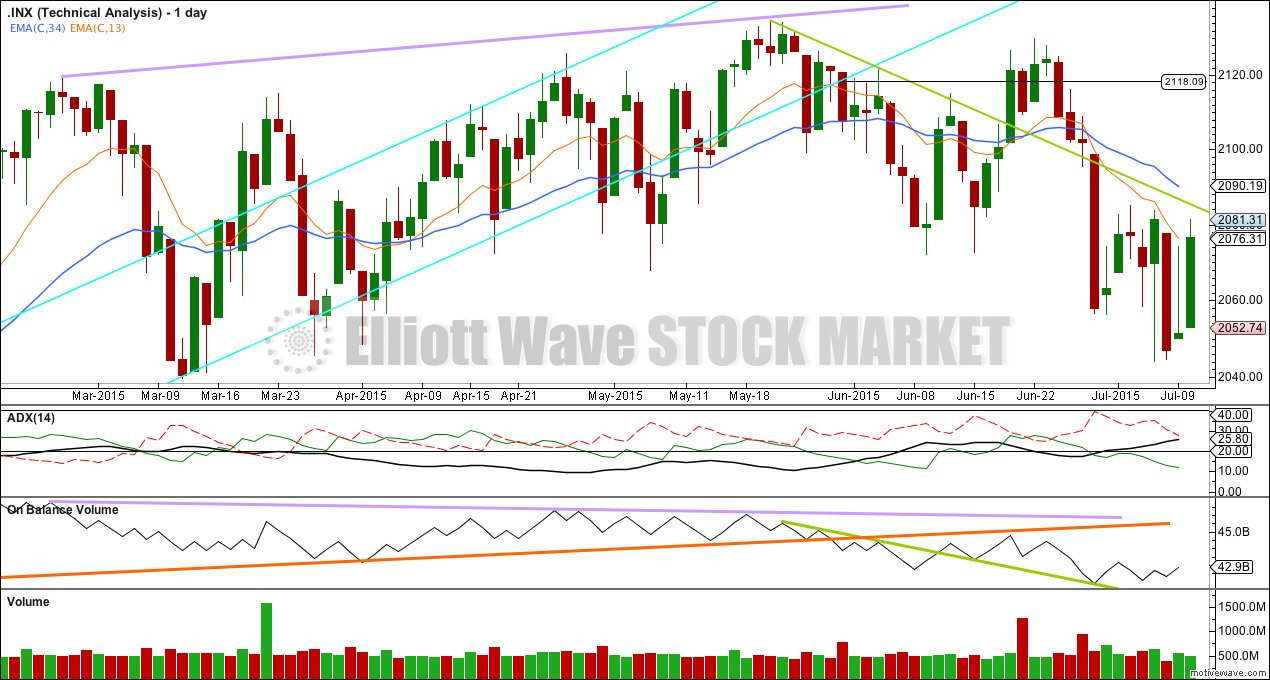
TECHNICAL ANALYSIS
Click chart to enlarge.
ADX continues to indicate an upwards trend is in place and is strengthening. The ADX line is moving higher this week despite sideways movement, but the trend remains down: the -DX line remains above the +DX line.
Friday’s session completes on lower volume. The rise in price for Friday was not supported by volume, which indicates it is more likely a correction against the downward trend.
A note on Dow Theory: for the bear wave count I would wait for Dow Theory to confirm a huge market crash. For that to be confirmed the following new lows are needed:
S&P500: 1,820.66
Nasdaq: 4,116.60
DJT: 7,700.49
DJIA: 15,855.12
At this time DJT is closest, but none of these indices have made new major swing lows yet.
This analysis is published about 09:04 p.m. EST.