
Downwards movement was not expected from the main Elliott wave count, but it has not been enough to invalidate the main Elliott wave count at the hourly chart level.
Summary: The main wave count assumes a bull market remains intact because we have zero confirmation of a bear market. A new target is today calculated at 2,185, and may be met in another nine days. Alternatively, the trend change may have already happened, but there is no confirmation of this. A new low below 2,072.14 would increase the probability that the S&P has moved into a new bear market.
To see a weekly chart and how to draw trend lines go here.
Changes to last analysis are italicised.
Bull Wave Count
Click chart to enlarge.
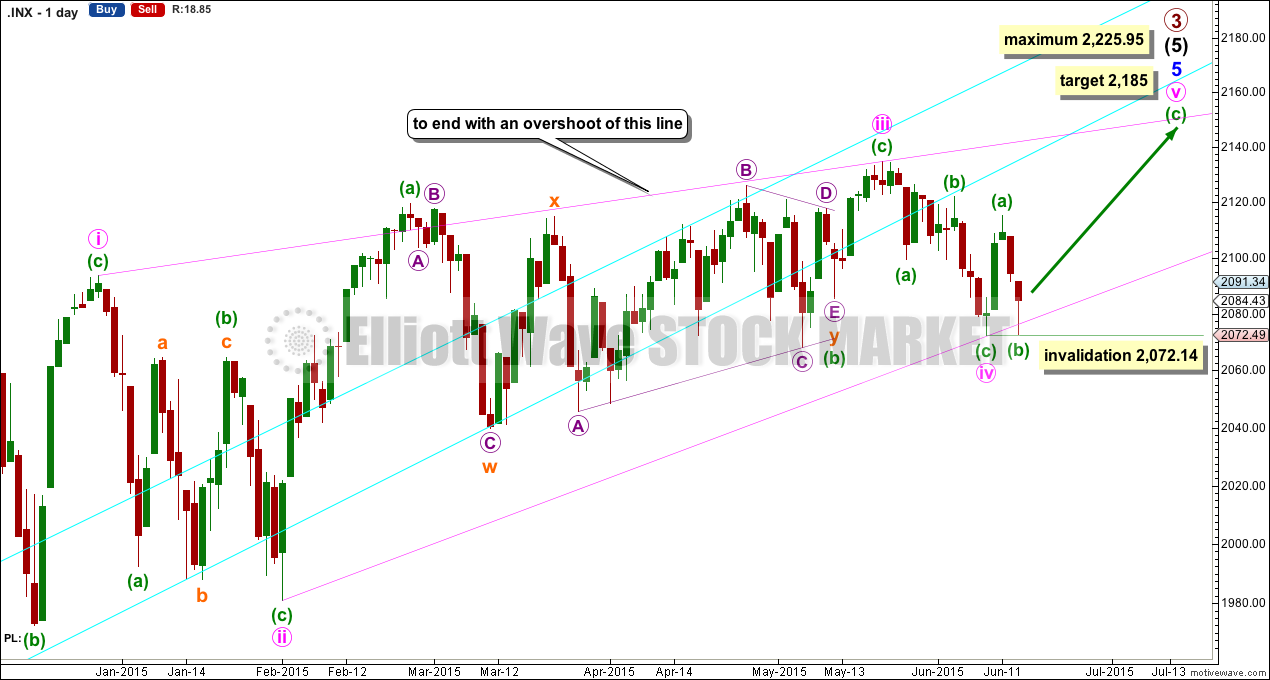
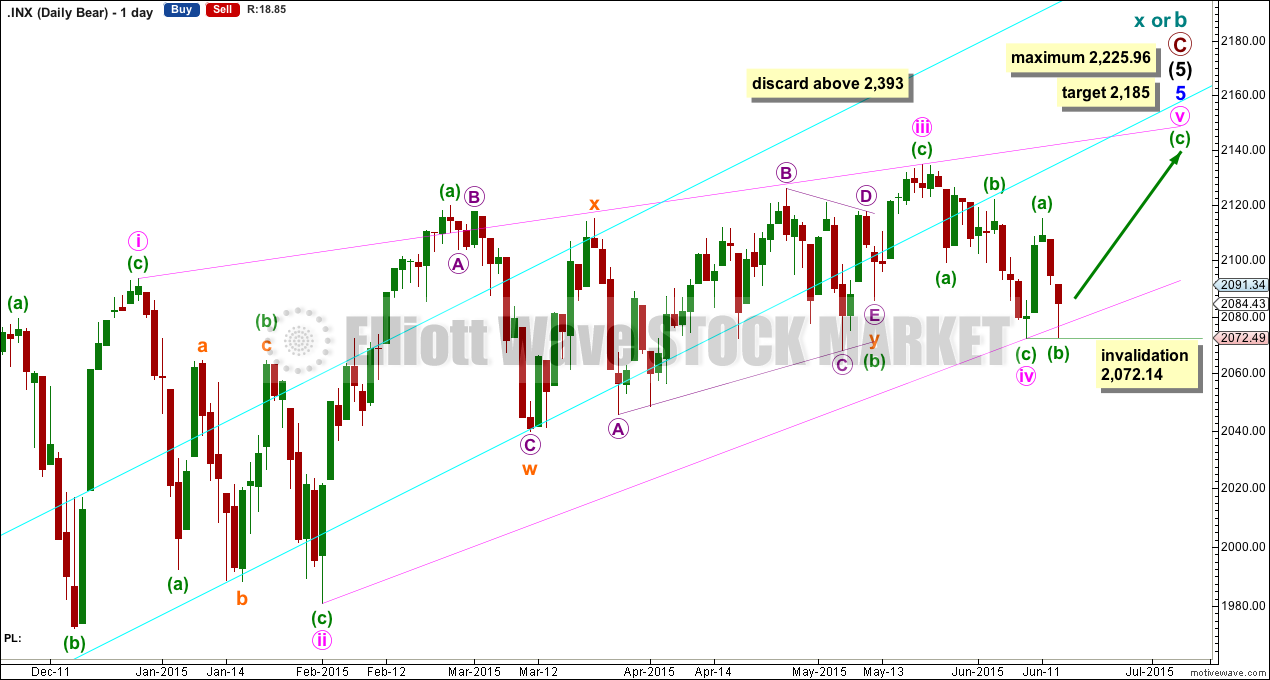
The ending contracting diagonal may still be incomplete.
The diagonal is contracting. Minute wave iii is shorter than minute wave i, and minute wave iv is shorter than minute wave ii. Minute wave iv overlaps into minute wave i price territory as it must for a diagonal.
Minuette wave (b) may have moved lower on Monday to end with a small overshoot of the lower diagonal trend line, which is acceptable. The target for minuette wave (c) is recalculated to 2,185, where it would reach 2.618 the length of minuette wave (a); this target allows for a reasonable overshoot of the upper i-iii diagonal trend line.
The diagonal trend lines would cross over on 3rd November. The diagonal must end a reasonable amount of time before that date, because diagonals end before their trend lines cross.
Minuette wave (b) may not move beyond the start of minuette wave (a) below 2,072.14.
Minute wave v may not be longer than equality with minute wave iii at 2,225.95, and the third wave may not be the shortest.
Overall this wave count has a good look. It sees minute wave iii as complete at the more recent high, and within it minuette wave b is a combination: zigzag – X – triangle.
The trend line still has not been breached by a close of 3% or more of market value since its inception in November 2011, but it is no longer exactly where price is finding support, and the strength of that line appears to be waning.
I will again have a preference for this bull wave count because we should always assume the trend remains the same until proven otherwise. While there is no confirmation of a bear market I will assume the S&P remains in a bull market.
If upwards movement continues past the limit of minute wave v at 2,255.95, then I will again publish the very bullish alternate.
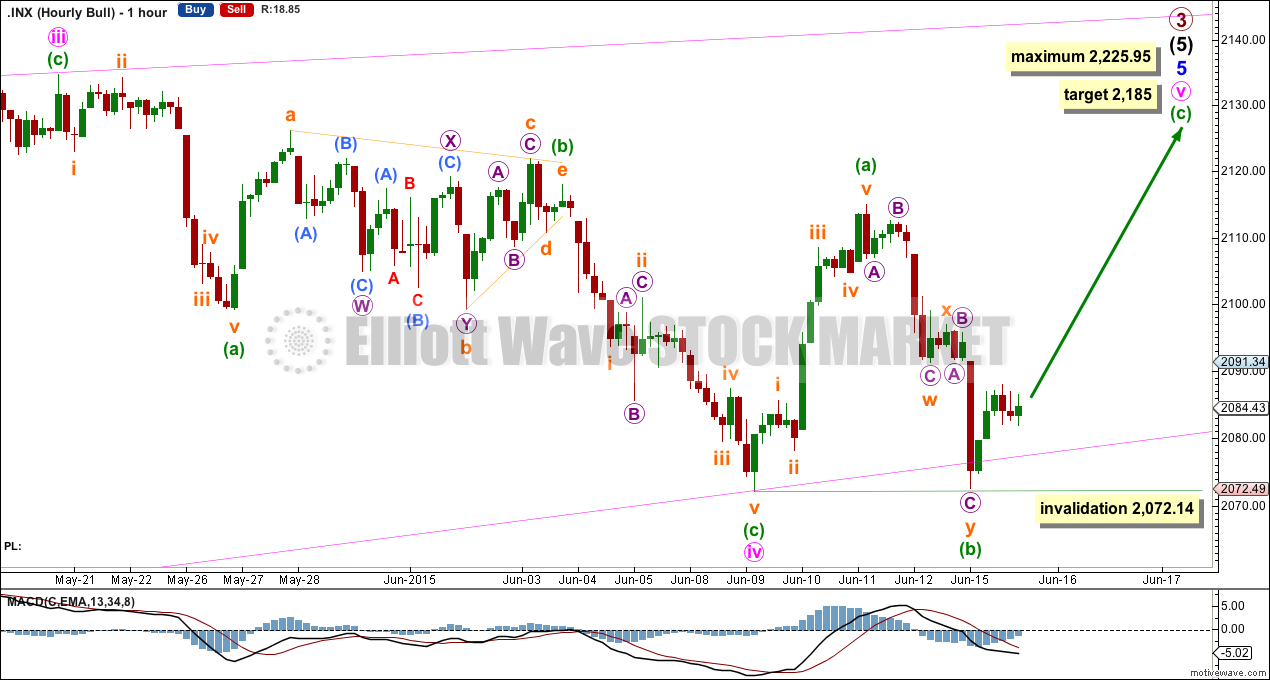
Click chart to enlarge.
The hourly chart shows all of minute wave iv and the start of minute wave v.
Minute wave v has so far lasted four days. If it ends in another four, it may total a Fibonacci eight. Or it may take another nine days to total a Fibonacci thirteen, and considering the new target this now looks more likely.
Minuette wave (b) moved lower and now subdivides as a double zigzag. It has overshot the lower ii-iv diagonal trend line, which is acceptable, but the trend line is not fully breached.
Alternate Bull Wave Count
Click chart to enlarge.
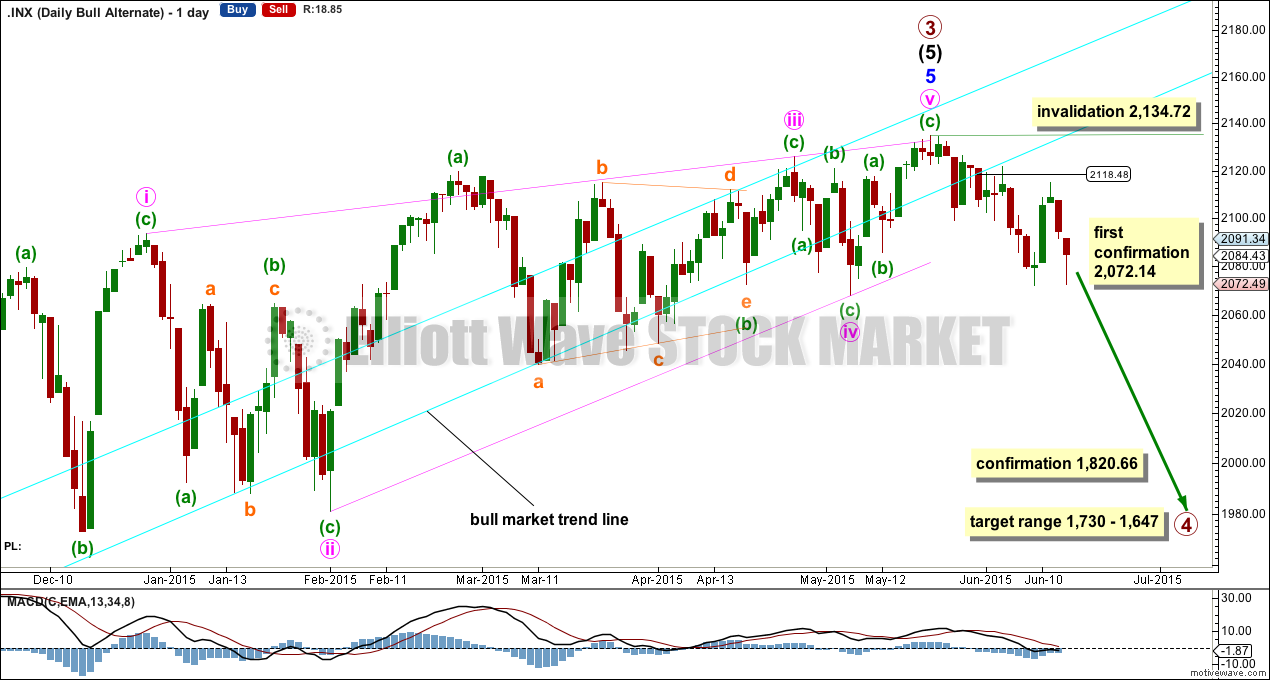
It is possible that the S&P has seen a primary degree (or for the bear count below a cycle degree) trend change seventeen days ago.
This wave count absolutely requires confirmation at the daily chart level before any confidence may be had in a primary (or cycle) degree trend change. Confirmation would come with:
1. A new low below 2,072.14.
2. A clear five down on the hourly chart.
3. A close of 3% or more of market value below the lower aqua blue trend line. If the line is now breached at 2,118, then a close at 2,055 or below is required to confirm a bear market.
4. A clear five down on the daily chart.
5. A new low below 1,820.66.
As each condition is met the probability of a substantial trend change would increase.
Primary wave 4 would most likely be a time consuming flat, triangle or combination in order to exhibit structural alternation with the zigzag of primary wave 2. Primary wave 2 lasted 12 weeks. Primary wave 4 is likely to be longer in duration because combinations and triangles particularly are more time consuming than zigzags which tend to be quick corrections. Primary wave 4 may be expected to last more than 12 weeks, and may end with a total Fibonacci 13 or more likely 21 weeks.
For this more bearish wave count to be taken seriously it requires at least a clear five down on the hourly chart.
At this stage, a trend change is looking somewhat likely so I’ll list points in its favour:
1. ADX is rising and above 20, and the -DX line is above the +DX line indicating a new downwards trend.
2. The long held bull market trend line, the strongest piece of technical analysis on ALL charts, has again been recently breached. But the breach was small and did not close 3% or more of market value below the line, so a bear market is not indicated.
3. There is quadruple negative divergence between price and MACD on the weekly chart.
4. There is double negative divergence between price and MACD on the daily chart.
5. There is persistent and strong negative divergence between price and RSI on the monthly chart. The last time this happened was October 2007 and we all know what happened after that…
6. A long held bull trend line on On Balance Volume going back to October 2014 has been breached and is no longer providing support.
7. Using Dow Theory, DJT and Nasdaq are still failing to confirm a continuation of the bull market. This does not indicate a bear market and just indicates caution.
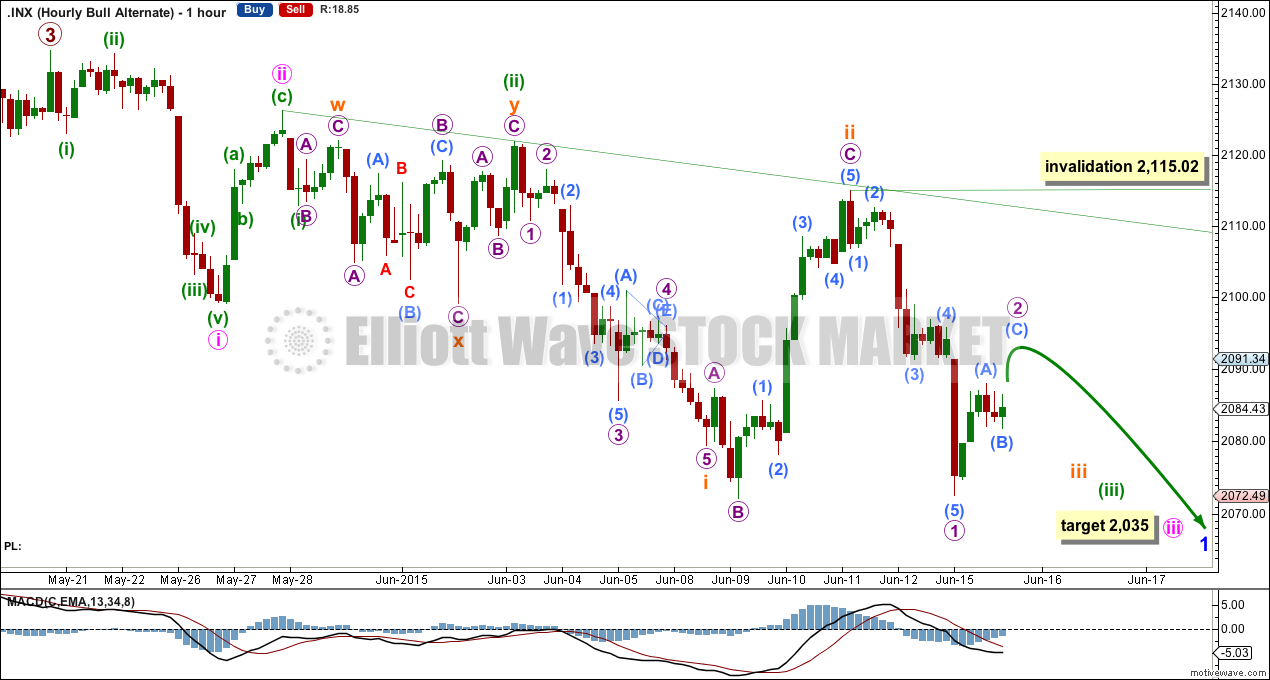
Click chart to enlarge.
There is now a series of four overlapping first and second waves, indicating very strong downwards movement to come this week.
Micro wave 2 should complete quickly tomorrow morning if this wave count is correct. It may not move beyond the start of micro wave 1 above 2,115.02, but it should find strong resistance at the sloping green trend line if it moves that high. It should be brief and shallow.
At 2,035 minute wave iii would reach 2.618 the length of minute wave i.
There is still not a clear five down on the hourly chart, the absolute minimum requirement for any confidence in a trend change of this magnitude.
Bear Wave Count
Click chart to enlarge.
The subdivisions within primary waves A-B-C are seen in absolutely exactly the same way as primary waves 1-2-3 for the alternate bull wave count.
To see the difference at the monthly chart level between the bull and bear ideas look at the last historical analysis here.
At cycle degree, wave b is over the maximum common length of 138% the length of cycle wave a, at 170% the length of cycle wave a. At 2,393 cycle wave b would be twice the length of cycle wave a and at that point this bear wave count should be discarded.
Technical Analysis
Click chart to enlarge.
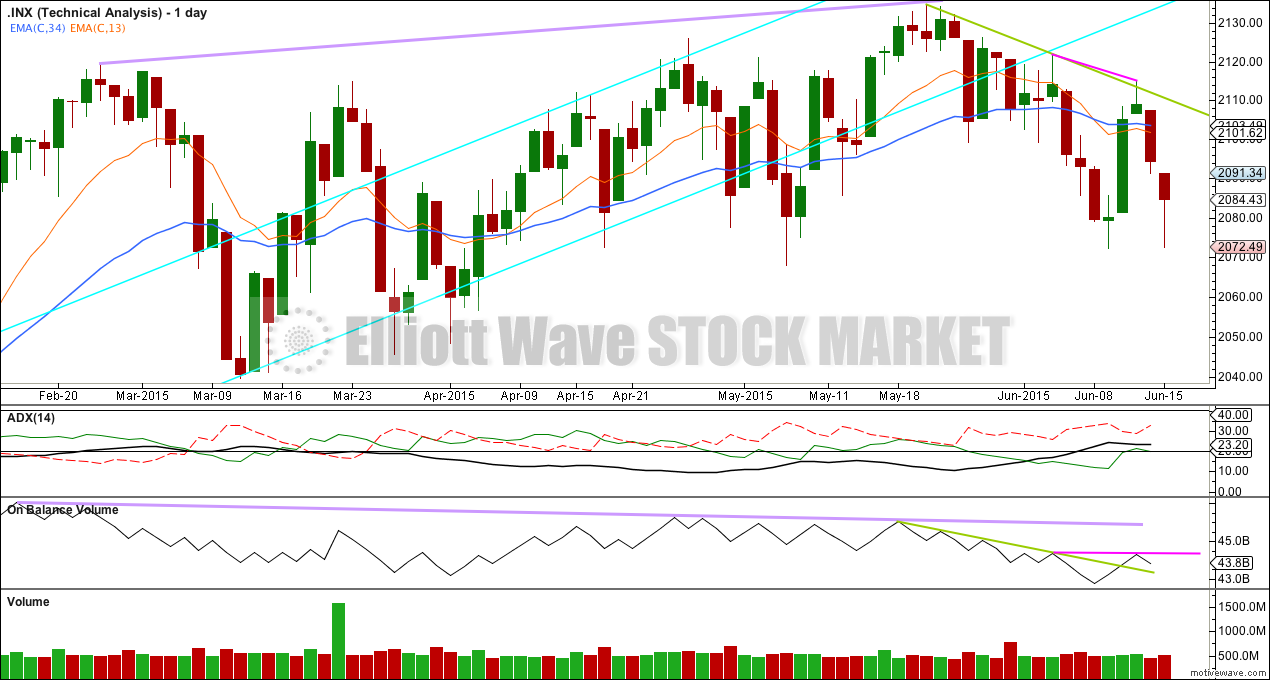
ADX is above 20 and currently flat. A clear trend is no longer indicated, and will not be if ADX remains flat to declining.
On Balance Volume has breached a short held trend line to the upside. This may be an early indicator of a short term trend change and the beginning of another upwards swing. The last two swing highs in price saw the second high of 11th June lower than the prior swing high of 3rd June. But while price made a lower high, OBV made a higher high creating a positive divergence (pink lines).
The regular TA picture is less clear now than it was last week. The main bull wave count may be favoured above the alternate at this stage.
The negative divergence between price and OBV going back to February still holds, indicating that the next downwards trend may not be just a swing but may be a bear market of some longer duration. This divergence warns of a potential bear market coming, but it does not tell us exactly when; negative divergence can continue for long periods of time before trend changes actually happen. Negative divergence is indicative and not definitive.
This analysis is published about 09:32 p.m. EST.