
A little more upwards movement has reduced the probability of the alternate Elliott wave count.
Summary: The main wave count expects a third wave up and requires confirmation with a new high above 2,134.72. The alternate expects a primary degree trend to remain down for a further 18 weeks, and requires confirmation with a close 3% or more of market value below the long held bull market trend line. While that trend line continues to show support, a bull market should be assumed to remain intact.
To see a weekly chart and how to draw trend lines go here.
Changes to last analysis are italicised.
Bull Wave Count
Click chart to enlarge.
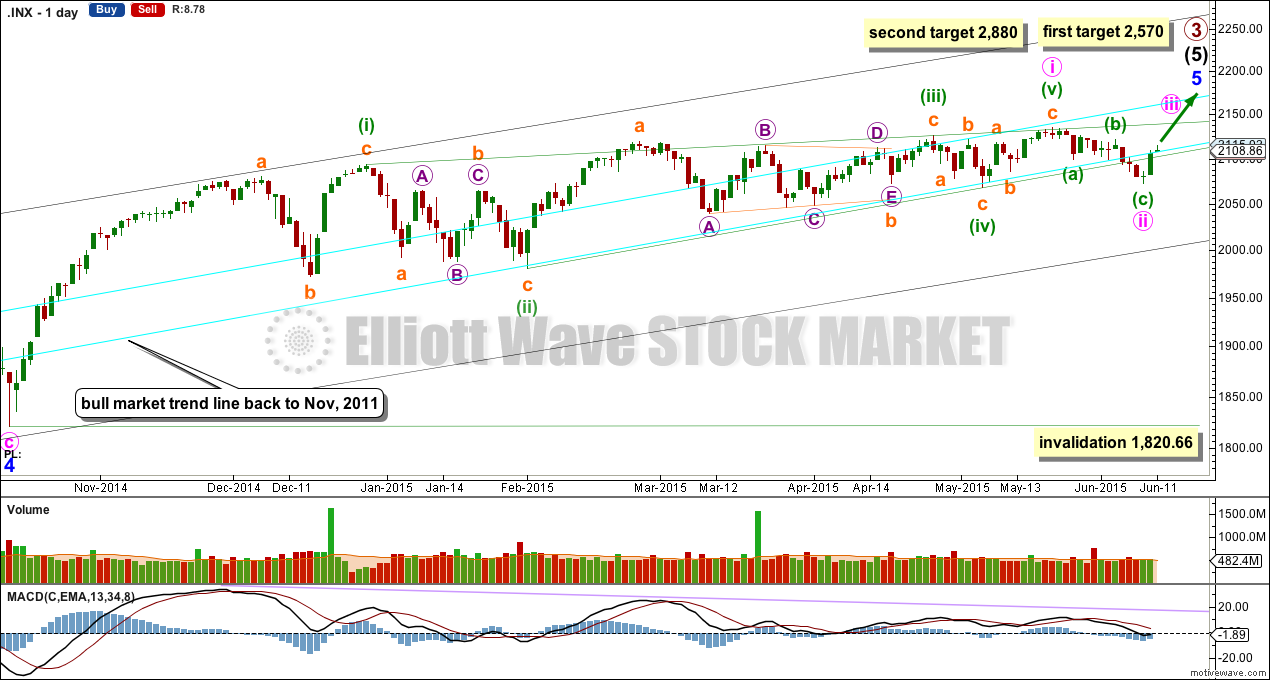
The bull wave count sees primary 1-2-3 within an impulse for a cycle degree wave V.
The bear wave count sees primary A-B-C zigzag for a cycle degree B wave.
I have presented this idea before and for the main count I will again revert to it. The diagonal structure is highly likely to be complete. While a market change from bull to bear is unconfirmed, it should be assumed that the trend remains the same at primary degree. I have moved the degree of labelling within the diagonal down one degree: minor wave 5 may still be incomplete and may have begun with a leading contracting diagonal.
Leading diagonals in first wave positions are most commonly followed by particularly deep second wave corrections. In this instance that should not happen though because the lower aqua blue bull market trend line should provide very strong support. Minute wave ii may have ended as a more shallow zigzag.
A new, less bullish target is calculated today for primary wave 3 to end. At 2,550 intermediate wave (5) would reach 1.618 the length of intermediate wave (3). But there is already an exceptionally close Fibonacci ratio between intermediate waves (1) and (3), so the final target would be better calculated at primary wave degree.
At 2,880 primary wave 3 would reach 2.618 the length of primary wave 1.
Minute wave ii may not move beyond the start of minute wave i below 1,820.66. However, this wave count should be discarded before that price point is passed. If the bull market trend line is breached by a close of 3% or more of market value it would indicate a trend change from bull to bear. The alternate would become the main wave count. With price again slightly above this bull market line, the value of a close 3% or more must be recalculated if the line is again breached.
Click chart to enlarge.
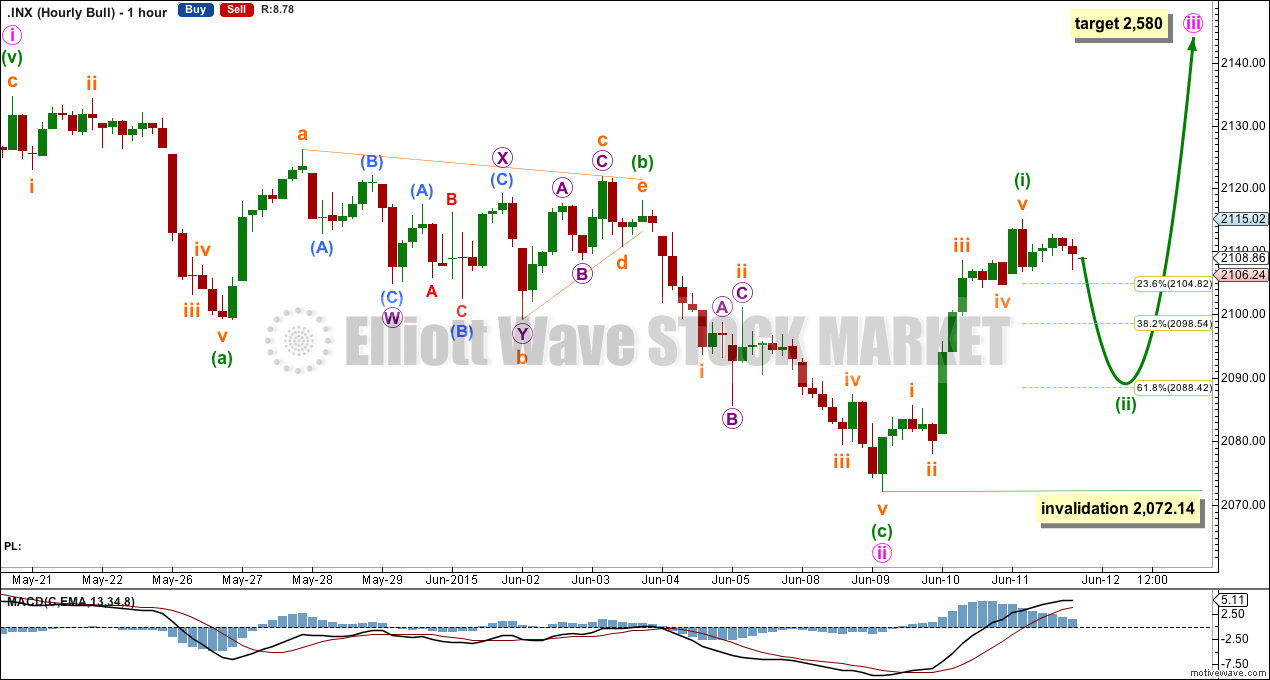
If recent downwards movement is a second wave correction, then it may now be over as a zigzag.
There is no Fibonacci ratio between minuette waves (a) and (c).
Minuette wave (b) subdivides as a running contracting triangle. All the subdivisions within it fit, but within the double zigzag of subminuette wave b the second zigzag of micro wave Y is not a clear three. It looks like a five. This is the only problem within this wave count at the hourly chart level.
If minute wave iii has begun, then at 2,580 it would reach 1.618 the length of minute wave i.
Within minute wave iii, the first five up for minuette wave (i) may be complete. Minuette wave (ii) may correct to either the 0.382 or more likely the 0.618 Fibonacci ratios. Minuette wave (ii) may not move beyond the start of minuette wave (i) below 2,072.14.
Alternate Bull Wave Count
Click chart to enlarge.
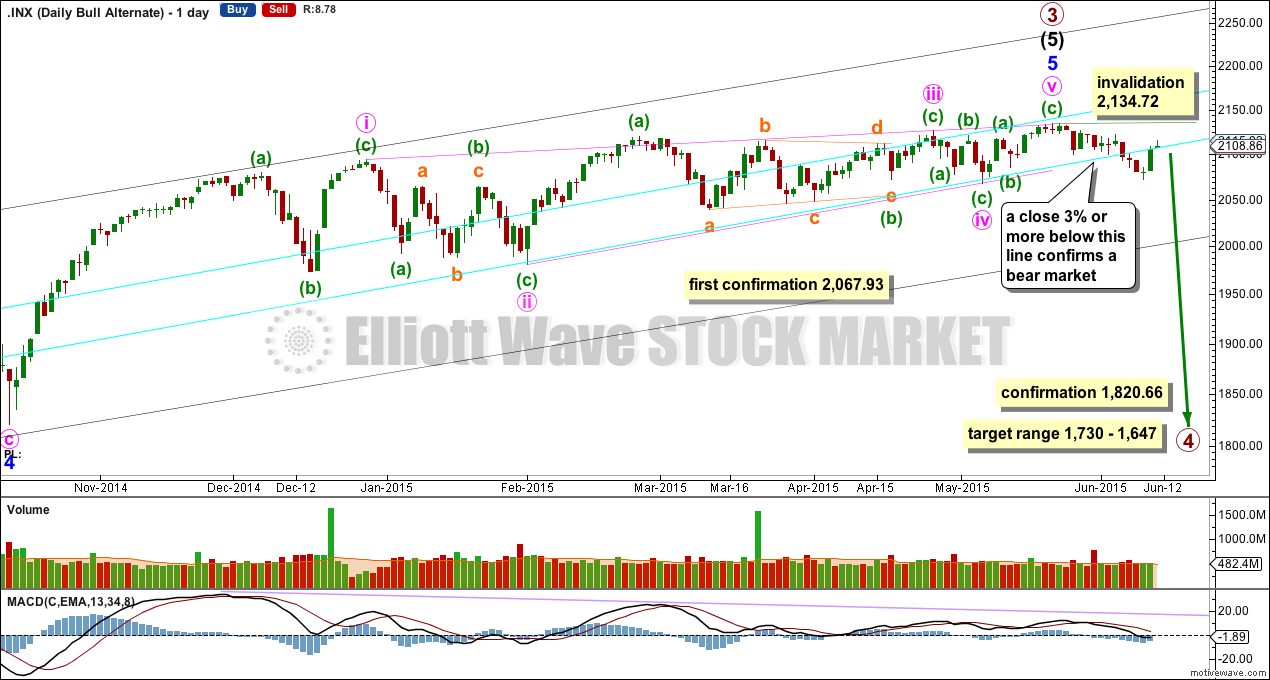
It is possible that the S&P has seen a primary degree (or for the bear count below a cycle degree) trend change fifteen days ago.
This wave count absolutely requires confirmation at the daily chart level before any confidence may be had in a primary (or cycle) degree trend change. Confirmation would come with:
1. A new low below 2,067.93.
2. A clear five down on the hourly chart.
3. A close of 3% or more of market value below the lower aqua blue trend line.
4. A clear five down on the daily chart.
5. A new low below 1,820.66.
As each condition is met the probability of a substantial trend change would increase.
Primary wave 4 would most likely be a time consuming flat, triangle or combination in order to exhibit structural alternation with the zigzag of primary wave 2. Primary wave 2 lasted 12 weeks. Primary wave 4 is likely to be longer in duration because combinations and triangles particularly are more time consuming than zigzags which tend to be quick corrections. Primary wave 4 may be expected to last more than 12 weeks, and may end with a total Fibonacci 13 or more likely 21 weeks.
For this more bearish wave count to be taken seriously it requires at least a clear five down on the hourly chart.
At this stage, a trend change is looking somewhat likely so I’ll list points in its favour:
1. ADX is rising and above 20, and the -DX line is above the +DX line indicating a new downwards trend.
2. The long held bull market trend line, the strongest piece of technical analysis on ALL charts, has again been recently breached. But the breach was small and did not close 3% or more of market value below the line, so a bear market is not indicated.
3. There is quadruple negative divergence between price and MACD on the weekly chart.
4. There is double negative divergence between price and MACD on the daily chart.
5. There is persistent and strong negative divergence between price and RSI on the monthly chart. The last time this happened was October 2007 and we all know what happened after that…
6. A long held bull trend line on On Balance Volume going back to October 2014 has been breached and is no longer providing support.
7. Using Dow Theory, DJT and Nasdaq are still failing to confirm a continuation of the bull market. This does not indicate a bear market and just indicates caution.
While a bear market is unconfirmed I uncomfortably sit on the fence.
Click chart to enlarge.
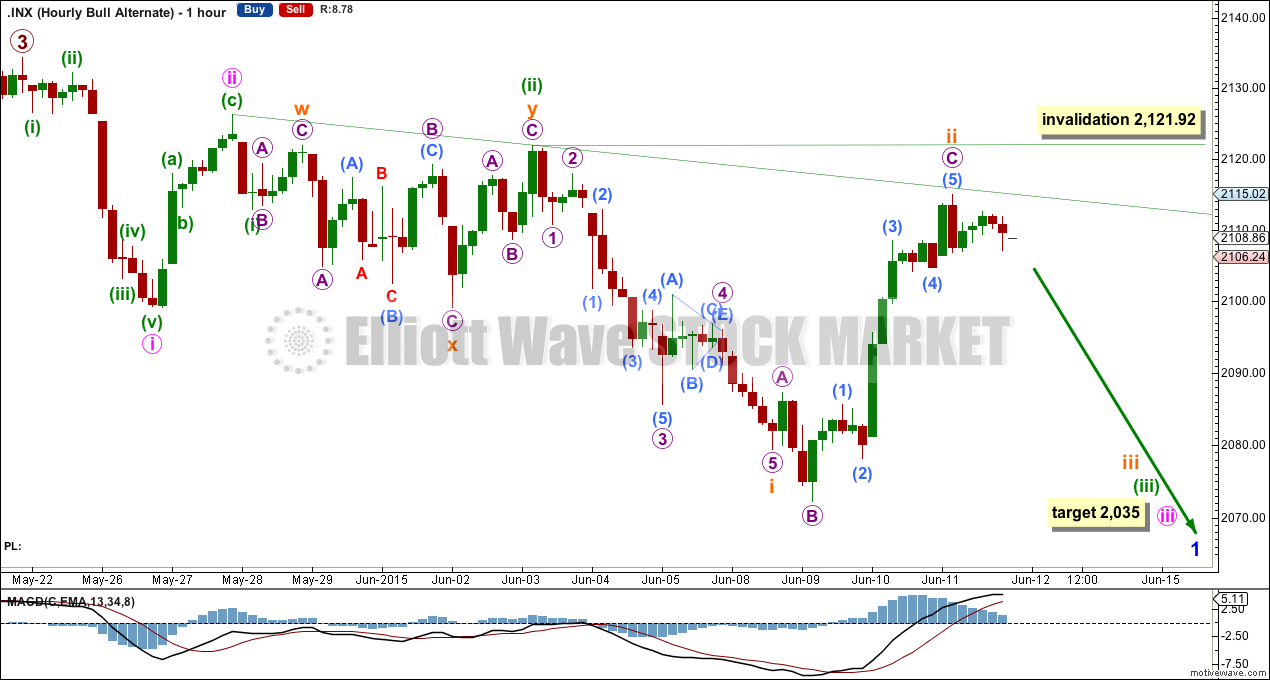
The bull alternate wave count reverts now to three overlapping first and second waves. We’ve been here before. So far it has never worked out. There is still no clear five down on the hourly chart let alone any other bearish confirmation for this wave count. It is presented with the strong caveat that it has zero confirmation. The only real indicator the trend is down comes from ADX.
A third wave extension must necessarily begin with a series of first and second waves. This happens right before the middle of the third wave takes off, and can convince us it won’t happen, right before it turns.
The green sloping trend line should show where any more upwards movement finds resistance.
At 2,035 minute wave iii would reach 2.618 the length of minute wave i.
Any further upwards movement for subminuette wave ii may not move beyond the start of subminuette wave i above 2,121.92.
If price moves above 2,121.92, then the only possibility for the alternate wave count would be a leading diagonal unfolding in its first wave position. Leading diagonals for first waves are not exactly rare, but they’re not very common either. I consider that idea to have a lower probability than the idea presented here of a series of first and second waves. If 2,121.92 is breached, this alternate would reduce further in probability.
This alternate must see a strong third wave down begin tomorrow, if it is to have any reasonable probability.
Bear Wave Count
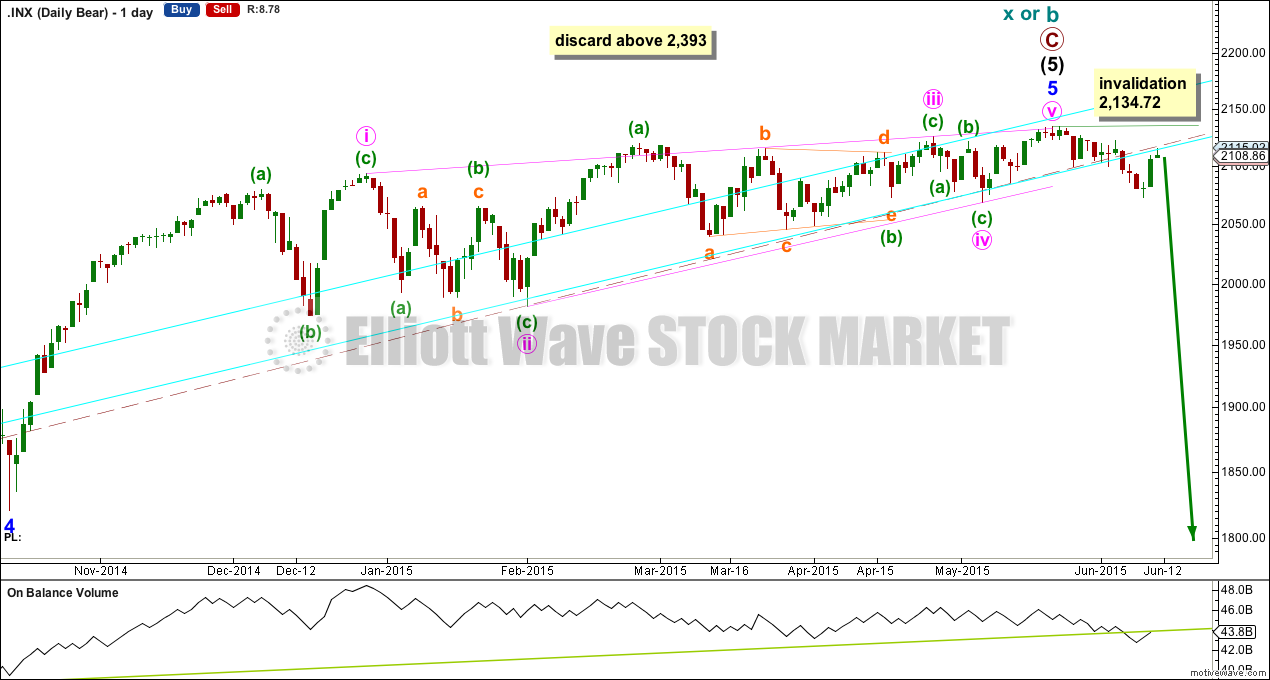
Click chart to enlarge.
The subdivisions within primary waves A-B-C are seen in absolutely exactly the same way as primary waves 1-2-3 for the alternate bull wave count.
To see the difference at the monthly chart level between the bull and bear ideas look at the last historical analysis here.
At cycle degree, wave b is over the maximum common length of 138% the length of cycle wave a, at 170% the length of cycle wave a. At 2,393 cycle wave b would be twice the length of cycle wave a and at that point this bear wave count should be discarded.
While we have no confirmation of this wave count, we should assume the trend remains the same, upwards. This wave count requires confirmation before I have confidence in it. Full and final confirmation that the market is crashing would only come with a new low below 1,370.58. However, structure and momentum should tell us long before that point which wave count is correct, bull or bear.
On Balance Volume has very now clearly breached a trend line which began back in October 2014. This may be an early warning of more downwards movement to come.
Technical Analysis
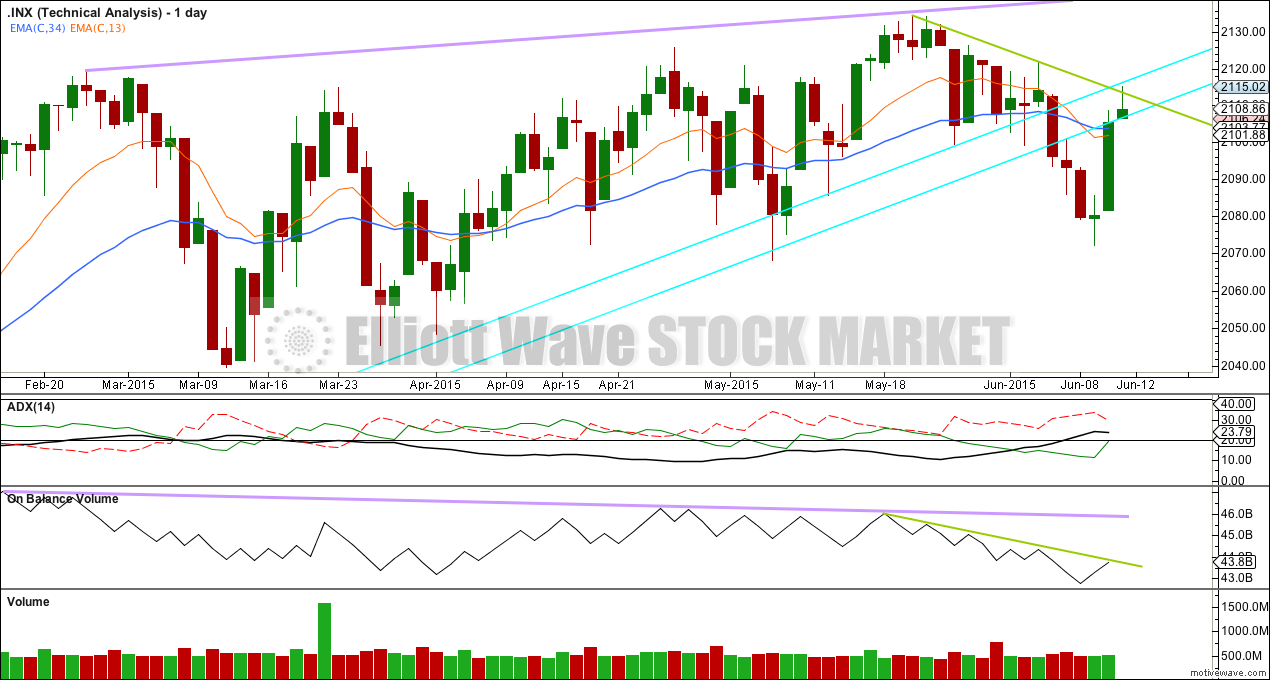
Click chart to enlarge.
ADX is rising and still above 20. This indicates the potential start of a new trend. The direction would be down.
Only when this lower aqua blue trend line is breached by a close of 3% or more of market value would a bear market be indicated. If the trend line is again breached, then a new price point 3% of market value at the breach will be calculated.
That trend line is long held (it began in November 2011), repeatedly tested and reasonably shallow so it is highly technically significant and should be respected. It remains the strongest piece of technical analysis on all charts.
On Balance Volume has turned strongly downwards. This fall in price is supported by volume.
On Balance Volume is showing negative divergence with price back to February. The recent rise in price to new all time highs is not supported by volume and so is suspicious. This may indicate that when the bear market arrives it may be deeper and more long lasting than recent corrections.
The shorter EMA has crossed below the longer EMA providing some confidence in a bear market.
Upwards movement for Thursday may have found resistance at the upper aqua blue line where it intersects with the downwards sloping green line. While lower highs have been made, OBV is also moving lower; this drop in price is supported by volume. Resistance suggests price should move lower tomorrow. If these trend lines are breached by upwards movement a downwards trend would be in doubt.
This analysis is published about 09:05 p.m. EST.