
Downwards movement was not what was expected for the main bull Elliott wave count. The alternate is yet to be confirmed though.
Summary: The main wave count must see upwards movement on Monday. The new target is at 2,152. The alternate expects price to continue to move lower towards 2,069, but it is completely unconfirmed. It requires confirmation below 2,067.93 at minimum for any confidence.
To see a weekly chart and how to draw trend lines go here.
Changes to last analysis are italicised.
Bull Wave Count
Click chart to enlarge.
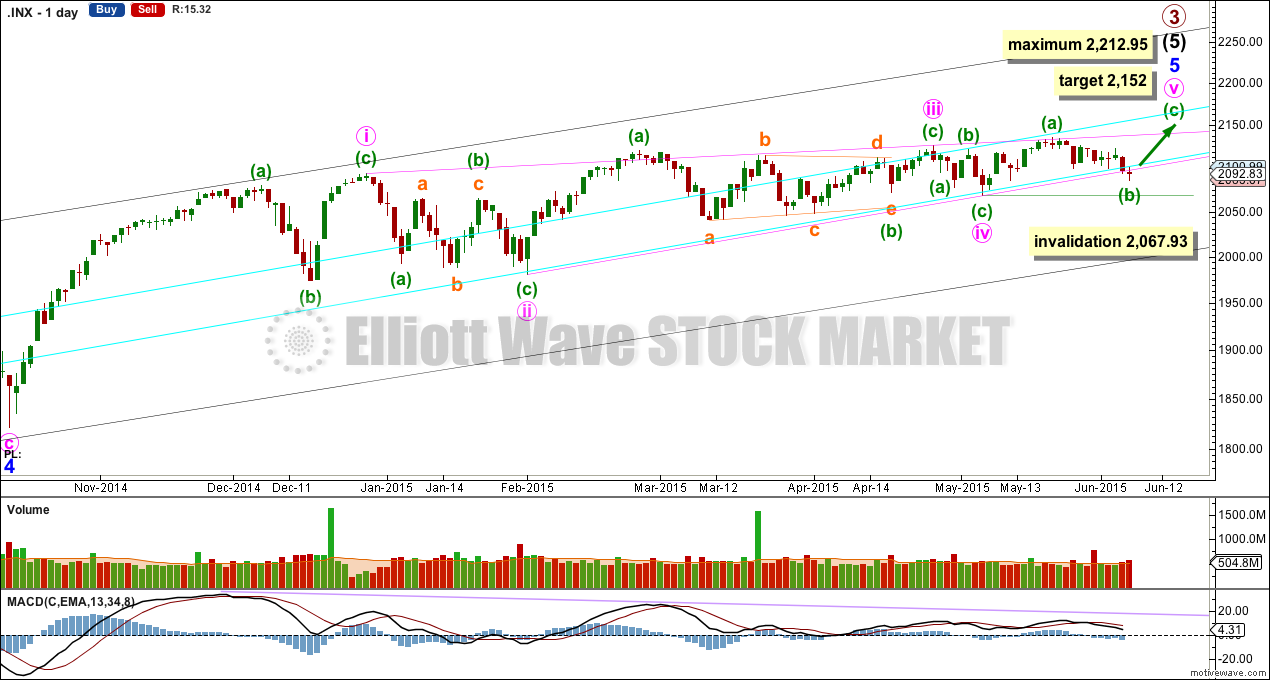
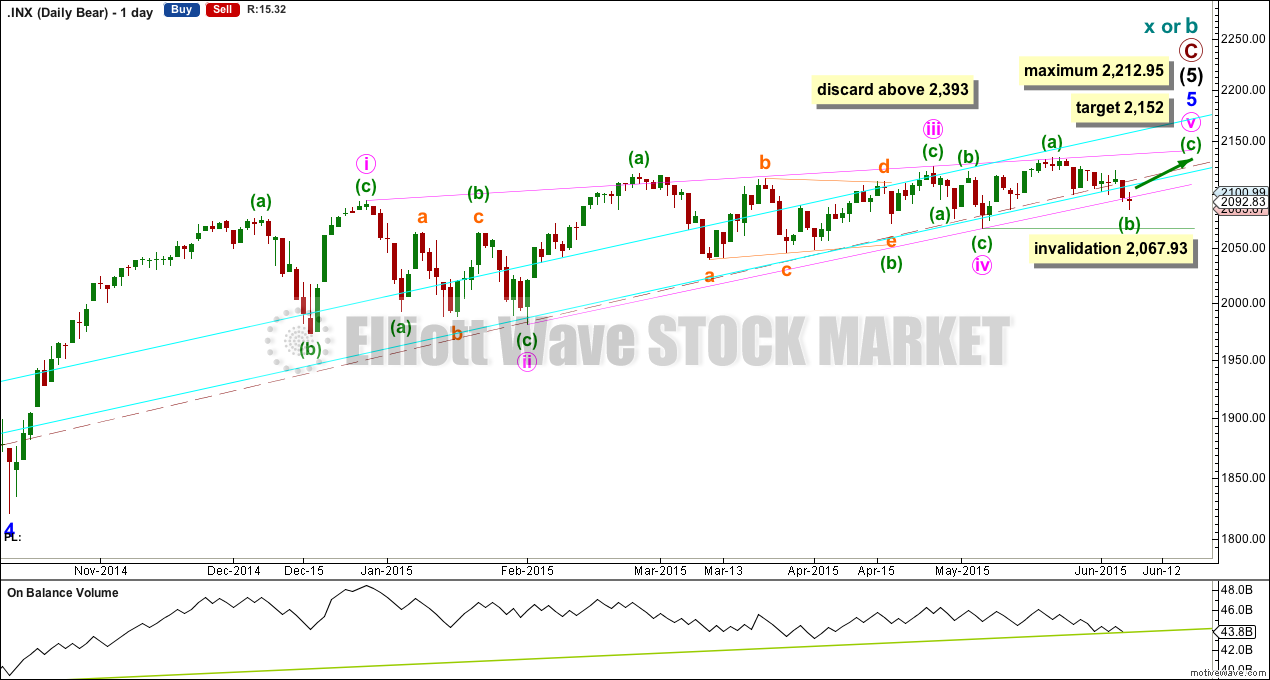
The bull wave count sees primary 1-2-3 within an impulse for a cycle degree wave V.
The bear wave count sees primary A-B-C zigzag for a cycle degree B wave.
The triangle is invalidated. Minuette wave (b) must have ended at the low on Thursday, or very close to it indeed, because the lower pink ii-iv trend line of the diagonal should provide strong support if this structure is incomplete. Minuette wave (c) must begin from here. At 2,160 minuette wave (c) would reach equality in length with minuette wave (a).
Downward movement for Thursday has reached a point of very strong support from the lower aqua blue line and the lower pink ii-iv diagonal trend line. It would be entirely reasonable to expect some upwards movement on Friday from this point.
The diagonal of minor wave 5 is contracting so minute wave v must be shorter than minute wave iii. Minute wave iii may not be the shortest wave. At 2,212.95 minute wave v would reach its maximum length at equality with minute wave iii.
Contracting diagonals most often end with a reasonably strong overshoot of the 1-3 trend line. The target would see this.
The diagonal trend lines are converging, and they are getting to be quite close together. This structure must end before the diagonal trend lines cross over which would be on 3rd August.
Minuette wave (b) may not move beyond the start of minuette wave (a) below 2,067.93.
Diagonals normally adhere well to their trend lines. This one has small overshoots and one small breach at minuette wave (a) within minute wave iii. Today again saw an overshoot, this time of the lower ii-iv trend line. A small overshoot is okay. But if this turns into a clear breach next week, this wave count will reduce in probability.
Click chart to enlarge.
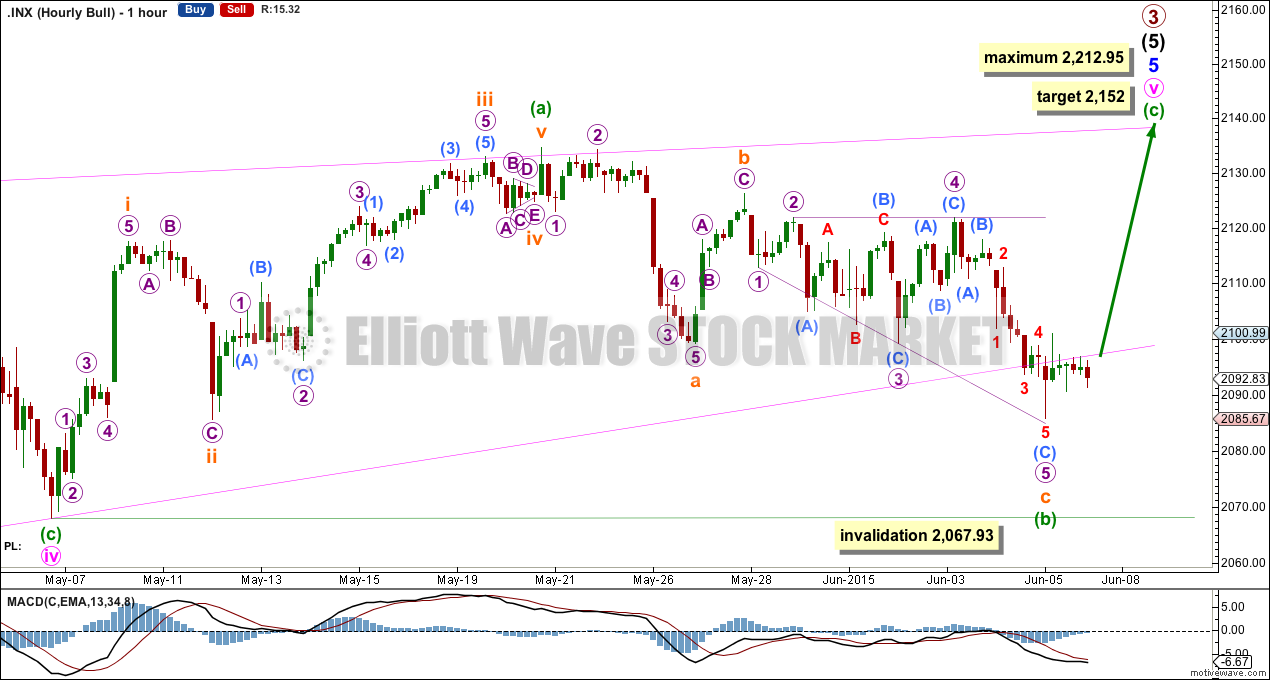
Minuette wave (b) has continued a little lower, remaining above the invalidation point.
There are two hourly candlesticks below the lower ii-iv diagonal trend line. But this downwards movement is unconvincing as a third wave down (alternate bull).
Despite the breach of the diagonal trend line this main bull wave count is still favoured. A bounce up on Monday still looks most likely.
At 2,152 minuette wave (c) would reach equality in length with minuette wave (a).
This wave count now must see upwards movement on Monday. If the diagonal trend line is breached by a clear downwards movement on the daily chart, the probability of this wave count will reduce. It is only invalidated with a new low below 2,067.93.
Alternate Bull Wave Count
Click chart to enlarge.
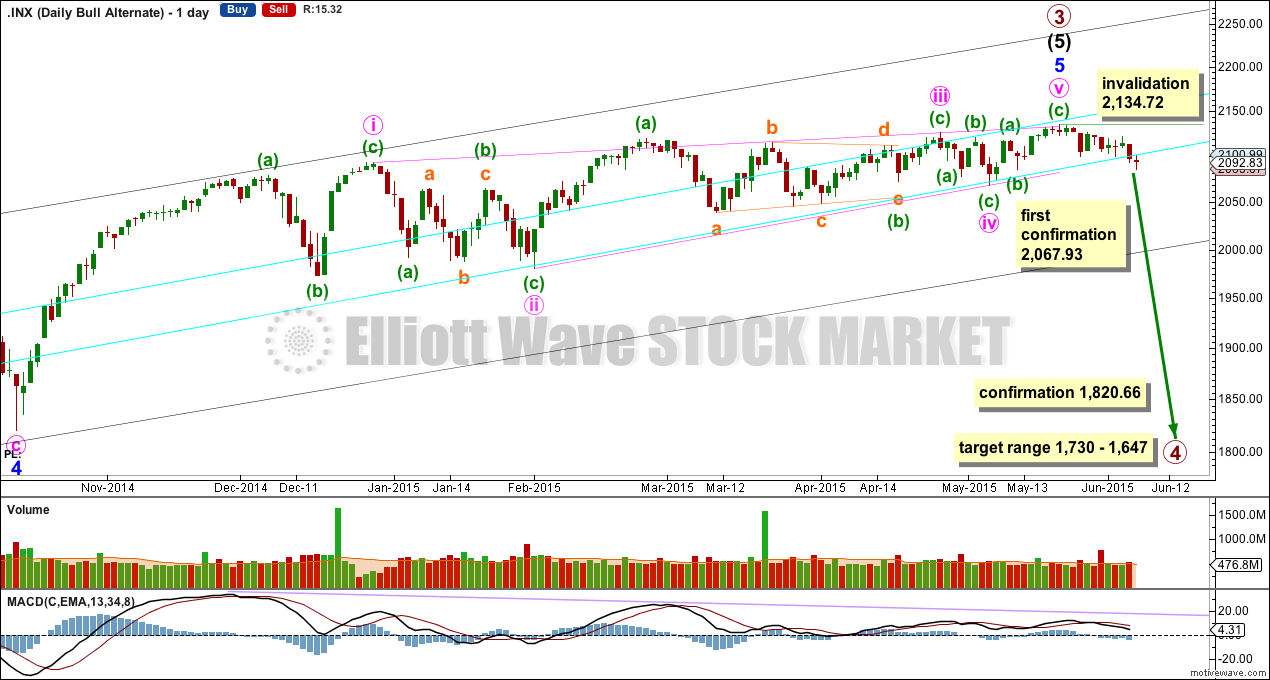
It is possible that the S&P has seen a primary degree (or for the bear count below a cycle degree) trend change eleven days ago.
This wave count absolutely requires confirmation at the daily chart level before any confidence may be had in a primary (or cycle) degree trend change. Confirmation would come with:
1. A new low below 2,067.93.
2. A close of 3% or more of market value below the lower aqua blue trend line.
3. A clear five down on the daily chart.
4. A new low below 1,820.66.
As each condition is met the probability of a substantial trend change would increase.
Primary wave 4 would most likely be a time consuming flat, triangle or combination in order to exhibit structural alternation with the zigzag of primary wave 2. Primary wave 2 lasted 12 weeks. Primary wave 4 is likely to be longer in duration because combinations and triangles particularly are more time consuming than zigzags which tend to be quick corrections. Primary wave 4 may be expected to last more than 12 weeks, and may end with a total Fibonacci 13 or more likely 21 weeks.
For this more bearish wave count to be taken seriously it still requires confirmation at least below 2,067.93.
Click chart to enlarge.
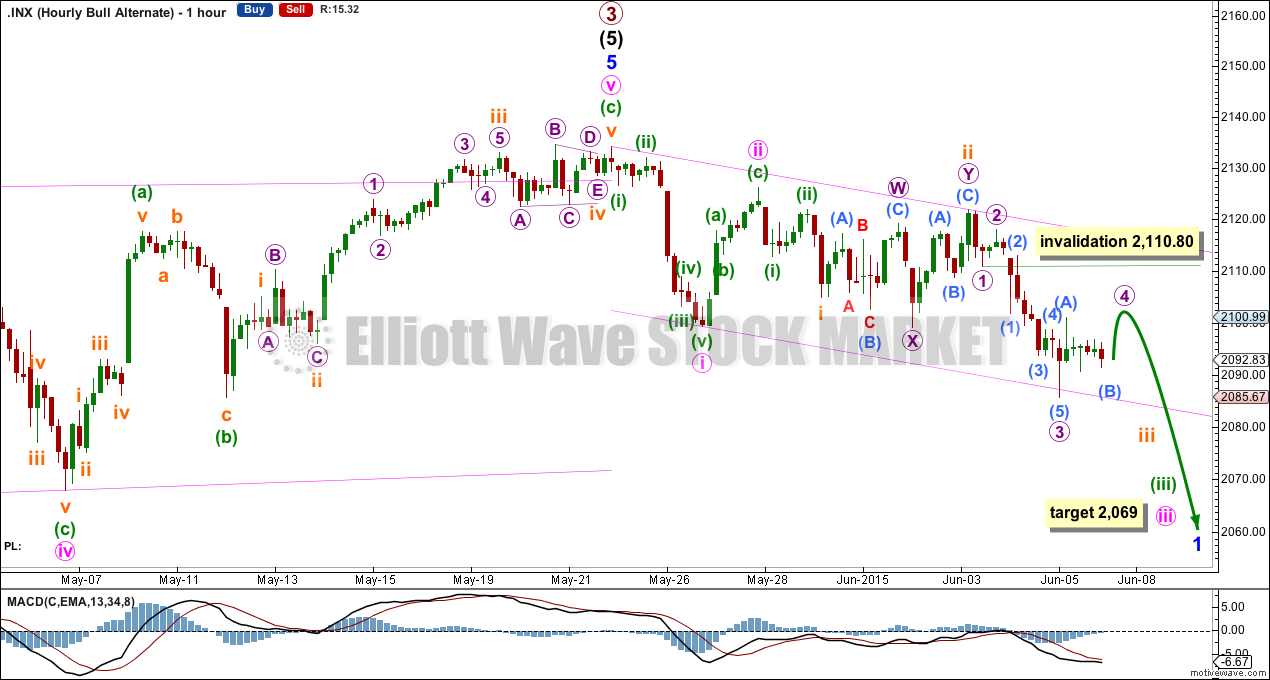
If this downwards movement is a third wave, it is unconvincing. Momentum has not yet increased beyond minute wave i and the base channel has not been breached to the downside. Both of these things need to be seen for a third wave to be confirmed.
At 2,069 minute wave iii would reach 1.618 the length of minute wave i.
Within the middle of the third wave, micro wave 4 may not move into micro wave 1 price territory above 2,110.80. Invalidation of this alternate wave count at the hourly chart level would provide confidence in the main wave count.
Bear Wave Count
Click chart to enlarge.
The subdivisions within primary waves A-B-C are seen in absolutely exactly the same way as primary waves 1-2-3 for the bull wave count.
To see the difference at the monthly chart level between the bull and bear ideas look at the last historical analysis here.
At cycle degree wave b is over the maximum common length of 138% the length of cycle wave a, at 170% the length of cycle wave a. At 2,393 cycle wave b would be twice the length of cycle wave a and at that point this bear wave count should be discarded.
While we have no confirmation of this wave count we should assume the trend remains the same, upwards. This wave count requires confirmation before I have confidence in it. Full and final confirmation that the market is crashing would only come with a new low below 1,370.58. However, structure and momentum should tell us long before that point which wave count is correct, bull or bear.
On Balance Volume has very slightly breached a trend line which began back in October 2014. This may be an early warning of more downwards movement to come.
Technical Analysis
Click chart to enlarge.
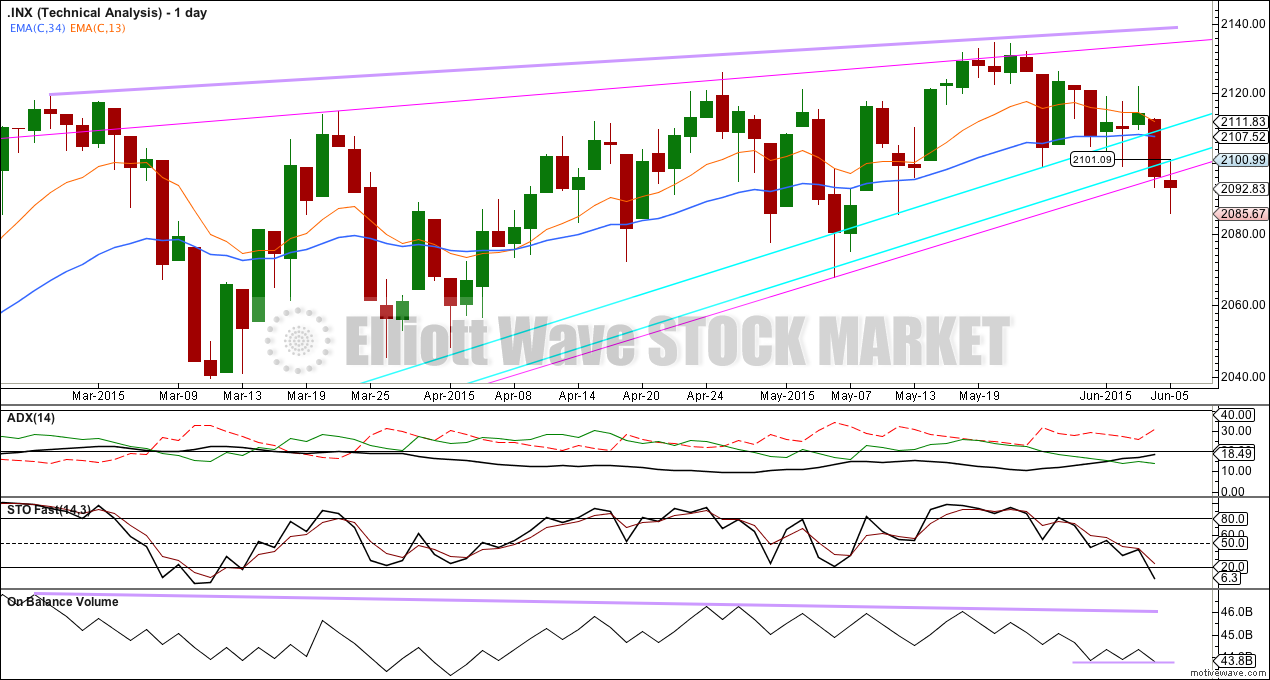
ADX is rising and above 15. This indicates the potential start of a new trend. The direction would be down.
While price remains above the lower aqua blue trend line a bull market should be assumed to remain intact. Only when this lower aqua blue trend line is breached by a close of 3% or more of market value would a bear market be indicated. That would require a close at 2,038 or below.
That trend line is long held (it began in November 2011), repeatedly tested and reasonably shallow so it is highly technically significant. It should be respected. It remains the strongest piece of technical analysis on this chart.
On Balance Volume for the last few days is flat. This fall in price is not supported by volume and so is suspicious.
On Balance Volume is showing negative divergence with price back to February. The recent rise in price to new all time highs is not supported by volume and so is suspicious. This may indicate that when the bear market arrives it may be deeper and more long lasting than recent corrections.
I have drawn the diagonal trend lines on this chart today. The lower pink trend line is overshot but not properly breached. There was a prior breach on the upside for the daily candlestick of 25th February. We may be about to see a similar situation again on the downside.
The shorter EMA needs to cross below the longer EMA to provide further confidence in a bear market.
This analysis is published about 07:22 p.m. EST.