
Upwards movement was expected, but price moved sideways to complete a small red doji. A new low during Tuesday’s session breached the invalidation point on the hourly chart by 0.02 points.
Summary: Sideways movement was the continuation of a B wave triangle. The triangle is incomplete. I expect some sideways movement for another day or so, to be followed by new all time highs. ADX has for the first time in a long while turned up just above 15 on Monday. This indicates the start of a new trend, but the direction indicated by ADX is down. Price remains above the bull market trend line and above a 55day EMA indicating the trend may be up. The situation is unclear.
To see a weekly chart and how to draw trend lines go here.
Changes to last analysis are italicised.
Bull Wave Count
Click chart to enlarge.
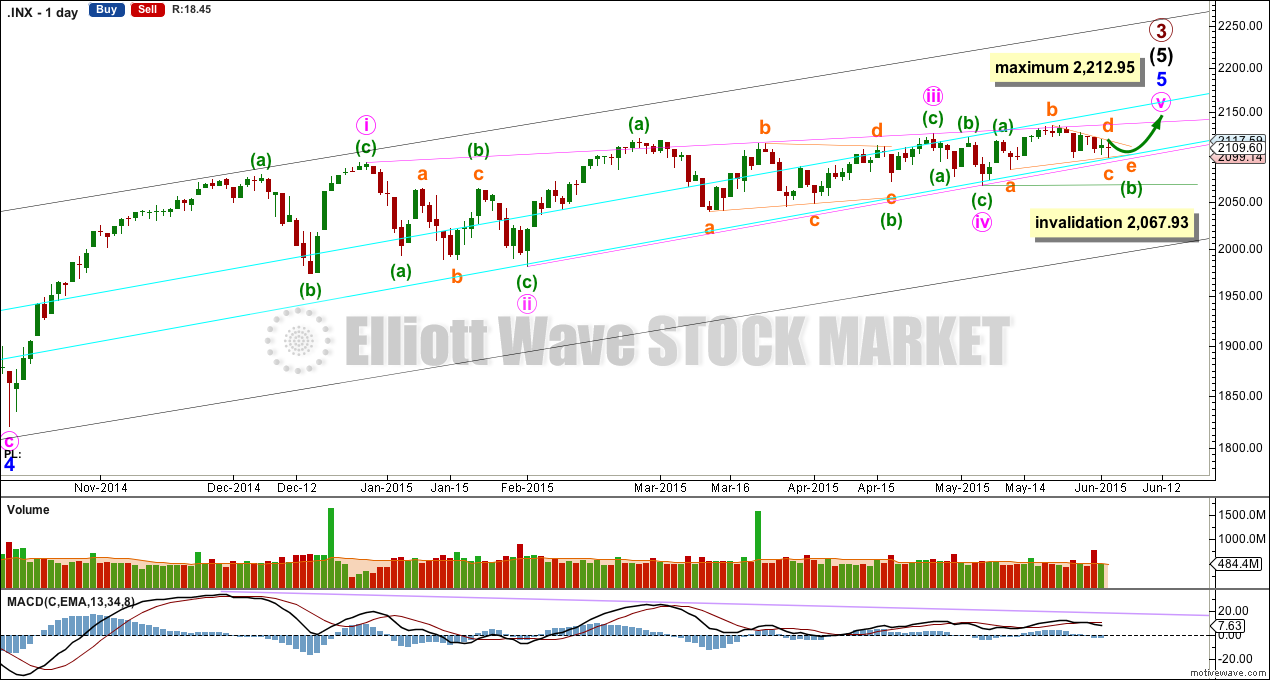
The bull wave count sees primary 1-2-3 within an impulse for a cycle degree wave V.
The bear wave count sees primary A-B-C zigzag for a cycle degree B wave.
Recent sideways movement including Tuesday’s doji fits nicely still as a triangle, but now the triangle must be incomplete. When minuette wave (b) may again be complete then a new target for minuette wave (c) up will be calculated. It may be expected to be equal in length with minuette wave (a) at 49.73 points.
The diagonal of minor wave 5 is contracting so minute wave v must be shorter than minute wave iii. Minute wave iii may not be the shortest wave. At 2,212.95 minute wave v would reach its maximum length at equality with minute wave iii.
Contracting diagonals most often end with a reasonably strong overshoot of the 1-3 trend line. The target would see this.
The diagonal trend lines are converging, and they are getting to be quite close together. This structure must end before the diagonal trend lines cross over which would be on 3rd August. Because the trend lines are now very close together, I would expect a quicker end to this final wave up, which may be this week or early next week.
Minuette wave (b) may not move beyond the start of minuette wave (a) below 2,067.93.
Click chart to enlarge.
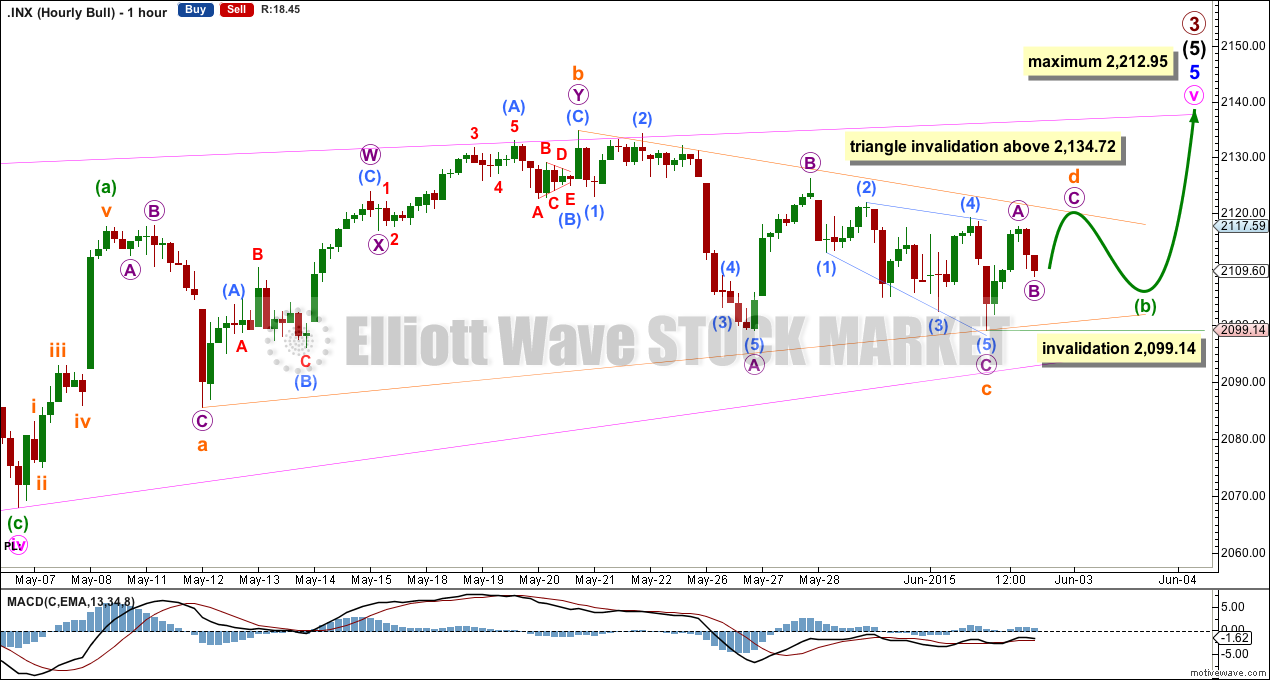
The hourly chart shows all of minute wave v zigzag.
Minuette wave (b) is now an incomplete running contracting triangle. Within a contracting triangle, subminuette wave c may not move beyond the end of subminuette wave a below 2,085.57, subminuette wave d may not move beyond the end of subminuette wave b above 2,134.72 and subminuette wave e may not move beyond the end of subminuette wave c below 2,099.14.
It is now extremely likely that subminuette wave c of the triangle is complete. Submineutte wave d is probably incomplete; it should look like a clear three wave structure on the hourly chart.
It is also possible that minuette wave (b) may complete as a barrier triangle. For a barrier triangle subminuette wave d should end about the same level as subminuette wave b at 2,134.72 so that the b-d trend line of the triangle is essentially flat. In practice this means that subminuette wave d may end slightly above 2,134.72 and so this upper price point to invalidate the triangle is not black and white. This is the only Elliott wave rule which has any grey area. If price rises to slightly above 2,134.72 then it would be the structure of upwards movement which may indicate if the triangle is over or not; if it is a clear three then it’s probably subminuette wave d of a barrier triangle.
When minuette wave (b) is a complete triangle, then a five wave structure to new all time highs should unfold upwards for minuette wave (c) which is most likely to be about even in length with minuette wave (a) at 49.73 points, and most likely to comfortably overshoot the upper pink i-iii trend line of the diagonal.
Alternate Bull Wave Count
Click chart to enlarge.
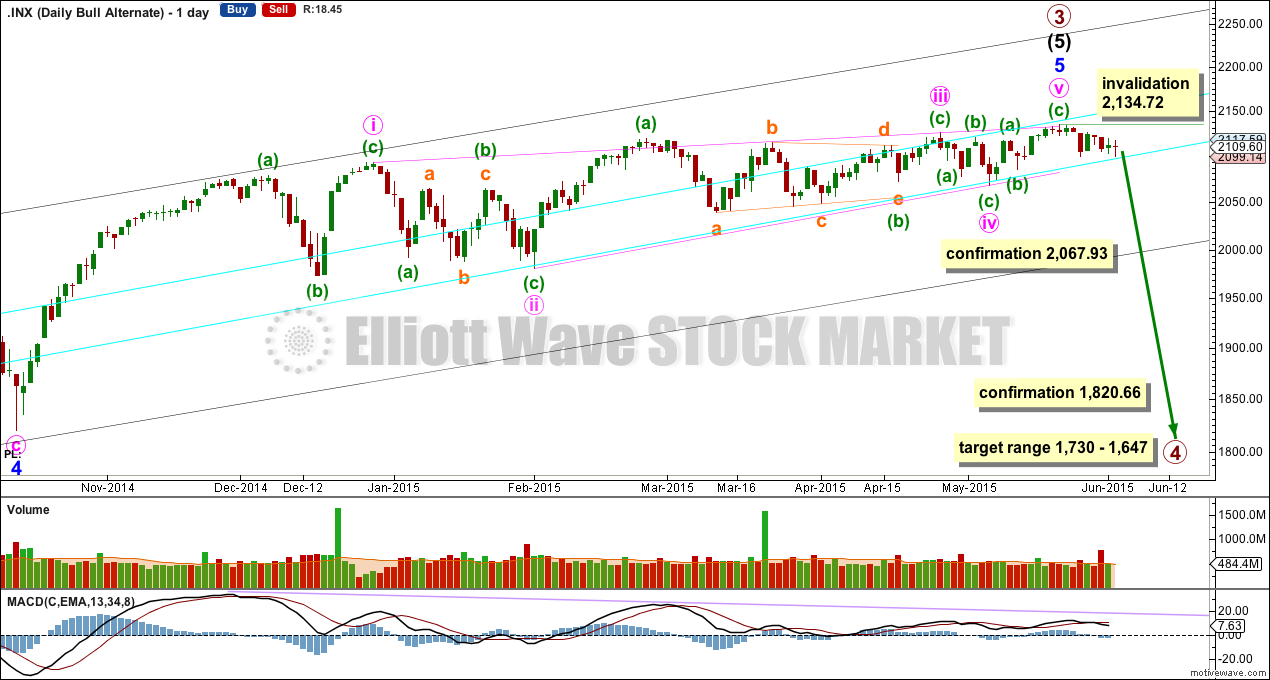
It is possible that the S&P has seen a primary degree (or for the bear count below a cycle degree) trend change eight days ago.
This wave count absolutely requires confirmation at the daily chart level before any confidence may be had in a primary (or cycle) degree trend change. Confirmation would come with:
1. A close of 3% or more of market value below the lower aqua blue trend line.
2. A clear five down on the daily chart.
3. A new low below 1,820.66.
As each condition is met the probability of a substantial trend change would increase.
Primary wave 4 would most likely be a time consuming flat, triangle or combination in order to exhibit structural alternation with the zigzag of primary wave 2. Primary wave 2 lasted 12 weeks. Primary wave 4 is likely to be longer in duration because combinations and triangles particularly are more time consuming than zigzags which tend to be quick corrections. Primary wave 4 may be expected to last more than 12 weeks, and may end with a total Fibonacci 13 or more likely 21 weeks.
Bear Wave Count
Click chart to enlarge.
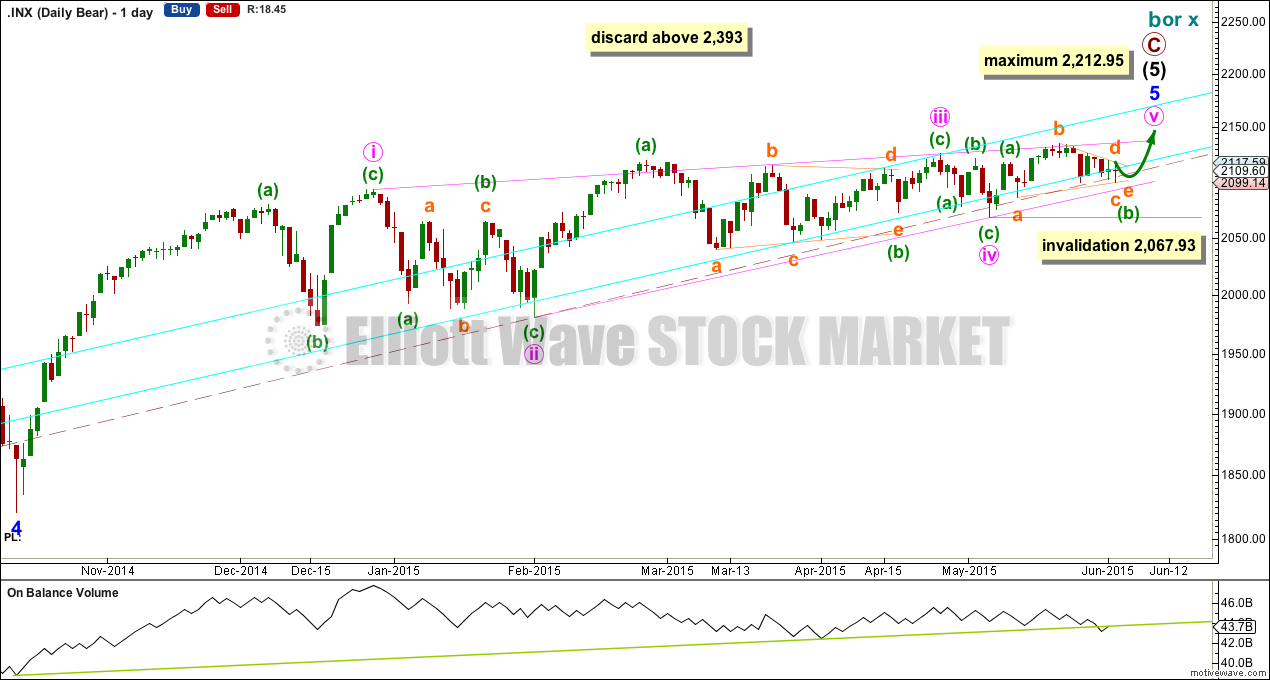
The subdivisions within primary waves A-B-C are seen in absolutely exactly the same way as primary waves 1-2-3 for the bull wave count.
To see the difference at the monthly chart level between the bull and bear ideas look at the last historical analysis here.
At cycle degree wave b is over the maximum common length of 138% the length of cycle wave a, at 170% the length of cycle wave a. At 2,393 cycle wave b would be twice the length of cycle wave a and at that point this bear wave count should be discarded.
While we have no confirmation of this wave count we should assume the trend remains the same, upwards. This wave count requires confirmation before I have confidence in it. Full and final confirmation that the market is crashing would only come with a new low below 1,370.58. However, structure and momentum should tell us long before that point which wave count is correct, bull or bear.
On Balance Volume has very slightly breached a trend line which began back in October 2014. This may be an early warning of more downwards movement to come.
Technical Analysis
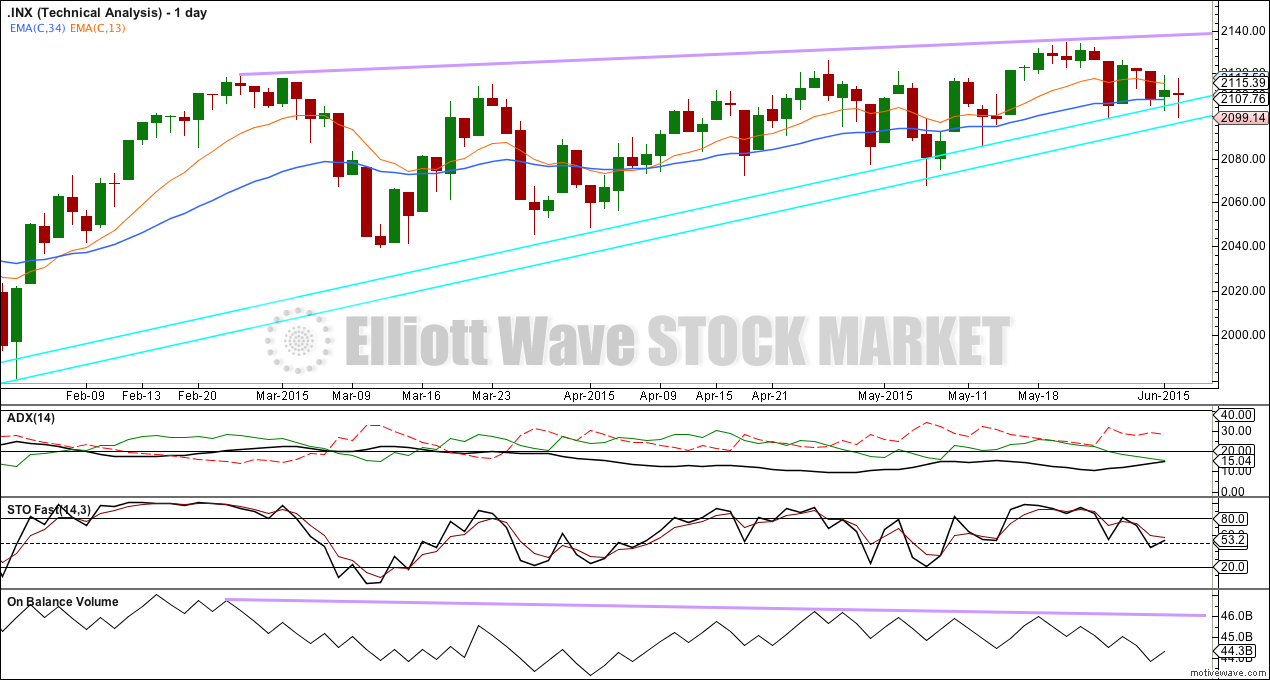
Click chart to enlarge.
For Monday’s session ADX has turned up and is above 15 for the first time in a long while. This may be the first indicator of the early stages of a new trend. With the +DX line (solid green) is below the -DX line (dashed red), the DX lines indicate the trend is down.
At this stage, this traditional TA approach tells us to use a trend following system now (as opposed to a range bound system).
A possible trend following system may be to use DX indicators with a moving average crossover system and trend lines to provide support / resistance.
In this case, the approach I have chosen is two EMAs of Fibonacci numbers, 13 and 34. The shorter EMA is above the longer, indicating an upwards trend still. But the DX indicators have the negative line above the positive, indicating a possible downwards trend. Price remains above the long held bull market trend line.
It is my judgement that the strongest trend indicator at this time is the lower aqua blue trend line. This line has provided strong support since November 2011, has been repeatedly tested, is reasonably shallow, and so it is highly technically significant. It is a very simple instrument indicating the bull market most likely remains intact. While price remains above this trend line any downwards movements should be initially considered to most likely be corrections against the trend. This trend line must be respected.
The DX indicators may be expecting a downwards correction to find support at or just below the lower aqua blue line. If the short term trend is down, then it may not last long and may not move very far. The moving averages indicate an upwards trend remains intact. The situation is unclear.
Only when the bull market trend line is breached by a close of 3% or more of market value would a larger bear move be indicated.
On Balance Volume continues to diverge with price; this price rise is not supported by volume and so remains suspicious. This may be an indicator of a bigger downwards move to come, maybe the DX lines are the earliest warning of an upcoming bear market?
This analysis is published about 08:08 p.m. EST.