
This Elliott wave count presents the bull count first as more likely. While price remains above the bull trend line, I will assume that Nasdaq remains in a bull market.
We should always assume the trend remains the same, until proven otherwise.
Click charts to enlarge.
Bull Wave Count
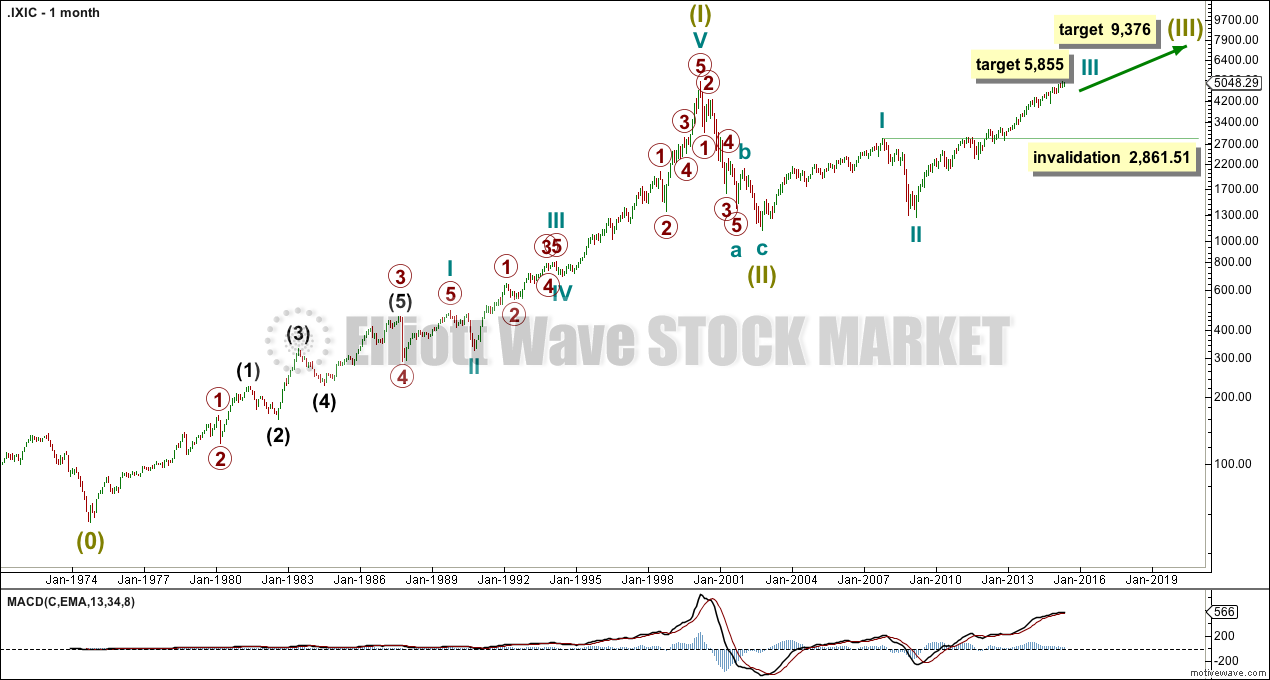
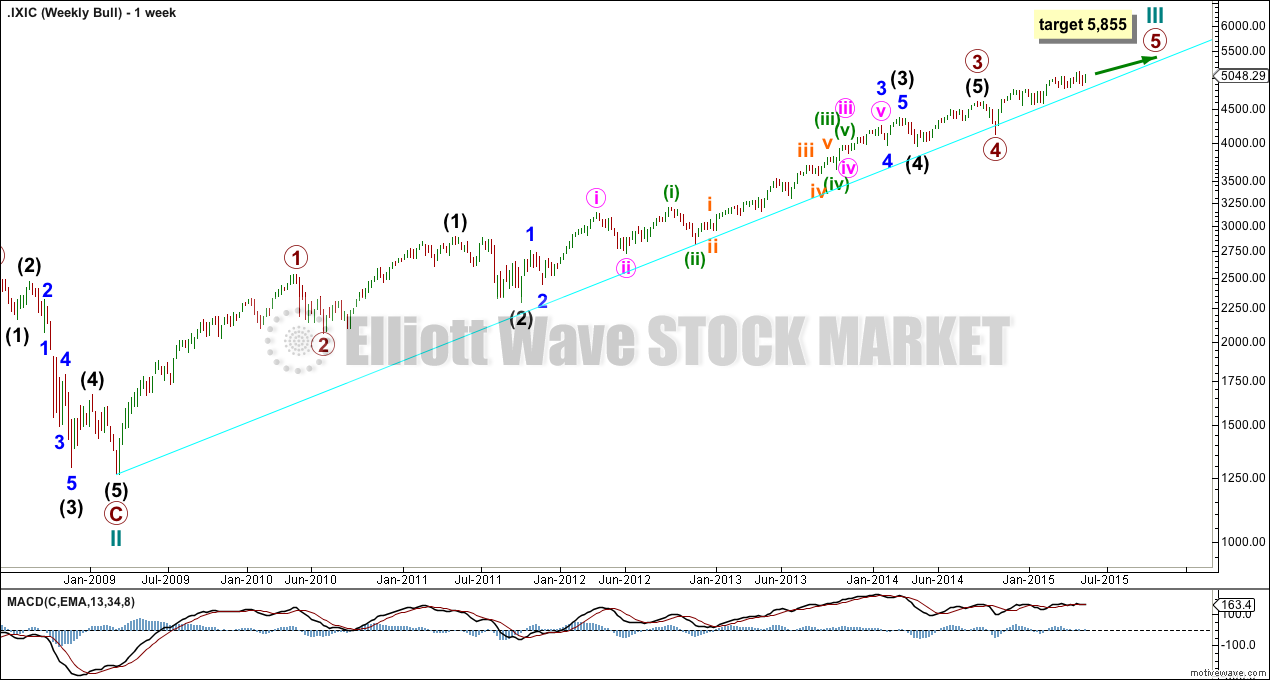
At 5,855 cycle wave III would reach 1.618 the length of cycle wave I.
At 9,376 super cycle wave (III) would reach 1.618 the length of super cycle wave (I).
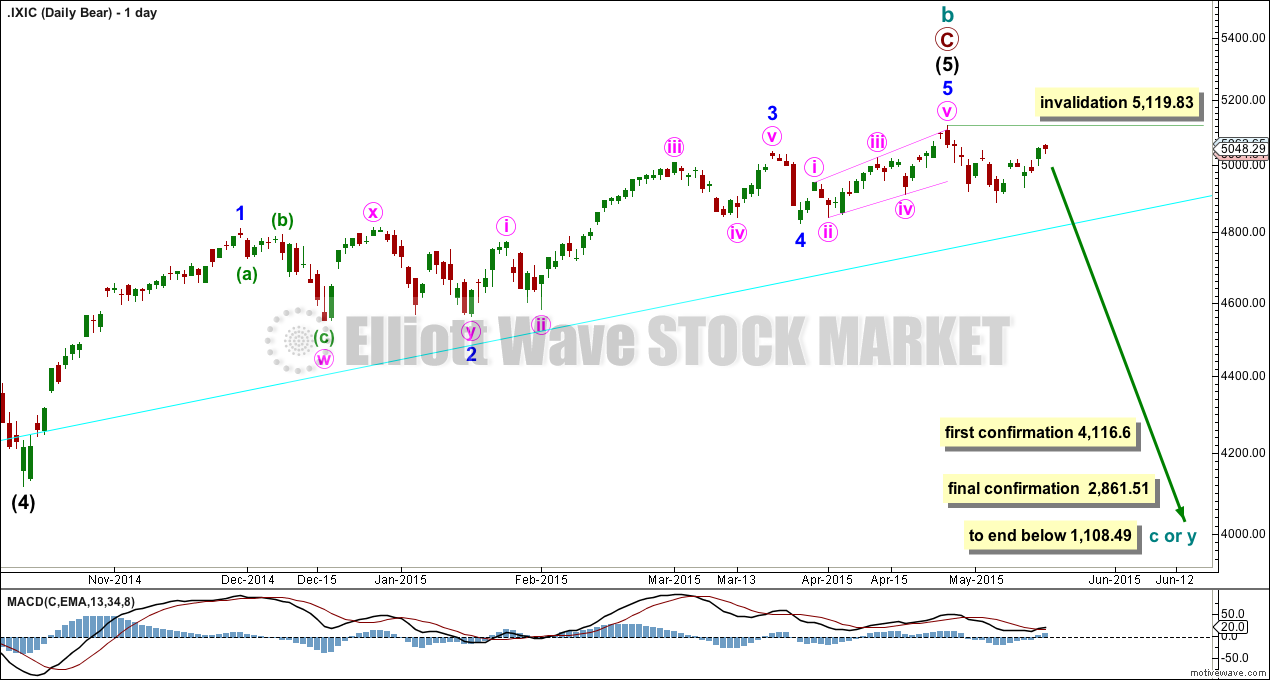
Cycle wave IV may not move into cycle wave I price territory below 2,861.51.
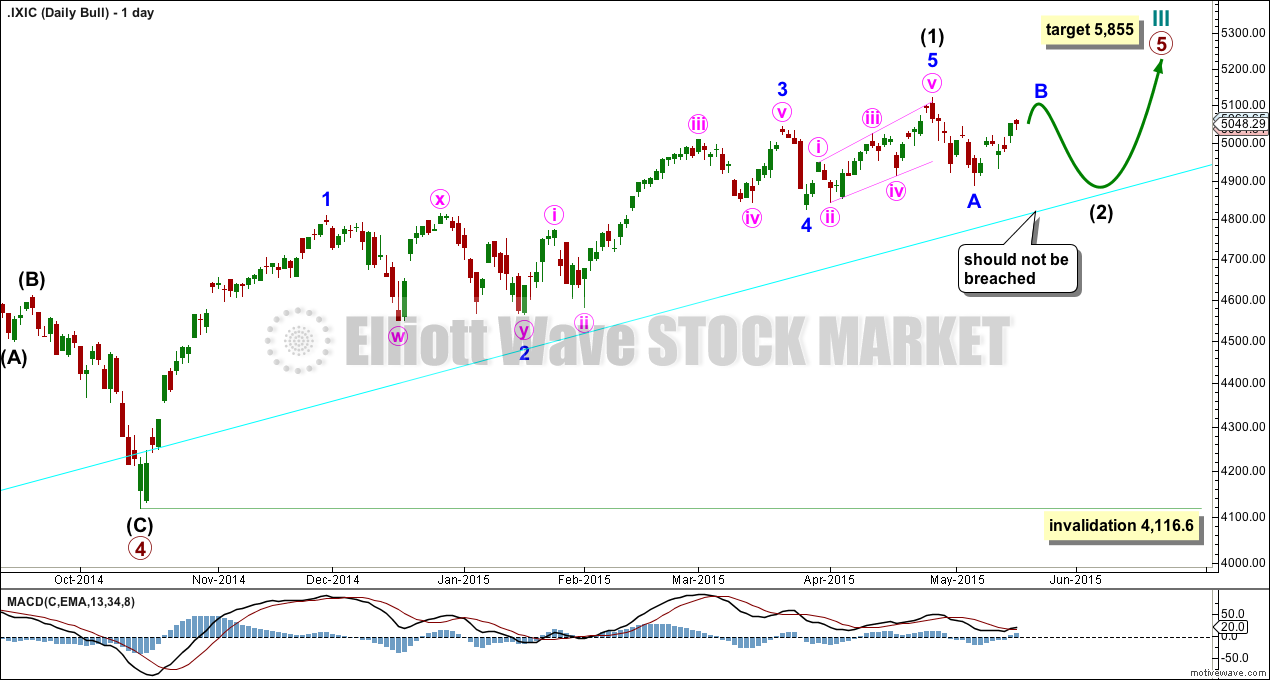
Intermediate wave (2) may not move beyond the start of intermediate wave (1) below 4,116.60. However, if the bull trend line (aqua blue) is breached by a close of 3% or more of market value this wave count should be discarded.
Daily Bull Alternate
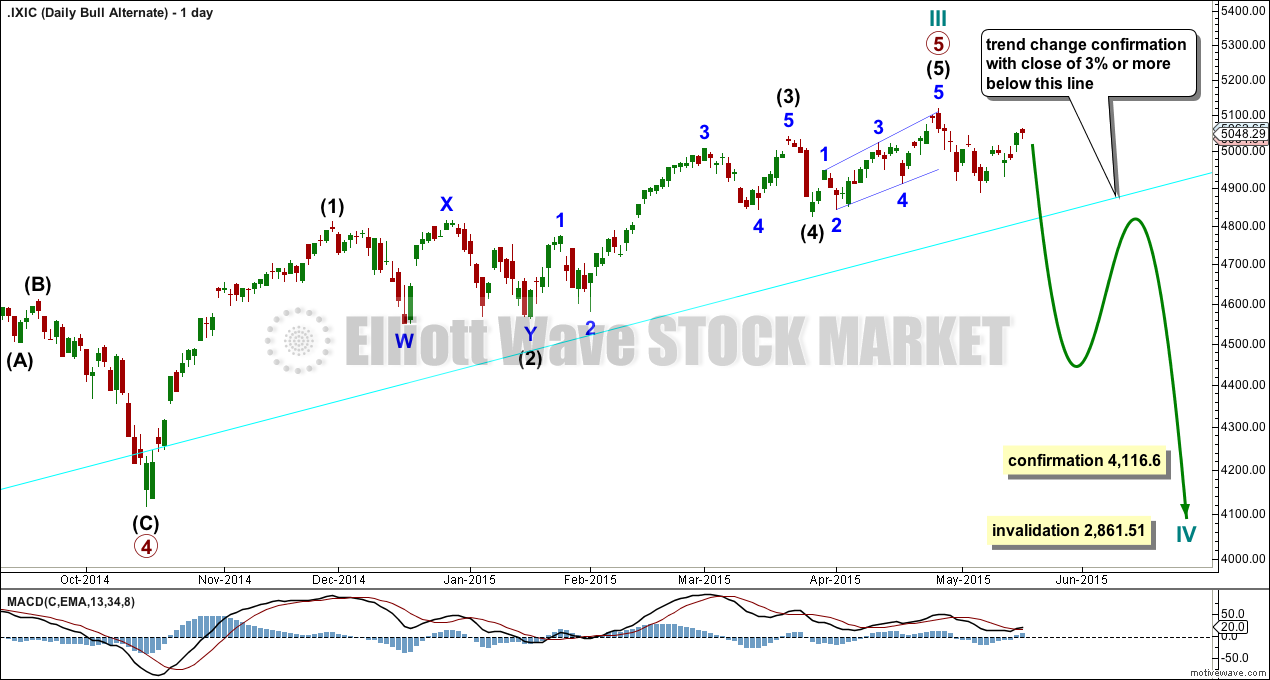
By simply moving the last impulse up one degree it is possible that Nasdaq has just seen a cycle degree trend change. This is unlikely at this stage.
Bear Wave Count
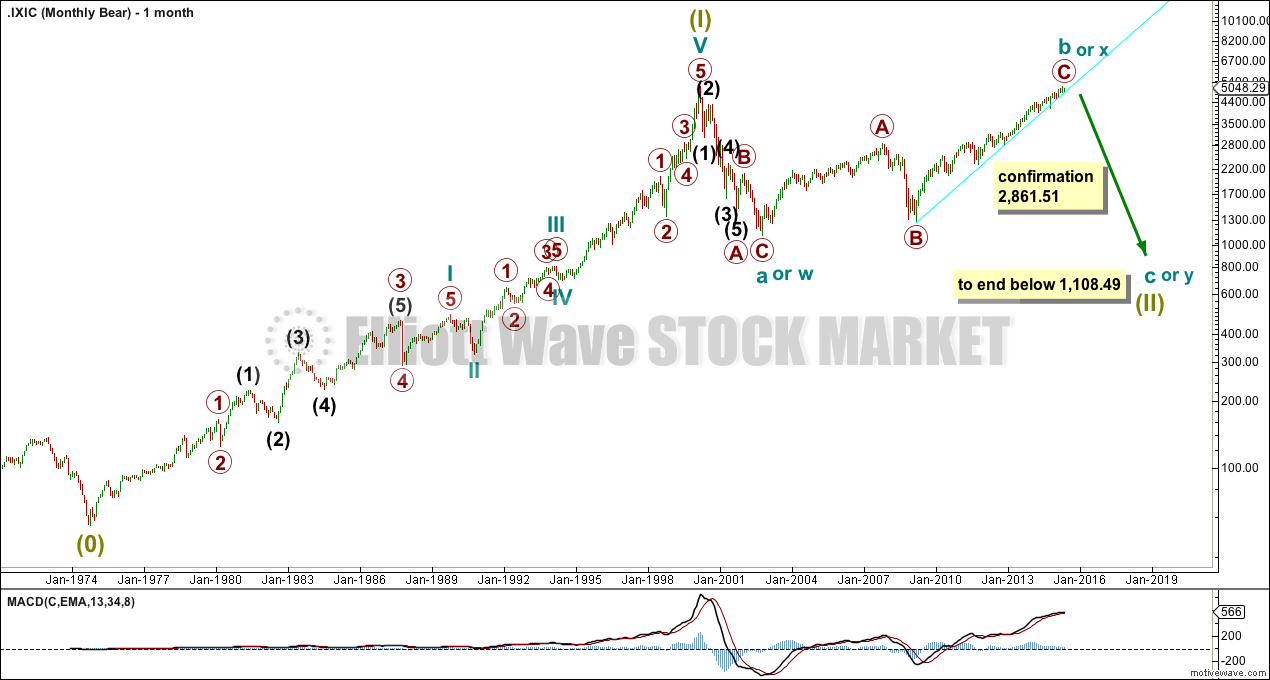
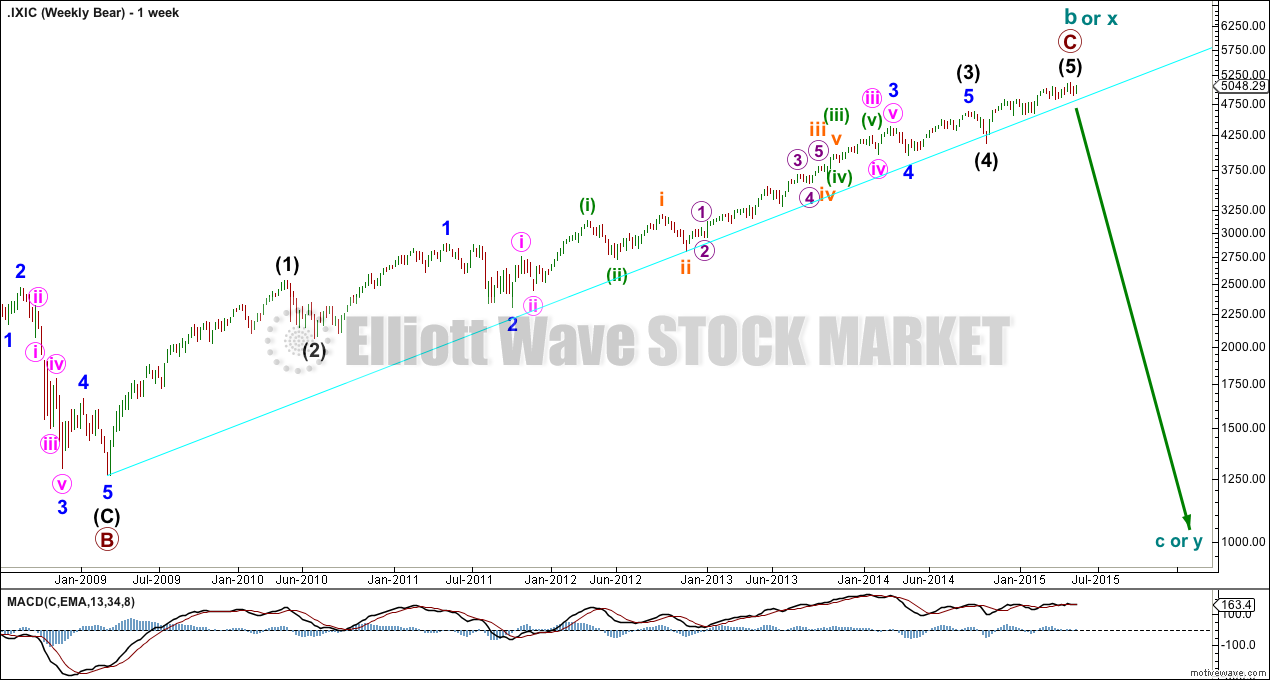
The bear wave count just moves everything from the all time high at 5,132.52 all down one degree. Super cycle wave (II) may be an incomplete flat or combination.
Technical Analysis
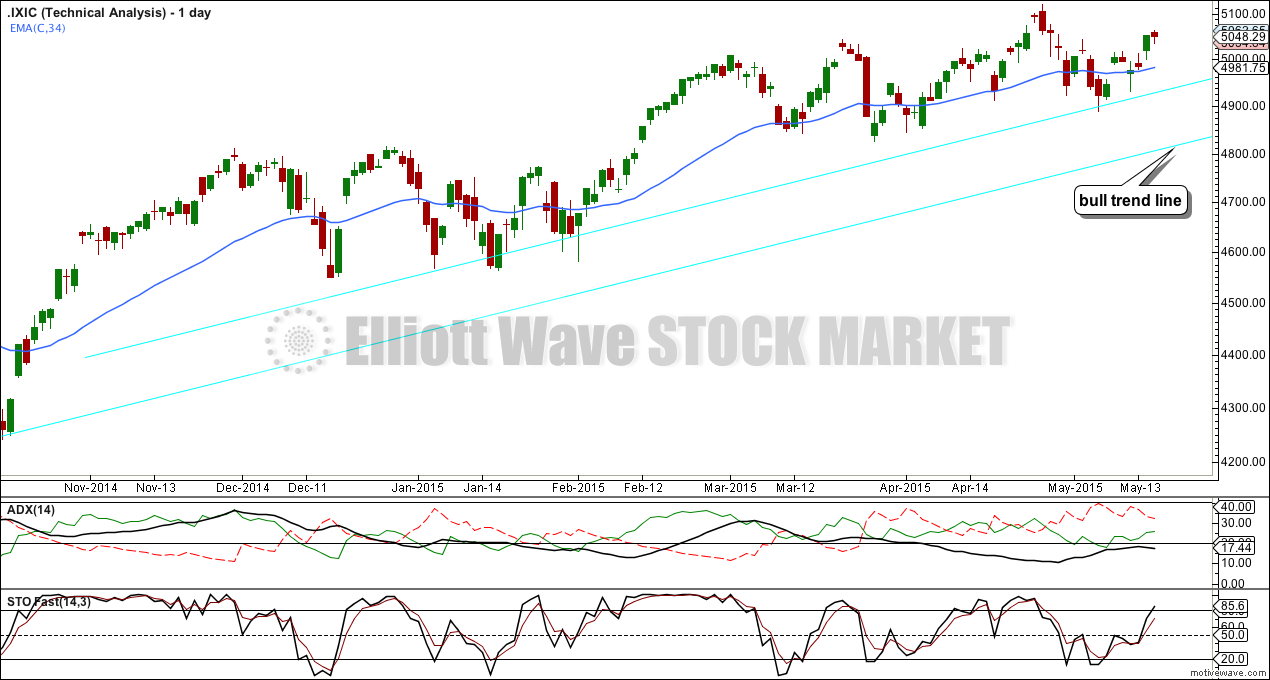
ADX is below 20 and flat indicating low volatility, very short swings and no clear trend.
An upwards trend is still favoured while price is above the 34 day EMA and particularly above the bull trend line. A parallel copy of the bull trend line is created to show where price is currently finding support.