
Yesterday’s Elliott wave analysis expected it was more likely for a third wave up to begin on Thursday which is exactly what happened.
Summary: Overall upwards movement should continue until the upper pink i-iii trend line of the diagonal is overshot. The target remains at 2,135 but this may be too low. When a target can be calculated at a second wave degree it may change. The short term expects a third wave to end about 2,127 before a small fourth wave correction begins.
Click charts to enlarge.
To see a weekly chart and how to draw trend lines go here.
Bull Wave Count
The bull wave count sees primary 1-2-3 within an impulse for a cycle degree wave V.
The bear wave count sees primary A-B-C zigzag for a cycle degree B wave.
The subdivisions for this upwards movement for both bull and bear wave counts are 5-3-5. The wave counts don’t diverge and won’t for months yet.
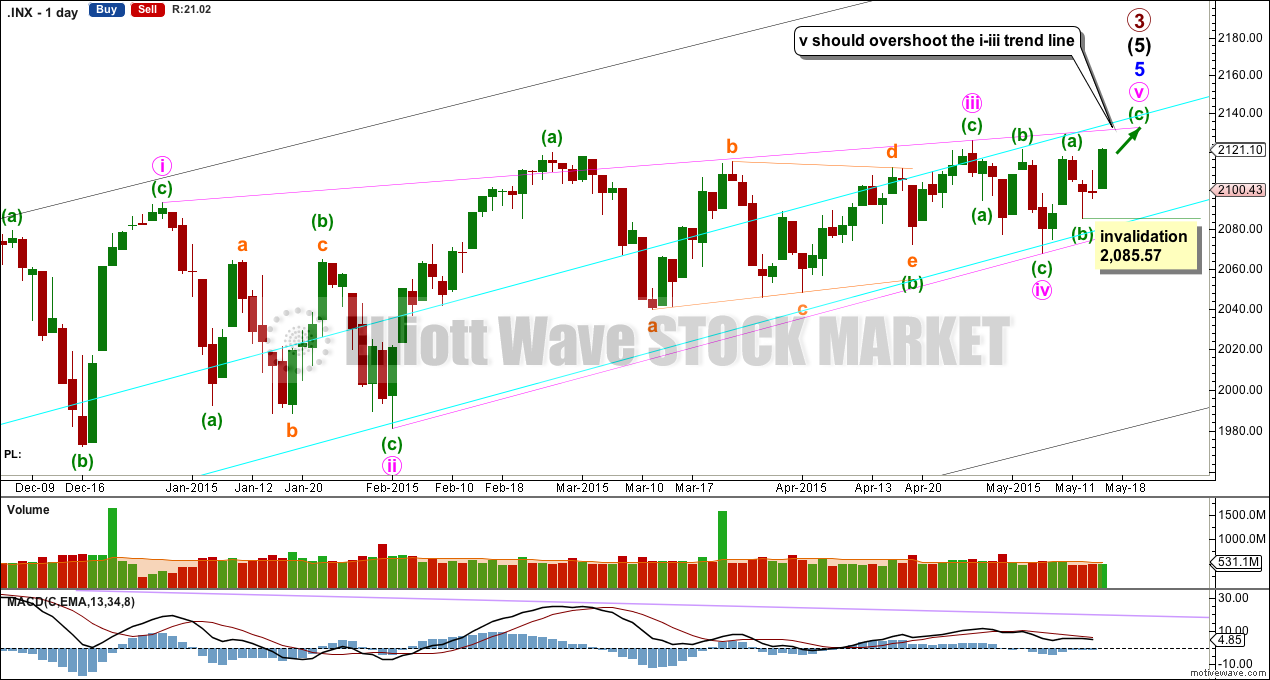
Minor wave 5 is an ending contracting diagonal, detailed on the daily chart below (the beginning is now off to the left of the chart, and can be seen on weekly charts).
All this choppy overlapping movement with declining momentum fits for a diagonal. An ending diagonal requires all sub waves to be zigzags, and the fourth wave must overlap back into first wave price territory. Elliott wave convention is to always draw the trend lines about a diagonal to indicate the structure is a diagonal.
The diagonal for minor wave 5 would be contracting: minute wave iii is shorter than minute wave i.
Minute wave iv is extremely likely to be over at the lower aqua blue trend line. If minute wave v begins here then it has a limit. It may not be longer than equality with minute wave iii at 2,212.95.
Within minute wave v, minuette wave (b) may not move beyond the start of minuette wave (a) below 2,067.93.
Within impulses, the S&P often exhibits a Fibonacci ratio between two of its three actionary waves and rarely between all three. Within primary wave 3, there is already a close Fibonacci ratio between intermediate waves (1) and (3), and within intermediate wave (5) there is already a reasonable Fibonacci ratio between minor waves 3 and 1. It is unlikely that either minor wave 5 or intermediate wave (5) will exhibit a Fibonacci ratio. This means a target for primary wave 3 calculated at intermediate or minor degree would not have a good probability.
The target at 2,190 from the weekly chart looks to be too high. I would not expect such a large overshoot of the diagonal trend line.
Actionary waves within diagonals don’t normally exhibit Fibonacci ratios to each other. So the target cannot be reliably calculated at minute degree.
A better way to see where minute wave v is likely to end is the i-iii trend line. It is very common for the fifth wave of a contracting diagonal to overshoot the i-iii trend line. Only when this line is overshot would I consider and end to primary wave 3.
Hourly Wave Count
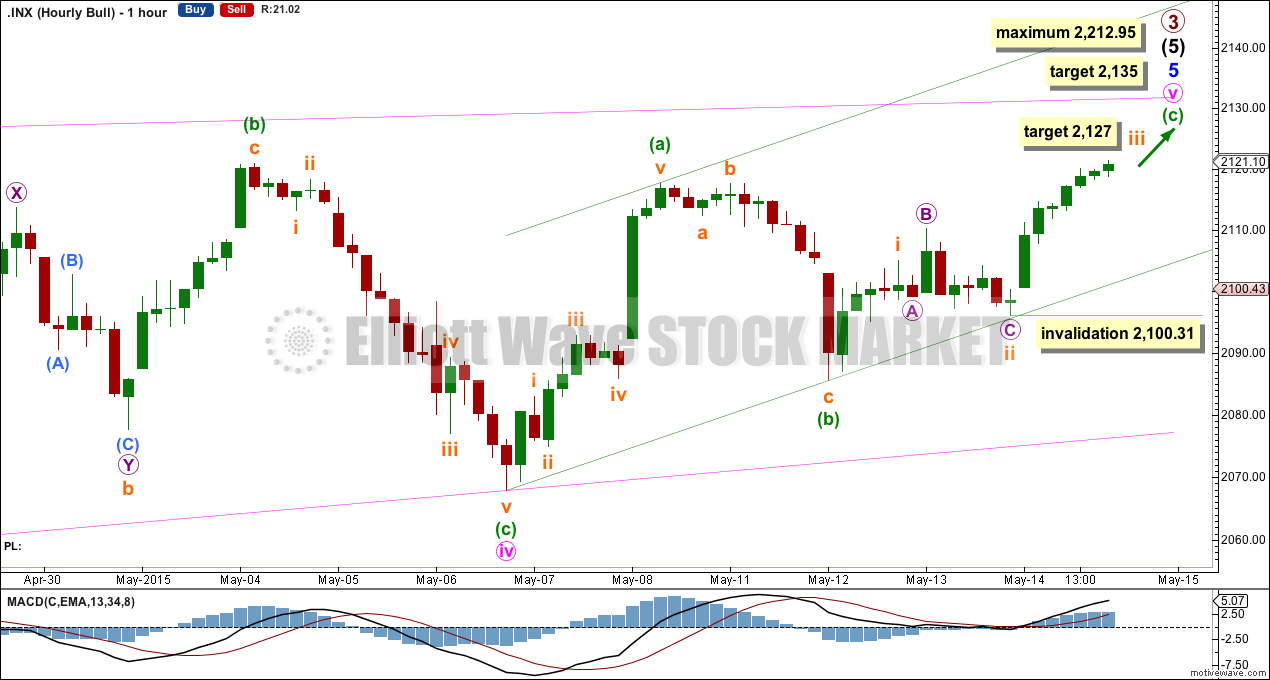
Draw a corrective channel about this final zigzag up: draw the first trend line from the start of minuette wave (a) to the end of minuette wave (b) then place a parallel copy on the end of minuett wave (a). Along the way up downwards corrections should find support at the lower trend line. Minuette wave (c) may end either midway within the channel or about the upper edge.
At 2,127 subminuette wave iii would reach 1.618 the length of subminuette wave i. While subminuette wave iii is incomplete the invalidation point must remain at 2,100.31. No second wave correction may move beyond the start of its first wave.
When subminuette wave iii is complete the invalidation point may be moved up to the end of subminuette wave i at 2,105.06. Subminuette wave iv may not move into subminuette wave i price territory.
Bear Wave Count
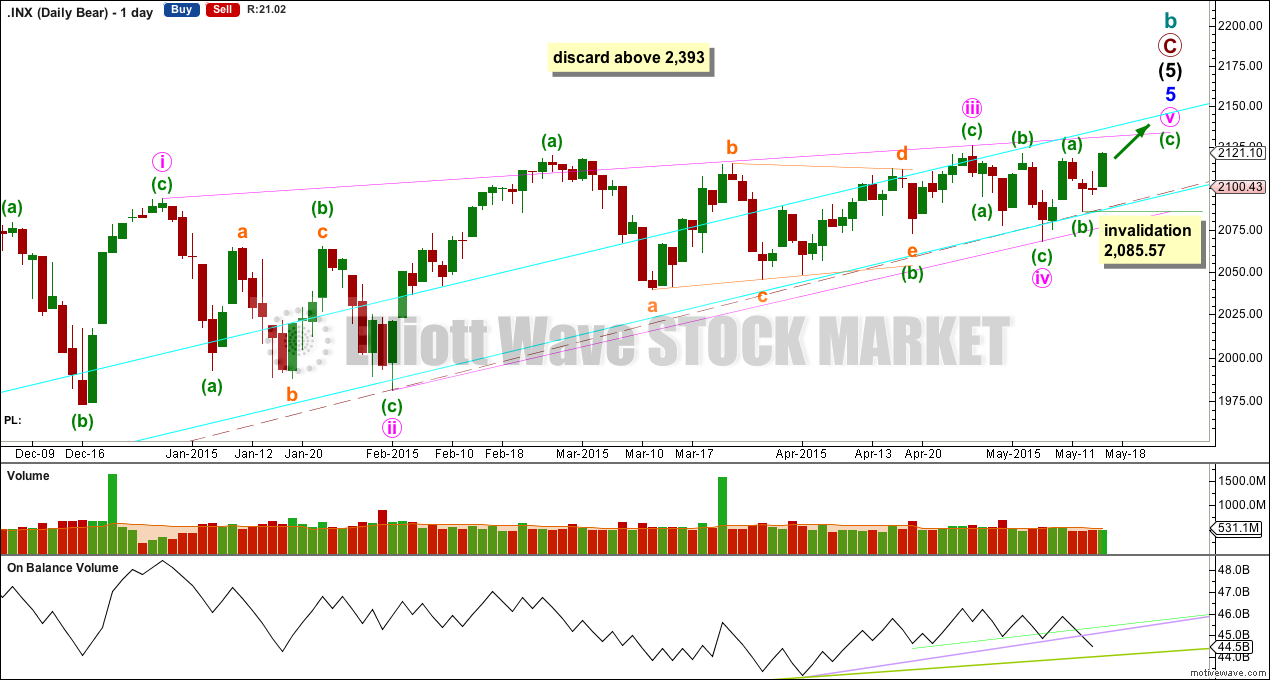
The subdivisions within primary waves A-B-C are seen in absolutely exactly the same way as primary waves 1-2-3 for the bull wave count.
To see the difference at the monthly chart level between the bull and bear ideas look at the last historical analysis here.
At cycle degree wave b is over the maximum common length of 138% the length of cycle wave a, at 167% the length of cycle wave a. At 2,393 cycle wave b would be twice the length of cycle wave a and at that point this bear wave count should be discarded.
While we have no confirmation of this wave count we should assume the trend remains the same, upwards. This wave count requires confirmation before I have confidence in it. Full and final confirmation that the market is crashing would only come with a new low below 1,370.58. However, structure and momentum should tell us long before that point which wave count is correct, bull or bear.
On Balance Volume should continue to find support at the trend lines drawn. When the longer held green trend line is broken by OBV a trend change would be supported.
Technical Analysis
I will begin adding regular technical analysis daily.
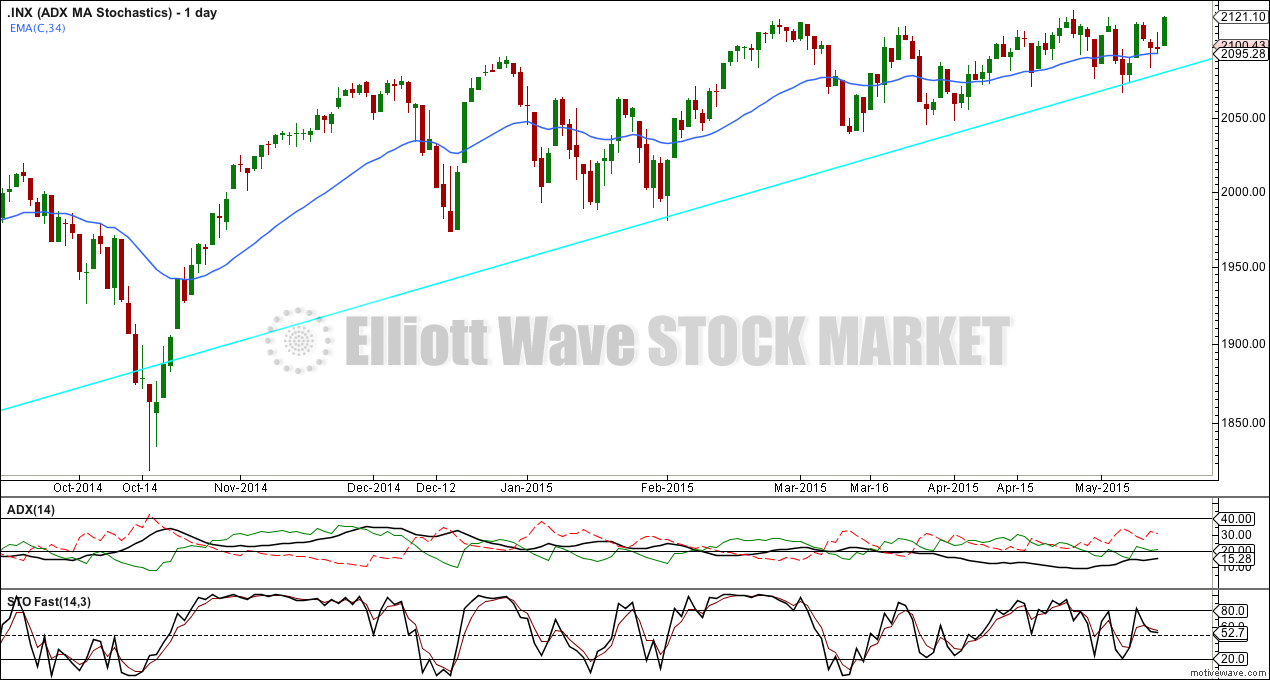
At any one time a market will be doing only one of two things: trending or trading (moving sideways). Therefore, different TA approaches must be used for these two market scenarios.
ADX can be used to indicate if a market is trending or trading. When ADX is over 15 and rising, as it is currently for the S&P, it indicates the beginning of a trend. The 34 day EMA indicates the trend is up, because price is above it. However, ADX directional indicators indicate the trend is down, because the red negative line is above the green positive line (for those members who are colour blind the red line is dashed, the green line solid and the ADX black line is bolder).
On balance, with price above both the 34 day EMA and the long held bull trend line, it can be assumed that it is most likely the trend at this stage is up.
This analysis is published about 08:46 p.m. EST.