
Sideways movement fits both hourly Elliott wave counts.
Summary: It is now more likely that minuette wave (b) was over two days ago and minuette wave (c) upwards has begun to 2,135. It is still possible but now less likely that minuette wave (b) will continue lower to find support at the pink ii-iv trend line of the diagonal.
Click charts to enlarge.
To see a weekly chart and how to draw trend lines go here.
Bull Wave Count
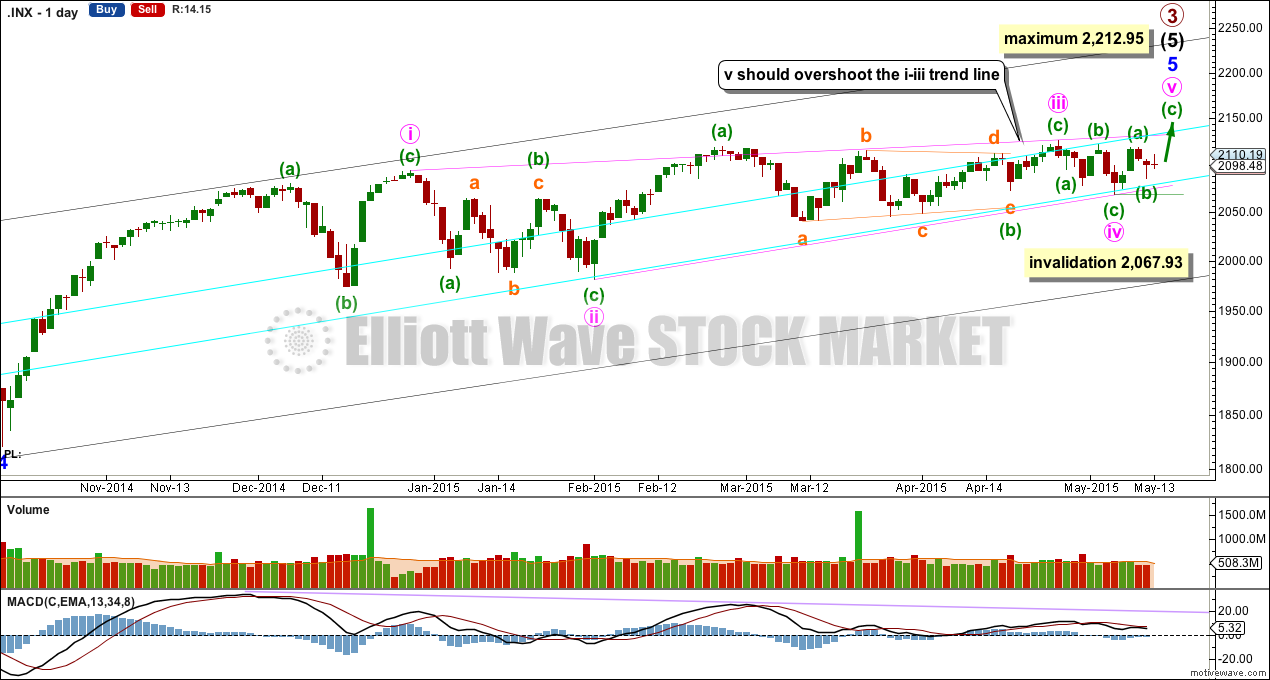
The bull wave count sees primary 1-2-3 within an impulse for a cycle degree wave V.
The bear wave count sees primary A-B-C zigzag for a cycle degree B wave.
The subdivisions for this upwards movement for both bull and bear wave counts are 5-3-5. The wave counts don’t diverge and won’t for months yet.
Minor wave 5 is an ending contracting diagonal, detailed on the daily chart below.
All this choppy overlapping movement with declining momentum fits for a diagonal. An ending diagonal requires all sub waves to be zigzags, and the fourth wave must overlap back into first wave price territory. Elliott wave convention is to always draw the trend lines about a diagonal to indicate the structure is a diagonal.
The diagonal for minor wave 5 would be contracting: minute wave iii is shorter than minute wave i.
Minute wave iv is extremely likely to be over at the lower aqua blue trend line. If minute wave v begins here then it has a limit. It may not be longer than equality with minute wave iii at 2,212.95.
Within minute wave v, minuette wave (b) may not move beyond the start of minuette wave (a) below 2,067.93.
Within impulses, the S&P often exhibits a Fibonacci ratio between two of its three actionary waves and rarely between all three. Within primary wave 3, there is already a close Fibonacci ratio between intermediate waves (1) and (3), and within intermediate wave (5) there is already a reasonable Fibonacci ratio between minor waves 3 and 1. It is unlikely that either minor wave 5 or intermediate wave (5) will exhibit a Fibonacci ratio. This means a target for primary wave 3 calculated at intermediate or minor degree would not have a good probability.
The target at 2,190 from the weekly chart looks to be too high. I would not expect such a large overshoot of the diagonal trend line.
Actionary waves within diagonals don’t normally exhibit Fibonacci ratios to each other. So the target cannot be reliably calculated at minute degree.
A better way to see where minute wave v is likely to end is the i-iii trend line. It is very common for the fifth wave of a contracting diagonal to overshoot the i-iii trend line. Only when this line is overshot would I consider and end to primary wave 3.
Main Hourly Wave Count
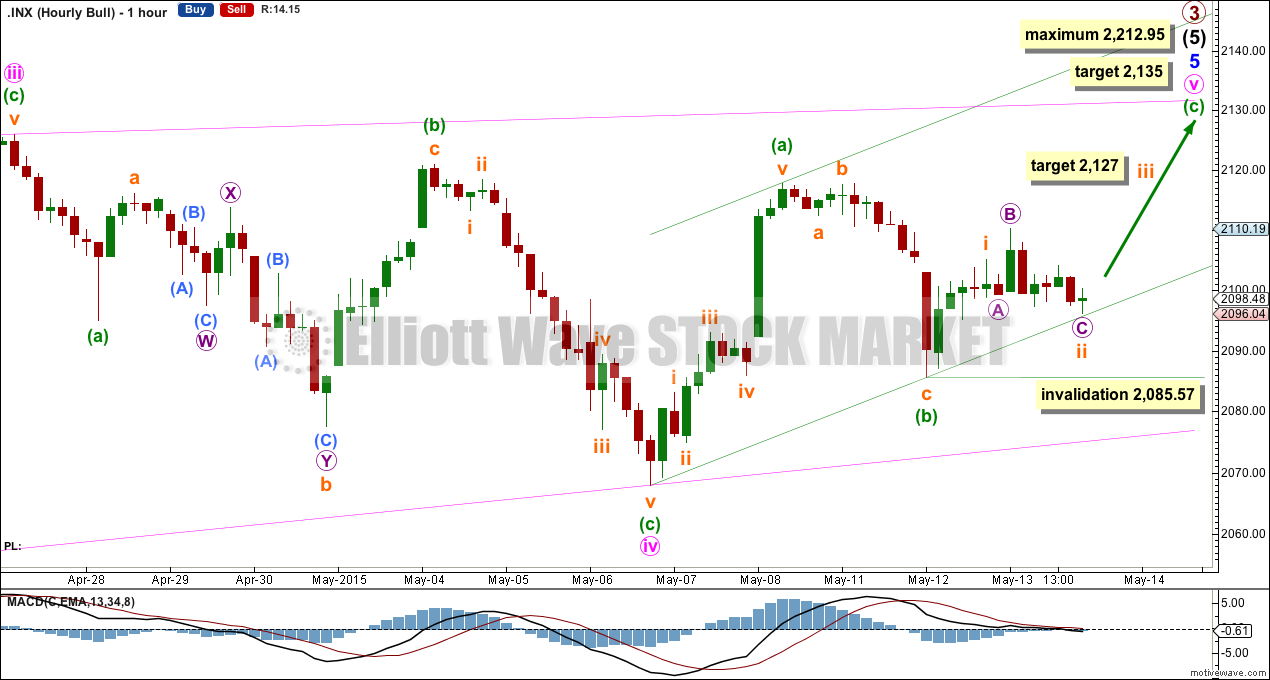
If minuette wave (b) is over then minuette wave (c) has begun with a first and second wave now very likely complete.
Subminuette wave ii should find support at the lower edge of this channel. If this lower green trend line is breached the alternate hourly wave count would be favoured.
This main hourly wave count expects a third wave up to begin tomorrow. At 2,127 subminuette wave iii would reach 1.618 the length of subminuette wave i.
At 2,135 minuette wave (c) would reach equality in length with minuette wave (a). If this target is wrong it may be too low. Minute wave v would be very likely to show a reasonably strong overshoot of the upper pink i-iii trend line of the diagonal for minor wave 5.
Subminuette wave ii may not move beyond the start of subminuette wave i below 2,085.57.
Alternate Hourly Wave Count
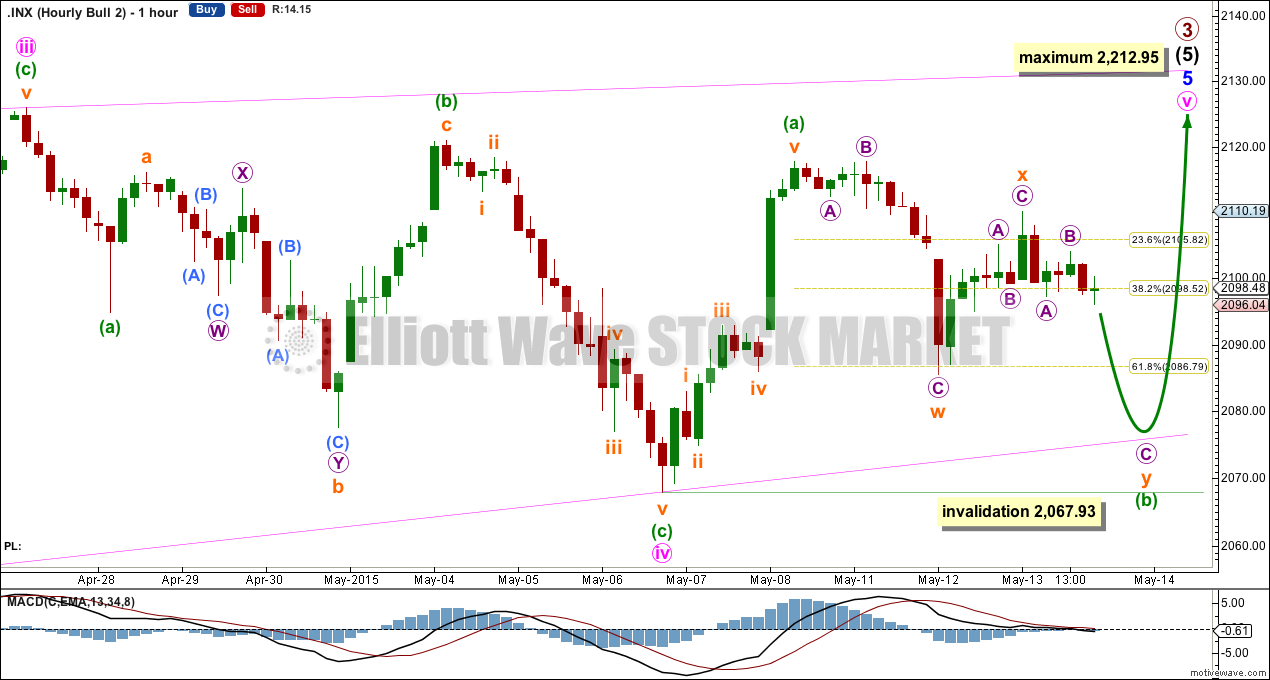
This alternate wave count simply moves the degree of labelling within minuette wave (b) all down one degree and looks at the possibility that it may continue lower as a double zigzag.
Subminuette wave x has moved higher and is no longer very shallow. This has reduced the probability of a double zigzag continuing lower because double zigzags most commonly have brief shallow X waves. However, this possibility remains while subminuette wave x remains below the start of subminuette wave w at 2,117.66.
The second zigzag in a double exists to deepen a correction when the first zigzag does not move price deep enough. In this case subminuette wave y may end when price touches the lower ii-iv pink trend line of the diagonal. While the diagonal is incomplete that trend line should not be breached, because diagonals normally adhere well to their trend lines.
Minuette wave (b) may not move beyond the start of minuette wave (a) below 2,067.93.
Bear Wave Count
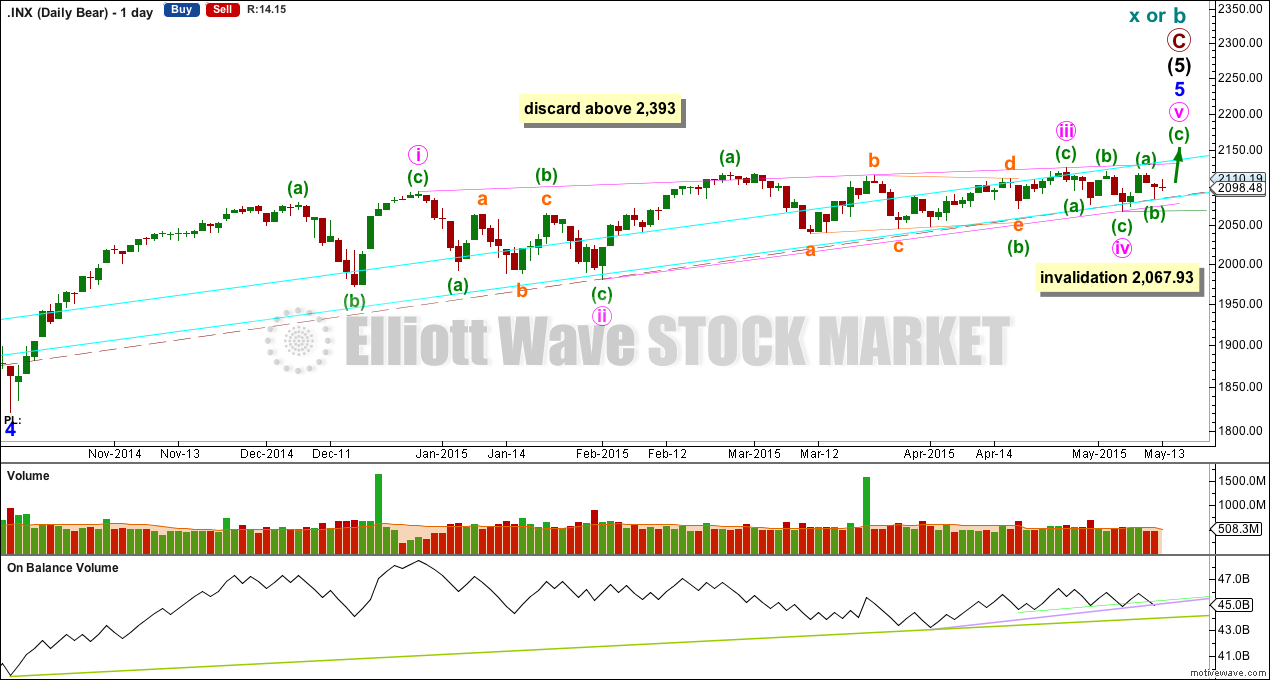
The subdivisions within primary waves A-B-C are seen in absolutely exactly the same way as primary waves 1-2-3 for the bull wave count.
To see the difference at the monthly chart level between the bull and bear ideas look at the last historical analysis here.
At cycle degree wave b is over the maximum common length of 138% the length of cycle wave a, at 167% the length of cycle wave a. At 2,393 cycle wave b would be twice the length of cycle wave a and at that point this bear wave count should be discarded.
While we have no confirmation of this wave count we should assume the trend remains the same, upwards. This wave count requires confirmation before I have confidence in it. Full and final confirmation that the market is crashing would only come with a new low below 1,370.58. However, structure and momentum should tell us long before that point which wave count is correct, bull or bear.
On Balance Volume should continue to find support at the trend lines drawn. When the longer held green trend line is broken by OBV a trend change would be supported.
This analysis is published about 08:31 p.m. EST.