
I noticed this trend line on Google. I call it Google’s “forever trend line”:
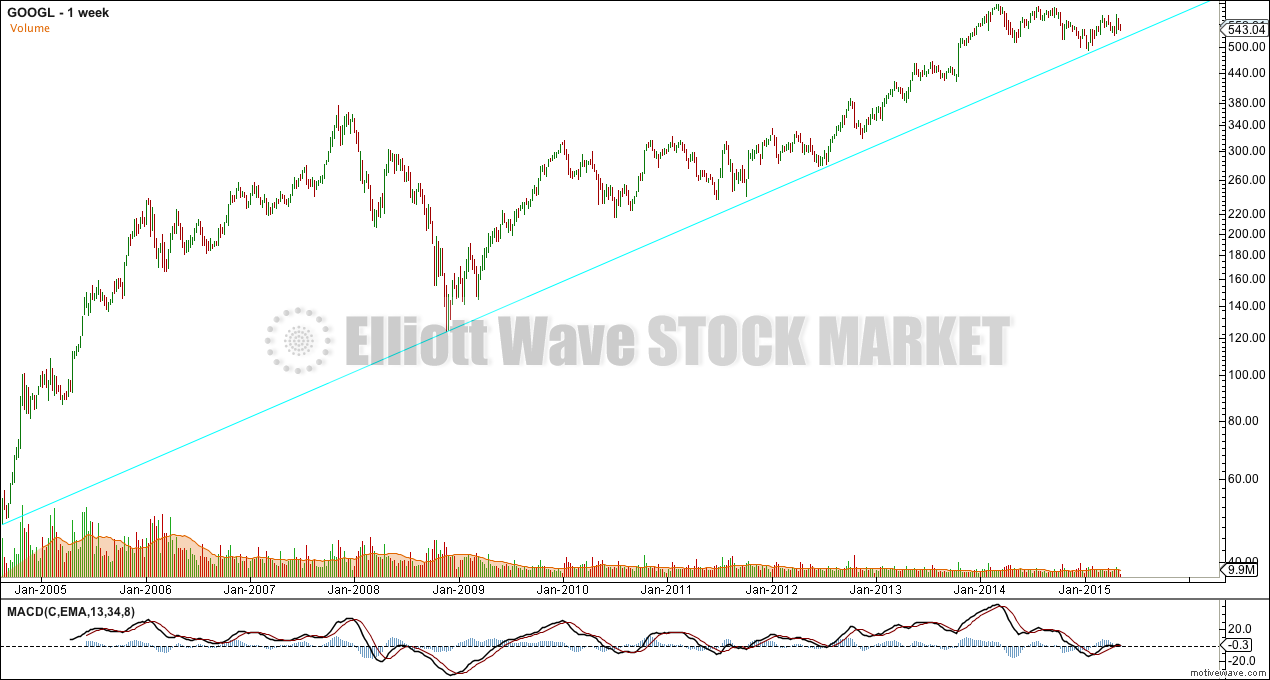
I noticed also the general decline in volume for Google. A decline in volume while price rises is suspicious.
I would expect Google to remain in a bull market and this trend line to continue to provide strong support while price remains above this long held trend line. If price breaks below this long weekly trend line by a close of 3% or more of market value that may be an early indicator of a bear market.
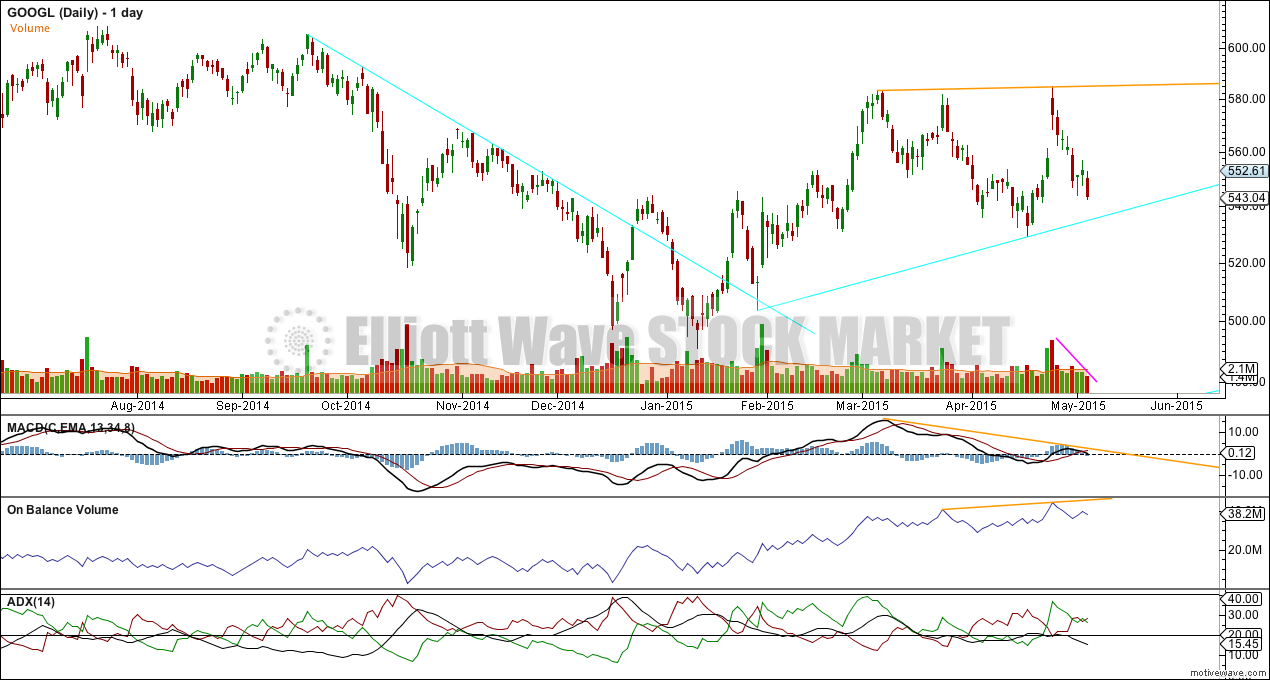
At the daily chart level there is a shorter term trend line which may provide support in the next few days.
There is no divergence currently with OBV and price, both are trending higher (orange trend lines).
There is divergence between price moving slightly higher while MACD moves lower.
ADX indicates the market is not trending and is sideways.
In the very short term for Google volume is declining while price is declining. This may be an indication that the current small wave down for Google is maturing. If there is a down day with an increase in volume, particularly if it touches the upwards sloping aqua blue trend line here, that may be a short term low for Google.