
Upwards movement was unexpected for Friday and invalidated the hourly Elliott wave count.
Summary: Both bull and bear wave counts expect an ending contracting diagonal is close to completion. I have three hourly charts: two which see minute wave iv incomplete and one which sees minute wave iv over and minute wave v underway.
To see a weekly chart showing how to draw trend lines and the structure of primary wave 3 go here.
Click charts to enlarge.
Bull Wave Count
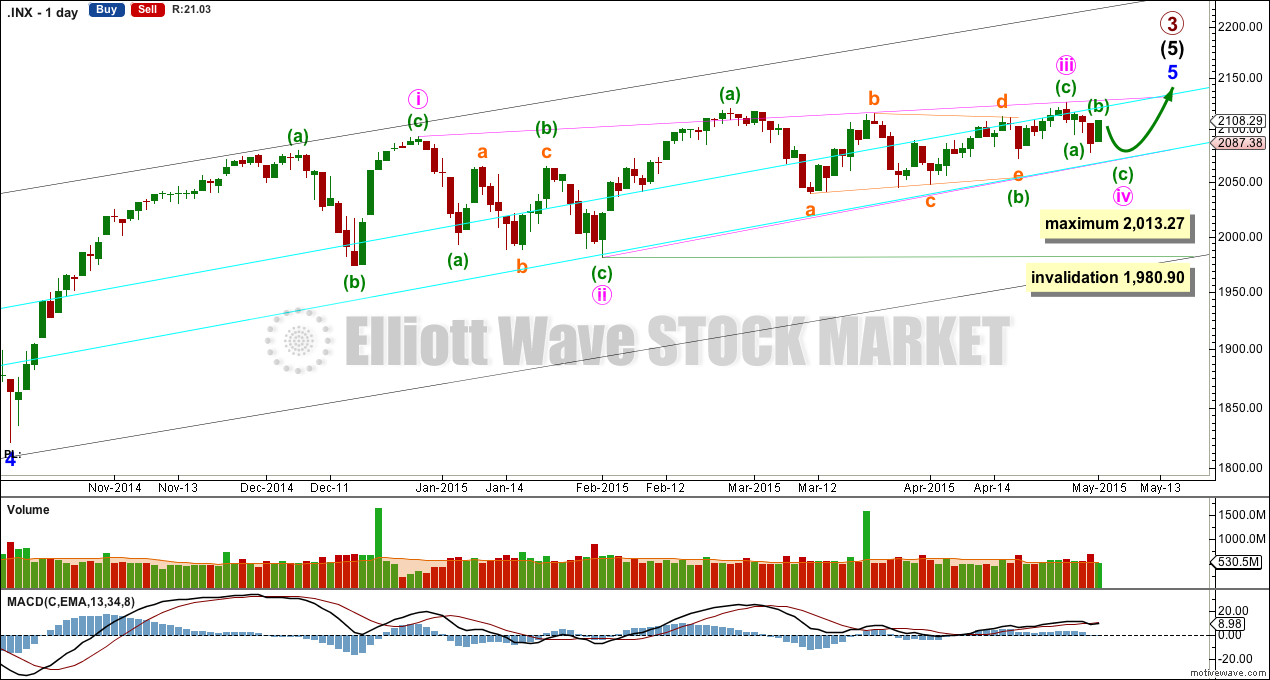
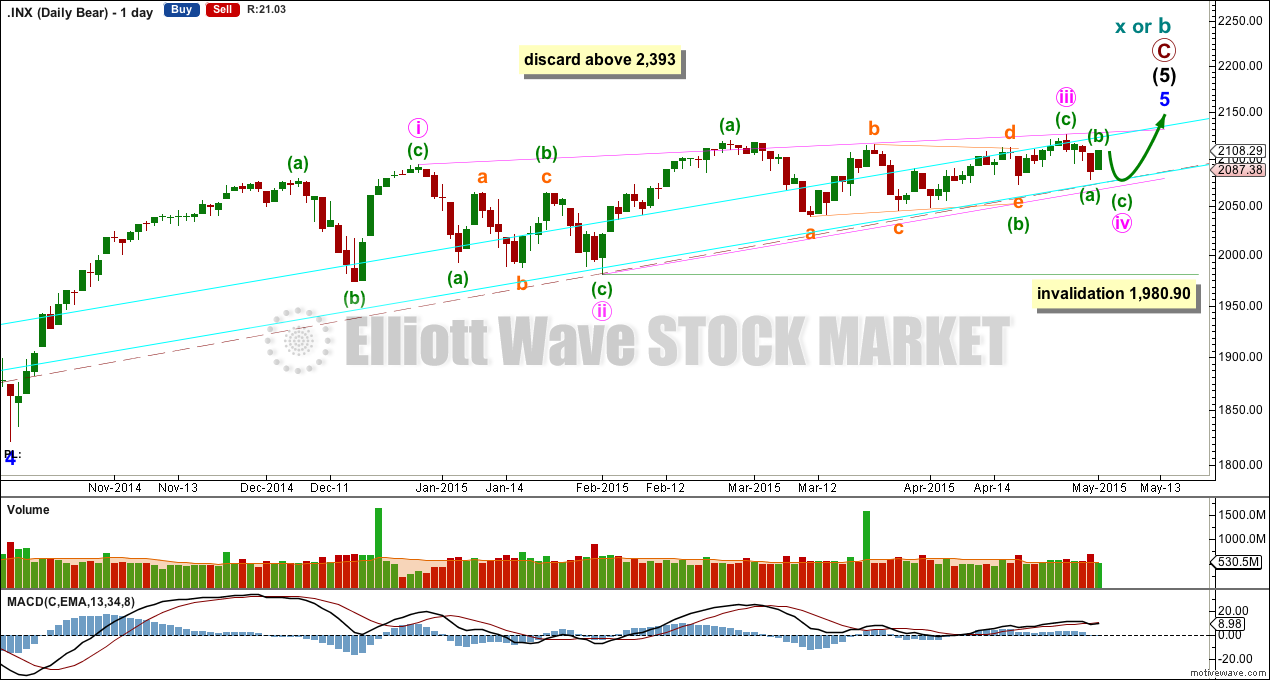
Both bull and bear wave counts see minor wave 5 as an ending contracting diagonal.
Minor wave 5 begins here as labelled. All this choppy overlapping movement with declining momentum fits for a diagonal. An ending diagonal requires all sub waves to be zigzags, and the fourth wave must overlap back into first wave price territory. Elliott wave convention is to always draw the trend lines about a diagonal to indicate the structure is a diagonal.
The diagonal for minor wave 5 would be contracting: minute wave iii is shorter than minute wave i. Minute wave iv must be shorter than minute wave ii, the maximum length for minute wave iv is equality in length with minute wave ii at 2,013.27. The rule for the end of a fourth wave within a diagonal is it must overlap back into minute wave i price territory below 2,093.55 and it may not move beyond the end of minute wave ii below 1,980.90.
Minute wave iv would be most likely to end when price again comes to touch the lower aqua blue trend line.
I don’t have a target for primary wave 3 to end yet because I don’t think minor wave 5 will exhibit a Fibonacci ratio to either of minor waves 3 and 1, because there is already a ratio between 3 and 1. Likewise at intermediate degree: intermediate waves (1) and (3) have a close ratio so intermediate wave (5) may not exhibit a ratio to either of (1) or (3). The best way to see where this upwards movement is likely to end is the i-iii trend line of the diagonal, as it is likely to be slightly overshot.
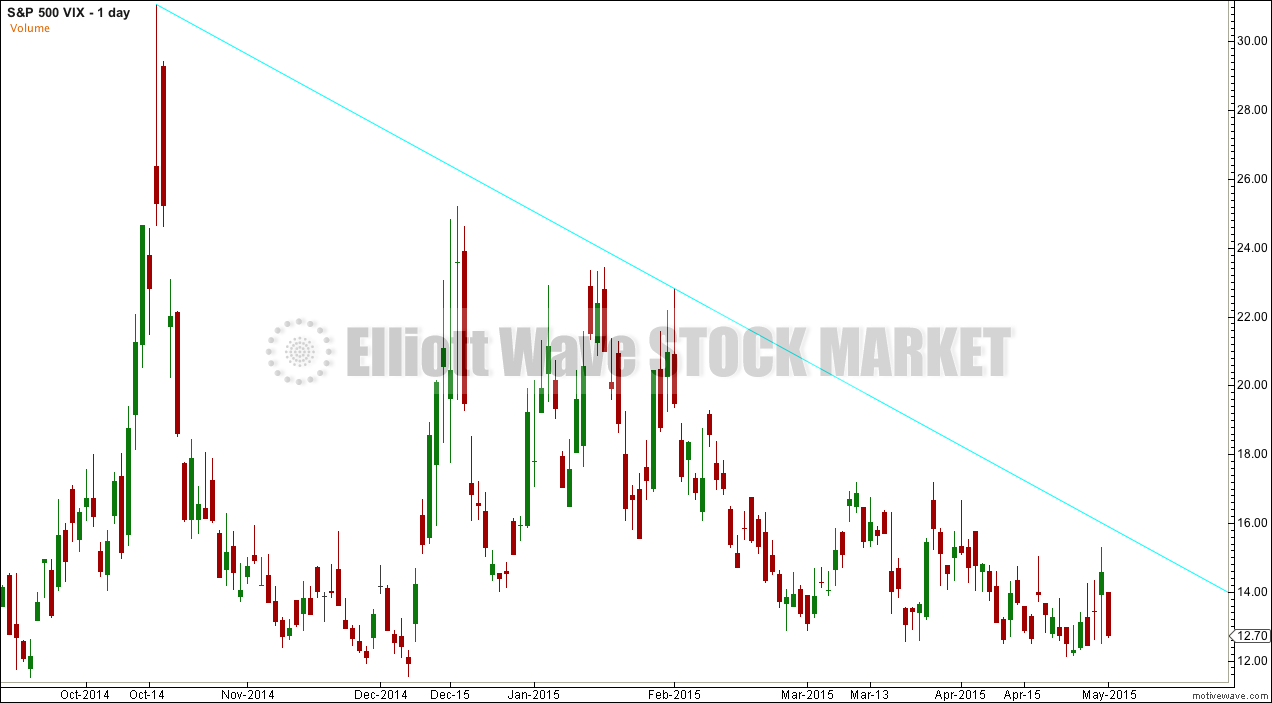
VIX continues to decline indicating complacency amongst investors. This is what should be expected when the market is topping and so it fits with the idea of an ending diagonal (rising wedge) terminal structure.
This indicates a correction upcoming, but importantly it does not tell us how strong long and deep the upcoming correction may be. It does not tell if the upcoming correction will be at primary degree (bull wave count), at cycle degree (bear wave count) or indeed at even a lower degree if the wave counts are wrong.
I have three hourly wave counts today. After Friday’s invalidation it would be wise to consider all possibilities I can see for the short term. I am presenting the hourly wave counts below in the order in which they were developed, not in order of probability. After consideration of the overall look on the daily chart, I would prefer wave count #3 because minute wave iv would have a better look if it lasted longer and bought price down to the lower aqua blue trend line on the daily chart.
Wave count #1 has a problem which reduces its probability to the lowest of the three. Wave count #2 is the only bullish hourly wave count and it requires confirmation with a new high above 2,125.92.
Hourly Wave Count 1
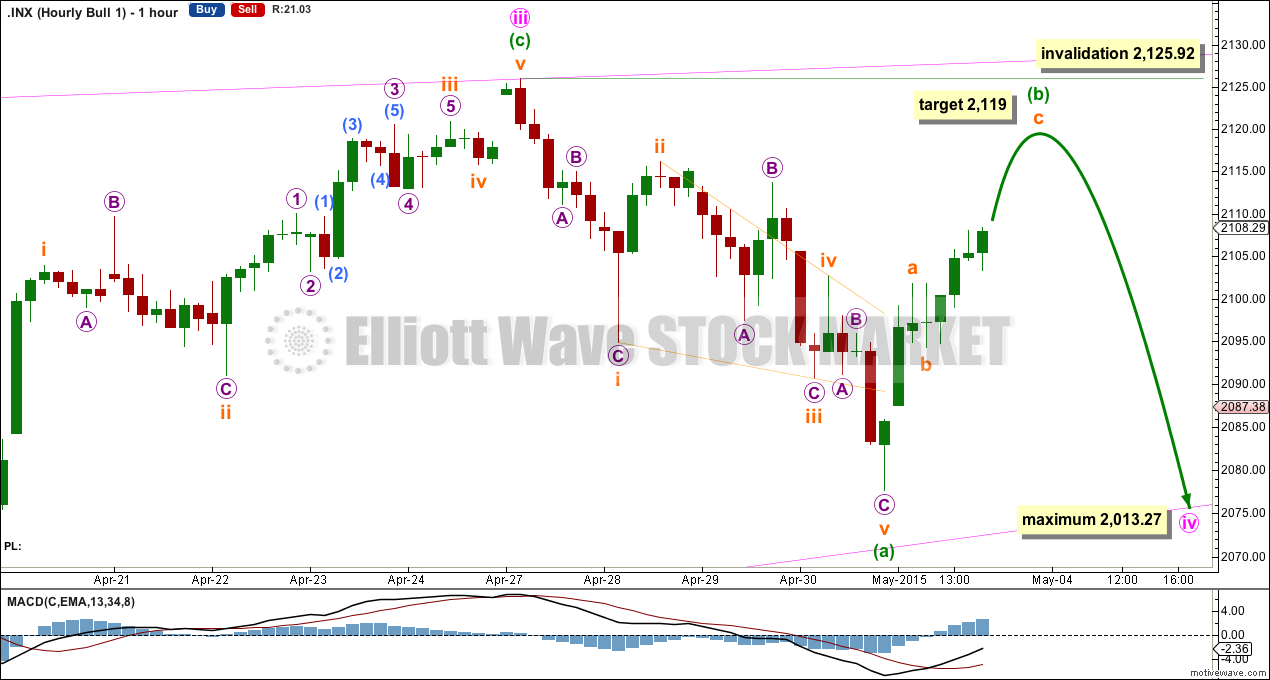
Minute wave iv may be incomplete as a zigzag. Minuette wave (a) here subdivides as a leading contracting diagonal. This is the least favoured wave count of all three because the diagonal does not adhere well to its trend lines. I publish it in the spirit of considering all possibilities.
Within minuette wave (b) zigzag at 2,119 subminuette wave c would reach equality in length with subminuette wave a.
Minuette wave (b) may not move beyond the start of minuette wave (a) above 2,125.92.
Minuette wave (c) should move below the end of minuette wave (a) at 2,077.59 to avoid a truncation.
Minute wave iv may not be longer than equality in length with minute wave ii at 2,013.27.
Hourly Wave Count 2
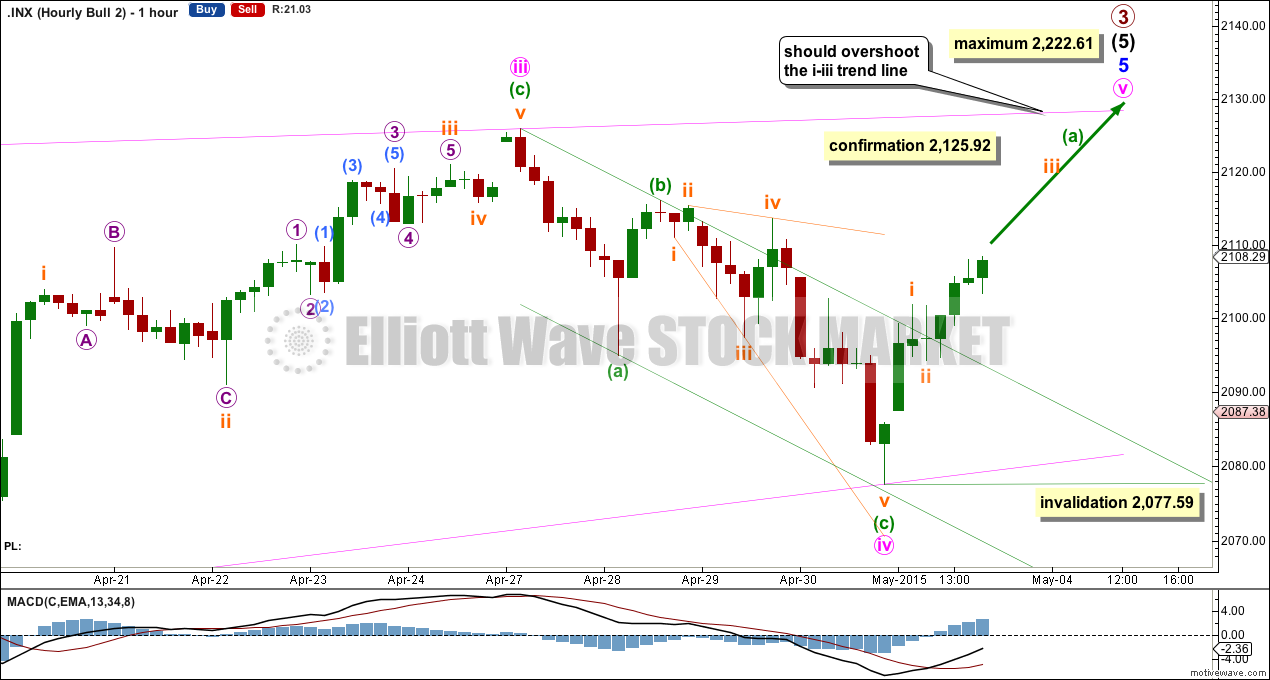
This is the only bullish hourly wave count of all three. It is possible to see minute wave iv as a complete zigzag if minuette wave (c) is an ending expanding diagonal.
There is no Fibonacci ratio between minuette waves (a) and (c).
This wave count requires confirmation above 2,125.92.
If minute wave iv is over then minute wave v may not be longer than equality with minute wave iii, because the diagonal of minor wave 5 is contracting and a third wave may never be the shortest. Minute wave v has its limit at 2,222.61.
Minute wave v would be extremely likely to overshoot the i-iii trend line of the diagonal. Only when that line is overshot would this wave count look for a trend change. When minuette waves (a) and (b) within minute wave v are complete then the ratio between minuette waves (a) and (c) may be used to calculate a price target for upwards movement to end. That cannot be done yet.
Within minute wave v no second wave nor B wave may move beyond its start below 2,077.59.
Hourly Wave Count 3
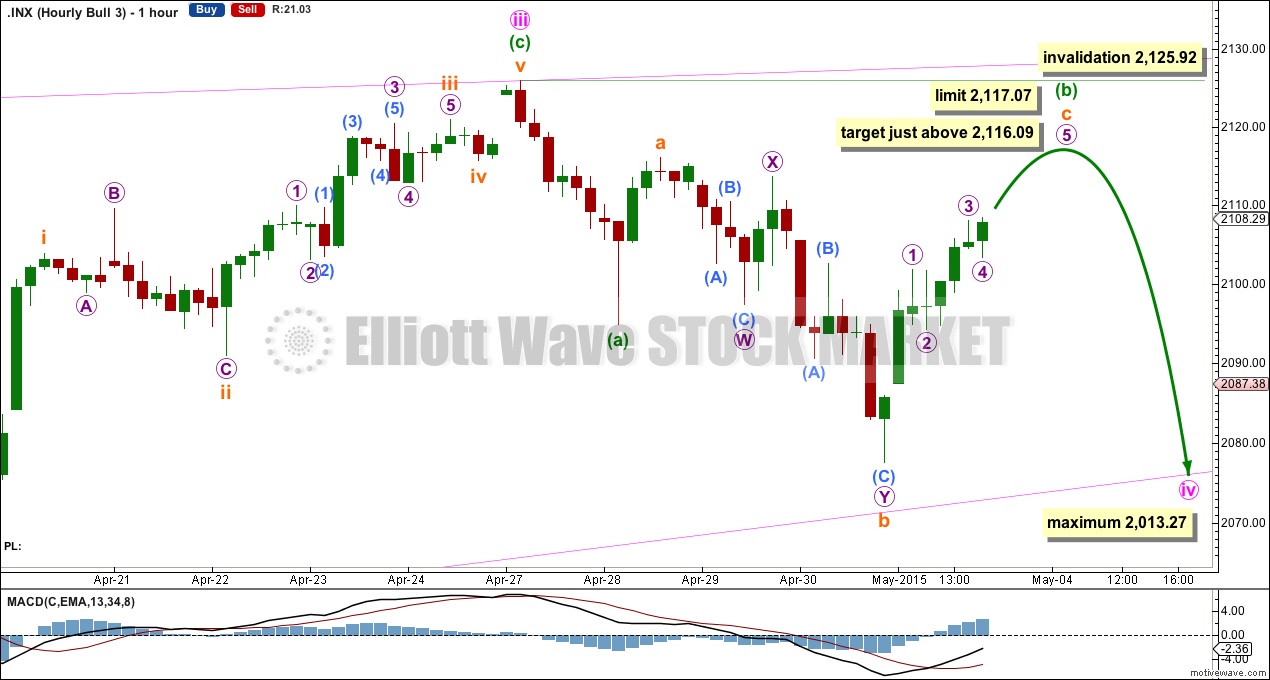
There is another possibility for minute wave iv if it is not over. Minuette wave (a) may have been a short impulse, and minuette wave (b) may be an incomplete expanded flat correction.
Within the expanded flat of minuette wave (b) subminuette wave b is 1.8 times the length of subminuette wave a. This is less than twice the length of subminuette wave a so it is acceptable. Subminuette wave c would be extremely likely to move at least slightly above the end of subminuette wave a at 2,116.09 to avoid a truncation and a very rare running flat.
If subminuette wave c is an impulse as labelled then micro wave 3 within it is shorter than micro wave 1. This gives a limit to micro wave 5 because it may not be longer than equality with micro wave 3 (a third wave may never be the shortest). This limit is at 2,117.07.
When subminuette wave c is a complete impulse then this third wave count would expect another five wave structure downwards which may end when price comes to touch the lower aqua blue trend line on the daily chart. When minuette wave (b) is complete then the ratio between minuette waves (a) and (c) may be used to calculate a downwards target for minute wave iv to end. This cannot be done at this stage.
Minute wave iv may not be longer than equality with minute wave ii because the diagonal is contracting and may not move below 2,013.27.
Bear Wave Count
The subdivisions within primary waves A-B-C are seen in absolutely exactly the same way as primary waves 1-2-3 for the bull wave count. The alternate bull wave count idea also works perfectly for this bear wave count.
To see the difference at the monthly chart level between the bull and bear ideas look at the last historical analysis here.
At cycle degree wave b is over the maximum common length of 138% the length of cycle wave a, at 167% the length of cycle wave a. At 2,393 cycle wave b would be twice the length of cycle wave a and at that point this bear wave count should be discarded.
While we have no confirmation of this wave count we should assume the trend remains the same, upwards. This wave count requires confirmation before I have confidence in it. Full and final confirmation that the market is crashing would only come with a new low below 1,370.58. However, structure and momentum should tell us long before that point which wave count is correct, bull or bear.
This analysis is published about 07:46 p.m. EST.