
Yesterday’s hourly chart expected Tuesday to begin with a little upwards movement to find resistance at the pink trend line, and thereafter it expected price to turn down. This is exactly what happened.
Summary: The mid term target remains at 2,000 and may be met in another nine or seventeen sessions if minuette wave (iii) totals a Fibonacci thirteen or twenty-one days.
Click charts to enlarge.
Bullish Wave Count
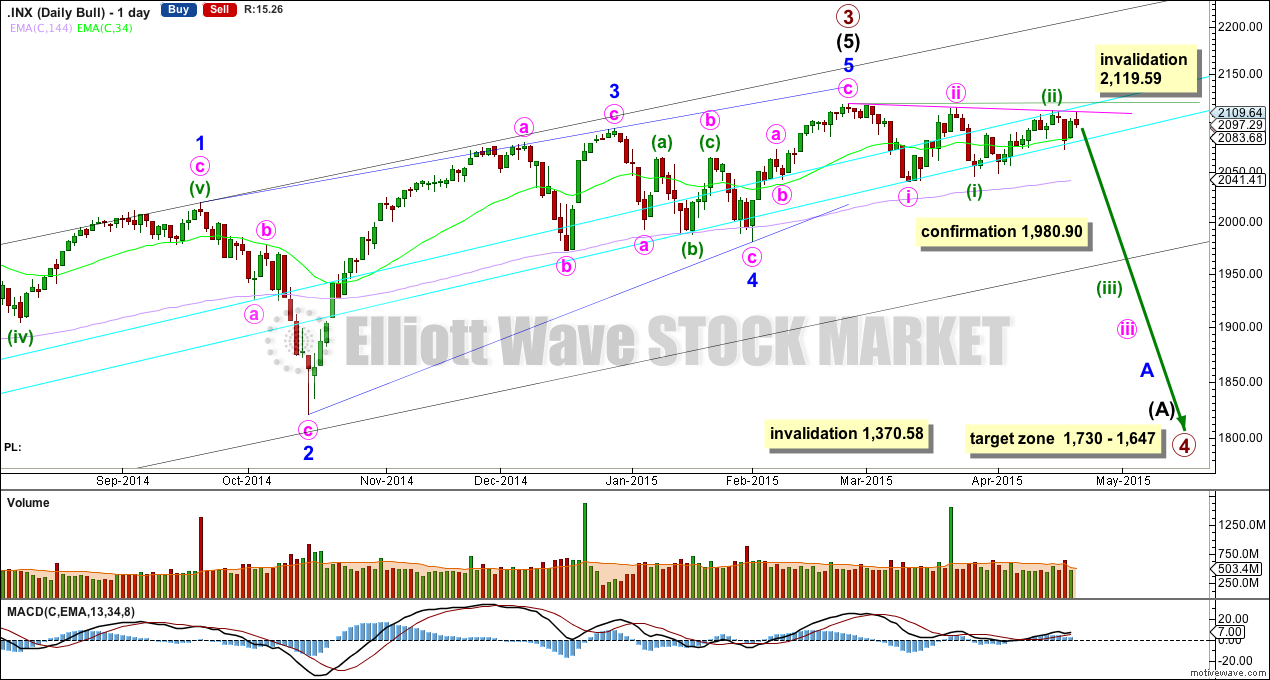
If primary wave 3 is over then primary wave 4 should begin. Upwards movement from the low at 666.79 subdivides now as a complete 5-3-5. For the bull wave count this is seen as primary waves 1-2-3. The wave count sees intermediate wave (5) as an ending contracting diagonal. Ending diagonals require all sub waves to be zigzags.
Primary wave 2 was a relatively shallow 0.41 zigzag lasting 12 weeks. Primary wave 4 may be more shallow and is most likely to be a flat, combination or triangle. It may be longer lasting than primary wave 2 as these types of sideways corrective structures tend to be more time consuming than zigzags. Primary wave 4 is likely to end in the price territory of the fourth wave of one lesser degree between 1,730 – 1,647. It may last about 21 or possibly 34 weeks. So far it is in its eighth week.
To see a weekly chart and how to draw the aqua blue trend lines and the black channel, go here. Primary wave 4 should break below the black channel.
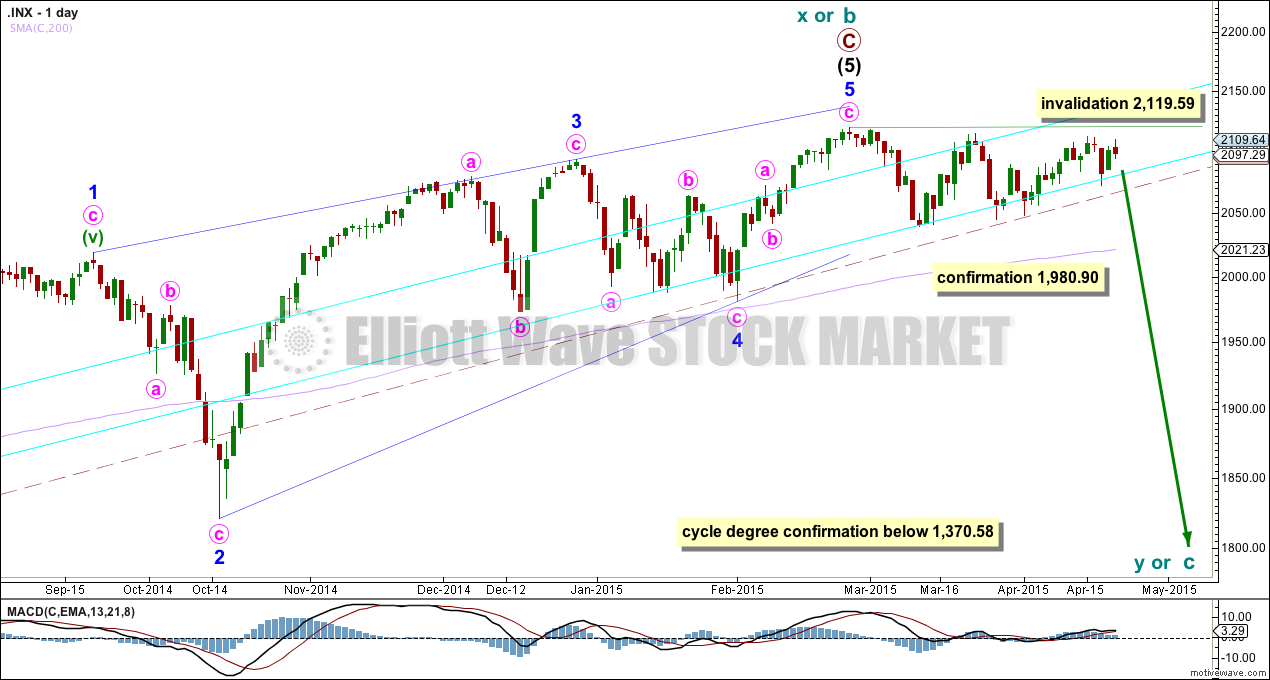
Primary wave 4 may not move into primary wave 1 price territory below 1,370.58. Invalidation of this bull wave count would provide full confidence in the bear wave count.
Because primary wave 4 may be an expanded flat, running triangle or double combination it may include a new high beyond its start at 2,119.59. If this happens the bear wave count would be invalidated. Before that becomes a possibility though, primary wave 4 should begin with a clear five down on the daily chart.
There is triple (quadruple?) divergence with price and MACD at the weekly chart level supporting the idea of a trend change, either already or coming up soon.
A close 3% or more of market value below the double aqua blue trend line would provide trend line confirmation of a sizeable trend change. I will only have confidence in this wave count when there is confirmation of this trend change. When this trend line is again breached I will calculate where the close needs to be.
A new low below 1,980.90 would provide further confirmation of a trend change. At that stage I will use DJIA and NASDAQ to apply Dow theory to confirm a substantial trend change.
The last substantial downward movement for the S&P was primary wave 2 back in June to October, 2011. During this primary degree wave down the 34 day SMA was below the longer 144 day SMA, and price was below both. Once primary wave 3 got underway the 34 day SMA moved above the 144 day SMA and has remained above since December 2011. A cross again of these two moving averages would provide strong confidence in a substantial trend change. I have chosen to use these two ranges because they’re Fibonacci numbers, and these two in conjunction worked so nicely for primary wave 2.
So far within the sideways movement the strongest volume is still down days. This indicates that when the breakout comes from this sideways consolidation phase it is more likely to be down than up. Friday’s session shows an increase in volume for another down day, indicating the breakout may have just begun. Lower volume for the up day of Monday supports the wave count.
A trend line drawn from the start of minute wave i at 2,119.59 to the end of minute wave ii and extended out still perfectly shows where minuette wave (ii) has ended. This pink trend line has again provided perfect resistance to upwards resistance on Tuesday’s session. Minuette wave (ii) totals a Fibonacci thirteen days.
Minuette wave (iii) may total a Fibonacci thirteen or twenty-one days. So far it has lasted only four days.
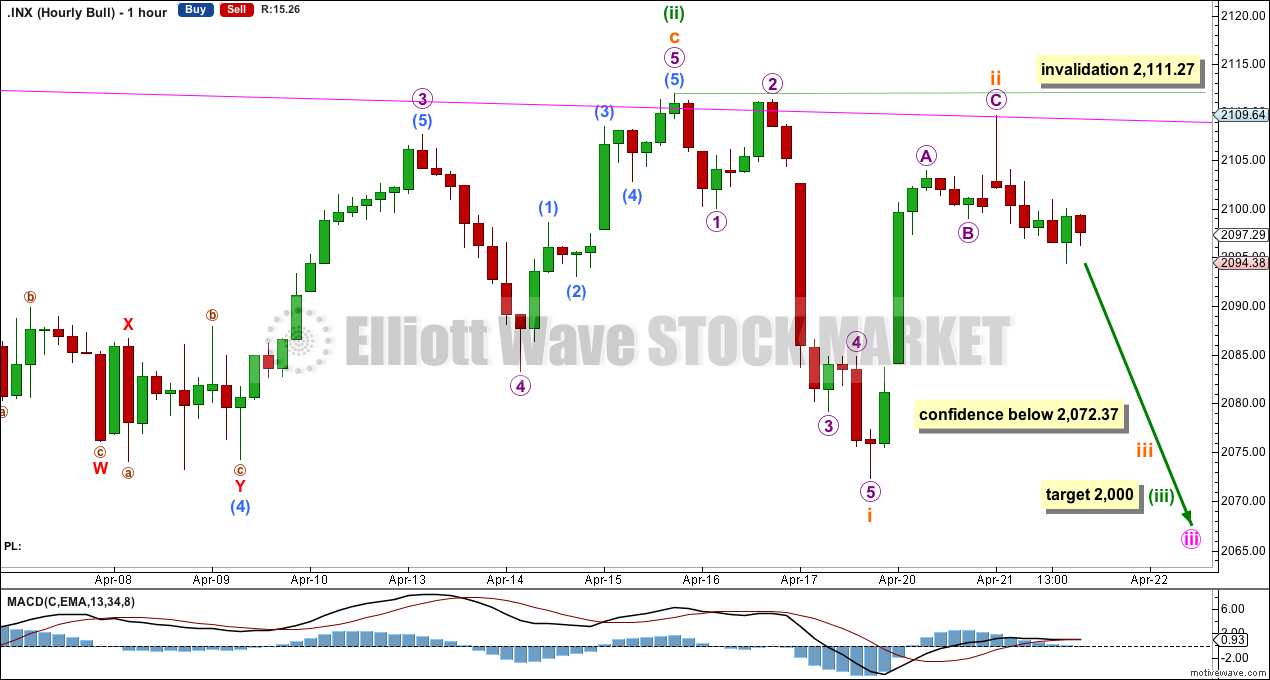
Subminuette wave ii is now a completed zigzag finding resistance and ending exactly at the upper pink trend line copied over from the daily chart.
At this stage a new low below the start of subminuette wave ii at 2,072.37 would provide confidence that the correction is over and the middle of a third wave down is underway. Subminuette wave iii must move below the end of subminuette wave i at 2,072.37.
At 2,000 minuette wave (iii) would reach 1.618 the length of minuette wave (i).
If subminuette wave ii were to continue further as a double zigzag, double combination or flat correction then it may not move beyond the start of subminuette wave i above 2,111.27. My only cause for concern today is the choppy overlapping nature of the downwards movement since the high of subminuette wave ii. For this reason I would consider the possibility that it may continue further, but this does seem unlikely.
Alternate Bullish Wave Count 1
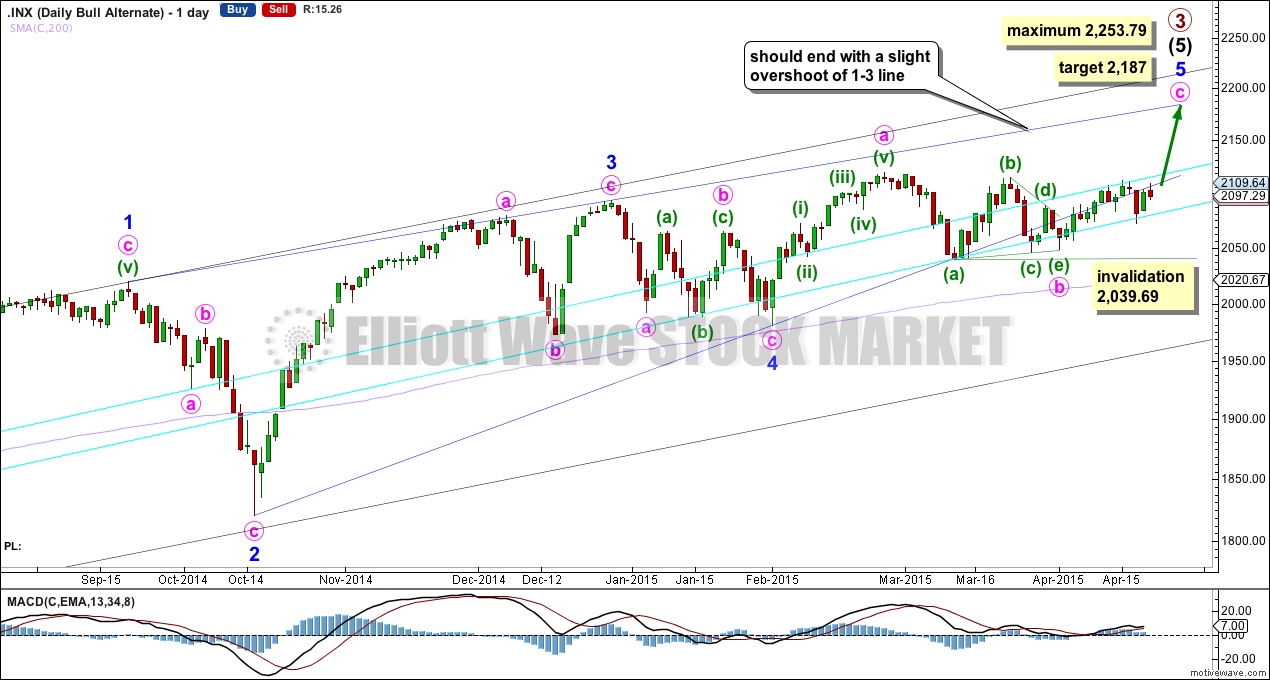
This alternate wave count is identical to the main wave count up to the low labelled minor wave 4. Thereafter, it sees minor wave 5 incomplete.
The lower 2-4 trend line of the contracting diagonal is now breached by three full daily candlesticks below it and not touching it. Diagonals normally adhere very well to their trend lines and this part of the wave count now looks wrong. The strong downwards candlestick for Friday further reduces the probability of this alternate, and it now looks quite ridiculous. I will keep publishing it though as a possible bullish alternate only because we just don’t have confirmation of a primary or cycle degree trend change yet.
This wave count is still technically possible but it has a very low probability. The breach of the 2-4 trend line is the only reason why this wave count is an alternate.
Within the triangle of minute wave b, if minuette wave (c) continues further it may not move beyond the end of minuette wave (a) below 2,039.69. If we see a new low below this point this week I will discard this alternate wave count.
It is at this stage that this alternate wave count diverges from the main wave count. A new high above 2,114.86 (the high of minute wave ii, bullish wave count) would increase the probability of this alternate.
For some time now I have been very concerned with the repeated breach and strong overshoots of the 2-4 trend line of the diagonal for this wave count. I have spent some time looking for a bullish alternate which resolves this problem, and I will publish it below.
Alternate Bullish Wave Count 2
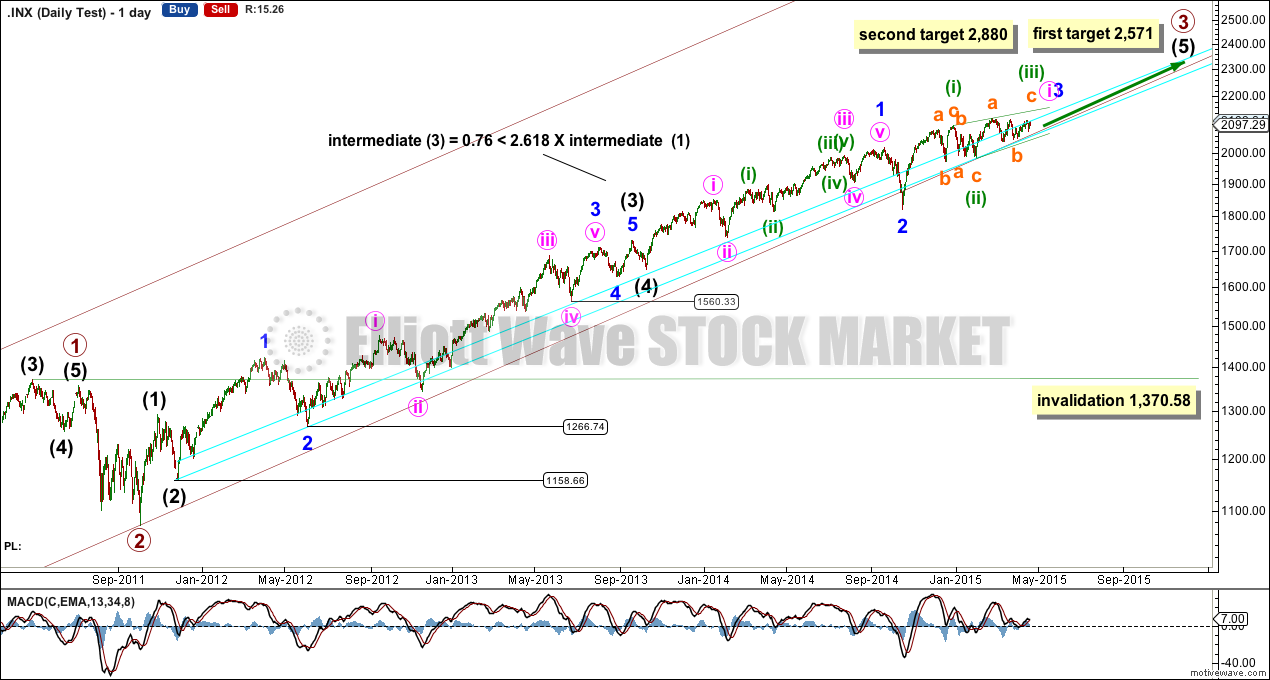
This daily chart shows primary waves 1, 2 and 3 so far.
In looking for a bullish alternate wave count there are a couple of things I want to retain. At the weekly chart level the strongest upwards momentum is within intermediate wave (3), and here intermediate wave (3) is just 0.76 points short of 2.618 the length of intermediate wave (1). Intermediate wave (3) has a perfect fit as an impulse, with a third wave extension in its middle. This has a very typical look.
I only want to consider alternate ideas which see intermediate waves (3) and (4) as labelled here.
When primary wave 4 arrives it may not move into primary wave 1 price territory below 1,370.58.
At 2,571 intermediate wave (5) would reach 2.618 the length of intermediate wave (3). Both intermediate waves (3) and (5) would be extended.
At 2,880 primary wave 3 would reach 2.618 the length of primary wave 1.
These targets are very bullish because this wave count sees intermediate wave (5) as only within its very early stages, and needs a lot more room for the structure to complete upwards.

Within intermediate wave (5) minor wave 1 subdivides as a five wave impulse. Minor wave 3 should have begun for this wave count.
Within minor wave 3 there is too much overlapping at the start for it to have reached its middle. The sideways movement labelled as a triangle for subminuette wave b may not be a second wave correction (second waves may not have a triangle as the sole corrective structure) nor may it be the first structure in a combination for a second wave because a triangle may not be the first corrective structure within a combination. Because this piece of movement may not be a second wave another possibility must be considered.
Minute wave i may be unfolding as a leading diagonal. Within the diagonal the third wave would be incomplete, and within the zigzag of minuette wave (iii) the triangle is subminuette wave b. This resolves the problem of this piece of movement not being a second wave.
Within a diagonal the following fourth wave correction should move back into first wave price territory and may not move below the end of minuette wave (ii) below 1,980.90.
The final reason for publishing this alternate wave count today is to illustrate why the price point 1,980.90 would provide such strong confirmation of a primary or cycle degree trend change; a new low below 1,980.90 would invalidate the only other bullish wave count that I have been able to see (and of which I am satisfied the subdivisions and Fibonacci ratios are correct).
If we see a new high above 2,119.59 in the next couple of weeks this bullish alternate may become my new main wave count. It is very bullish indeed.
Bear Wave Count
The subdivisions within primary waves A-B-C are seen in absolutely exactly the same way as primary waves 1-2-3 for the bull wave count. The alternate bull wave count idea also works perfectly for this bear wave count.
To see the difference at the monthly chart level between the bull and bear ideas look at the last historical analysis here.
At cycle degree wave b is over the maximum common length of 138% the length of cycle wave a, at 167% the length of cycle wave a. At 2,393 cycle wave b would be twice the length of cycle wave a and at that point this bear wave count should be discarded.
While we have no confirmation of this wave count we should assume the trend remains the same, upwards. This wave count requires confirmation before I have confidence in it. Full and final confirmation that the market is crashing would only come with a new low below 1,370.58. However, structure and momentum should tell us long before that point which wave count is correct, bull or bear.
This analysis is published about 08:34 p.m. EST.