
Upwards movement invalidated the hourly Elliott wave count. Both daily Elliott wave counts remain valid.
Summary: I still expect a continuation of downwards movement over the next few days to build downwards momentum. The target is at 1,981. A new low below 2,039.69 this week would see the alternate daily wave count discarded. If price continues upwards over the next few sessions a new high now above 2,114.86 would see the alternate daily wave count substantially increase in probability.
Click charts to enlarge.
Bullish Wave Count
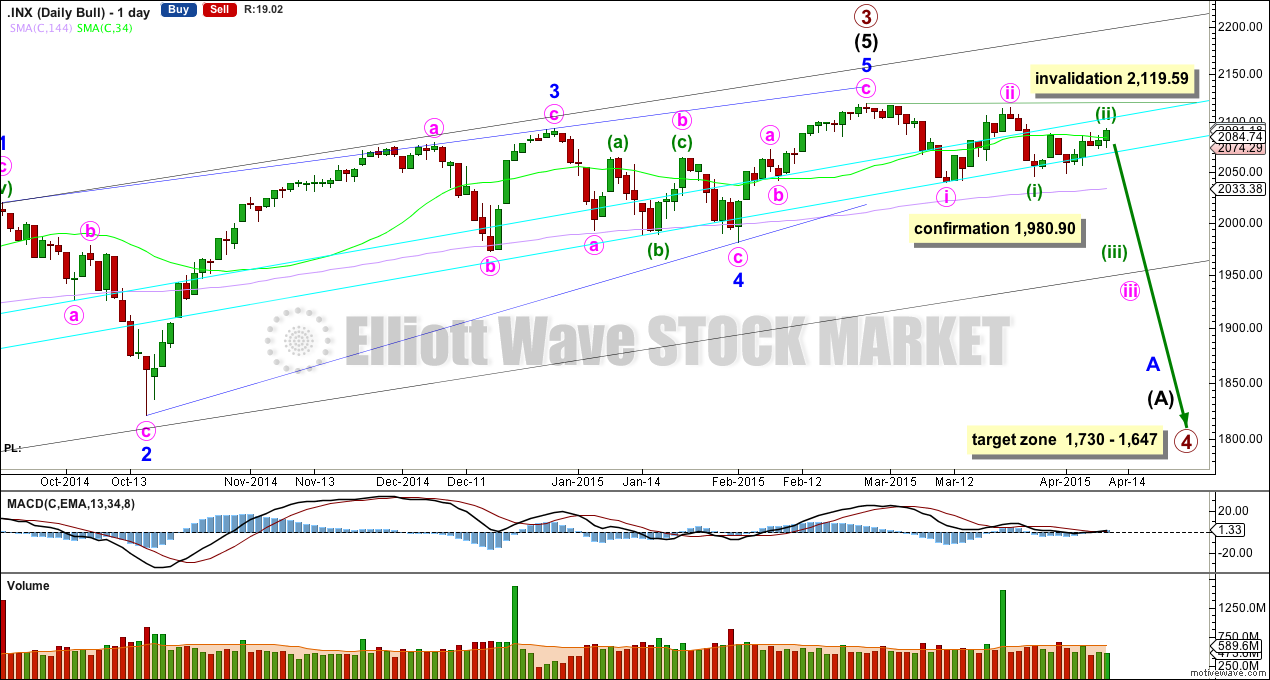
If primary wave 3 is over then primary wave 4 should begin. Upwards movement from the low at 666.79 subdivides now as a complete 5-3-5. For the bull wave count this is seen as primary waves 1-2-3. The wave count sees intermediate wave (5) as an ending contracting diagonal. Ending diagonals require all sub waves to be zigzags.
Primary wave 2 was a relatively shallow 0.41 zigzag lasting 12 weeks. Primary wave 4 may be more shallow and is most likely to be a flat, combination or triangle. It may be longer lasting than primary wave 2 as these types of sideways corrective structures tend to be more time consuming than zigzags. Primary wave 4 is likely to end in the price territory of the fourth wave of one lesser degree between 1,730 – 1,647. It may last about 13 or maybe even 21 weeks. So far it is ending its sixth week.
To see a weekly chart and how to draw the aqua blue trend lines and the black channel, go here. Primary wave 4 should break below the black channel.
Primary wave 4 may not move into primary wave 1 price territory below 1,370.58. Invalidation of this bull wave count would provide full confidence in the bear wave count.
Because primary wave 4 may be an expanded flat, running triangle or double combination it may include a new high beyond its start at 2,119.59. If this happens the bear wave count would be invalidated.
There is triple (quadruple?) divergence with price and MACD at the weekly chart level supporting the idea of a trend change, either already or coming up soon.
A close 3% or more of market value below the double aqua blue trend line would provide trend line confirmation of a sizeable trend change. I will only have confidence in this wave count when there is confirmation of this trend change.
A new low below 1,980.90 would provide further confirmation of a trend change.
Price is now just below the 34 day SMA (which is about where price is finding resistance) but remains above the 144 day SMA (I am playing with different time frames for moving averages and using Fibonacci numbers). A close below the longer 144 day SMA would add confidence in this trend change. A cross of the two moving averages with the 34 below the 144 day would also add confidence to this trend change. While we have neither this trend change remains unconfirmed.
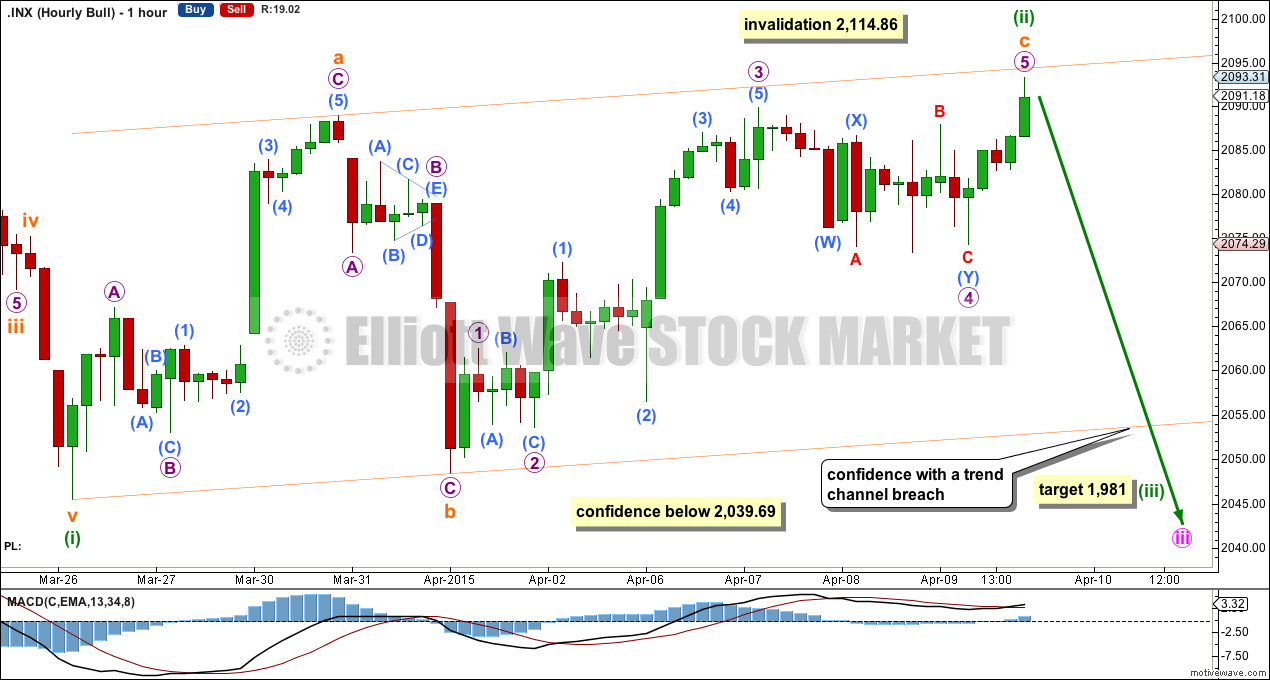
Minuette wave (ii) is a complete regular flat correction. Subminuette wave c continued higher and now subdivides as a more common impulse. Subminuette wave c is now just 1.46 points longer than equality in length with subminuette wave a, and has almost reached up to touch the upper edge of the channel about minuette wave (ii). If the final fifth wave of subminuette wave c continues any higher to start tomorrow’s session then I would expect continued strong resistance at this trend line.
In the short term a new low below 2,074.29 would provide some confidence that minuette wave (ii) is over. At that stage downwards movement could not be a second wave correction within micro wave 5 and so micro wave 5 would have to be over. This would increase the probability that subminuette wave c and so minuette wave (ii) would be over.
A breach below the channel about minuette wave (ii) would provide trend channel confirmation that minuette wave (ii) is over and minuette wave (iii) has begun.
A new low below 2,039.69 would provide confidence in this wave count at both the hourly and daily chart levels.
If minuette wave (ii) continues higher tomorrow it may not move beyond the start of minuette wave (i) above 2,114.86.
Alternate Bullish Wave Count
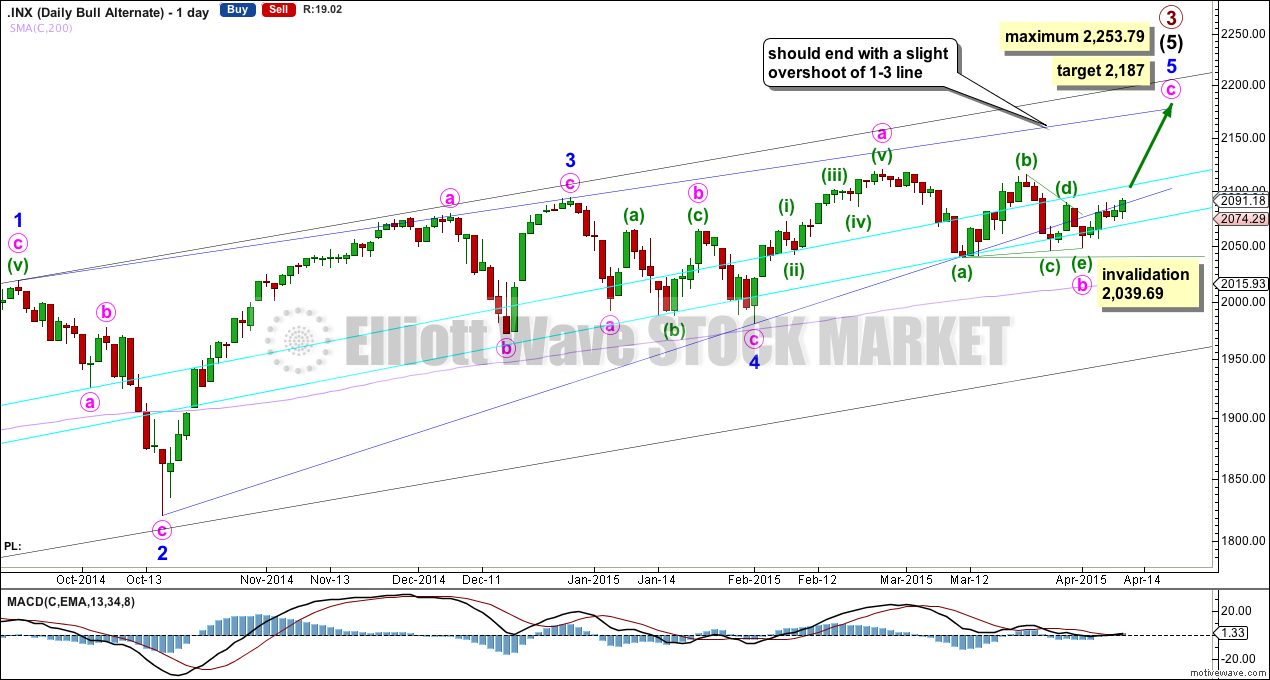
This alternate wave count is identical to the main wave count up to the low labelled minor wave 4. Thereafter, it sees minor wave 5 incomplete.
The lower 2-4 trend line of the contracting diagonal is now breached by three full daily candlesticks below it and not touching it. Diagonals normally adhere very well to their trend lines and this part of the wave count now looks wrong.
This wave count is still technically possible but it has a very low probability. The breach of the 2-4 trend line is the only reason why this wave count is an alternate.
Within the triangle of minute wave b, if minuette wave (c) continues further it may not move beyond the end of minuette wave (a) below 2,039.69. If we see a new low below this point this week I will discard this alternate wave count.
It is at this stage that this alternate wave count diverges from the main wave count. A new high above 2,114.86 would increase the probability of this alternate, and if it is correct we may see that this week.
Bear Wave Count
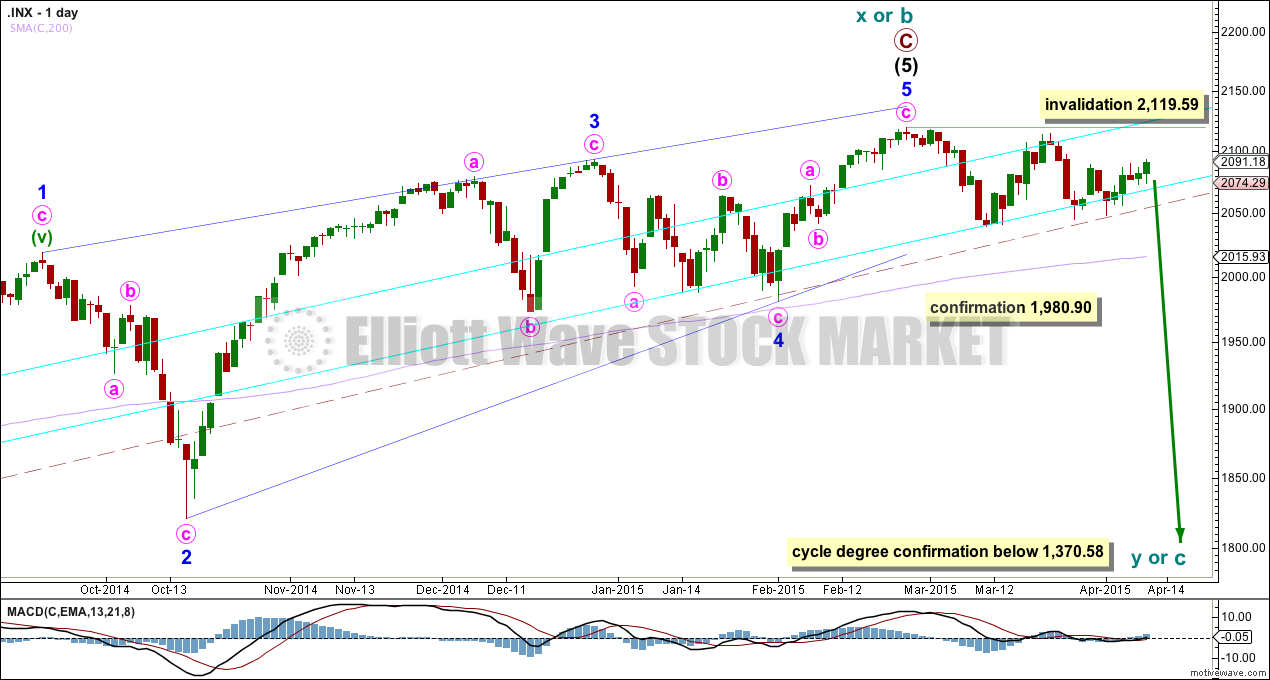
The subdivisions within primary waves A-B-C are seen in absolutely exactly the same way as primary waves 1-2-3 for the bull wave count. The alternate bull wave count idea also works perfectly for this bear wave count.
To see the difference at the monthly chart level between the bull and bear ideas look at the last historical analysis here.
At cycle degree wave b is over the maximum common length of 138% the length of cycle wave a, at 167% the length of cycle wave a. At 2,393 cycle wave b would be twice the length of cycle wave a and at that point this bear wave count should be discarded.
While we have no confirmation of this wave count we should assume the trend remains the same, upwards. This wave count requires confirmation before I have confidence in it. Full and final confirmation that the market is crashing would only come with a new low below 1,370.58. However, structure and momentum should tell us long before that point which wave count is correct, bull or bear.
This analysis is published about 12:35 a.m. EST.