
Upwards movement was expected for Monday. The invalidation point remains intact although the target at 2,072 was comfortably passed.
Summary: The main wave count now requires downwards movement which must subdivide as an impulse and should show an increase in downwards momentum. The target for the next wave down is now 1,976 which may be met in either five or eight sessions.
Click charts to enlarge.
Bullish Wave Count
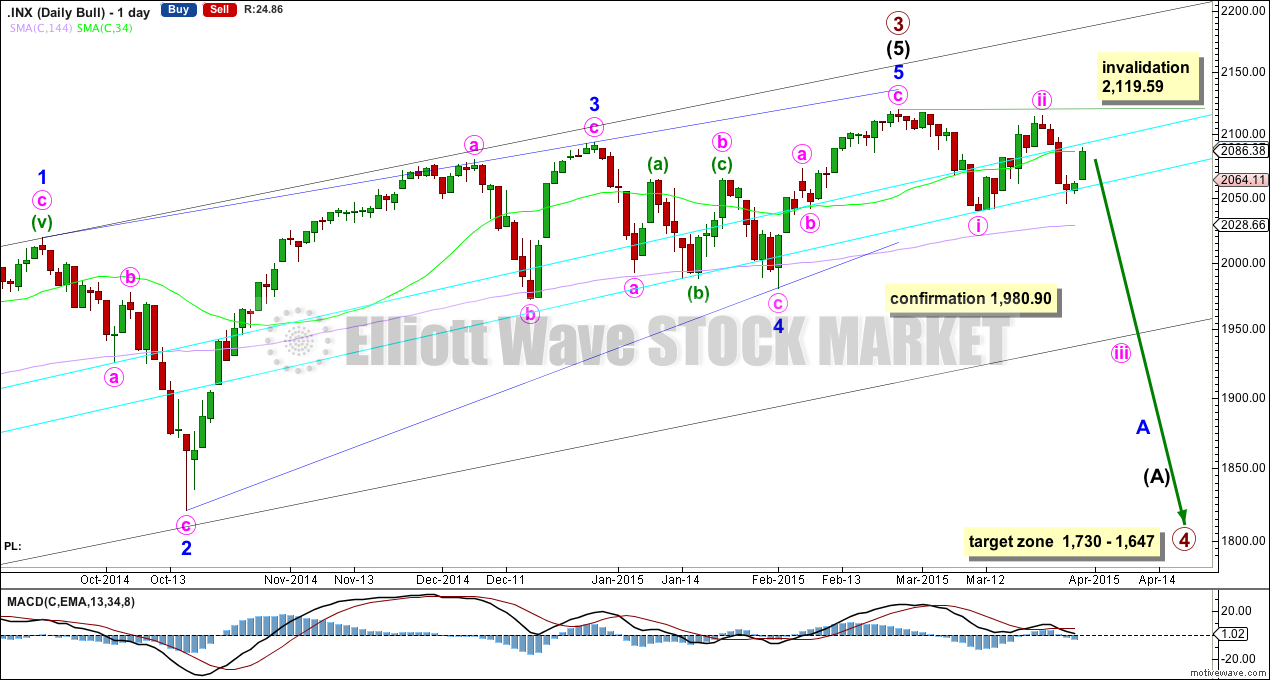
If primary wave 3 is over then primary wave 4 should begin. Upwards movement from the low at 666.79 subdivides now as a complete 5-3-5. For the bull wave count this is seen as primary waves 1-2-3. The wave count sees intermediate wave (5) as an ending contracting diagonal. Ending diagonals require all sub waves to be zigzags.
Primary wave 2 was a relatively shallow 0.41 zigzag lasting 12 weeks. Primary wave 4 may be more shallow and is most likely to be a flat, combination or triangle. It may be longer lasting than primary wave 2 as these types of sideways corrective structures tend to be more time consuming than zigzags. Primary wave 4 is likely to end in the price territory of the fourth wave of one lesser degree between 1,730 – 1,647. It may last about 13 or maybe even 21 weeks. So far it has started its fifth week.
To see a weekly chart and how to draw the aqua blue trend lines and the black channel, go here. Primary wave 4 should break below the black channel.
Primary wave 4 may not move into primary wave 1 price territory below 1,370.58. Invalidation of this bull wave count would provide full confidence in the bear wave count.
Because primary wave 4 may be an expanded flat, running triangle or double combination it may include a new high beyond its start at 2,119.59. If this happens the bear wave count would be invalidated.
There is triple (quadruple?) divergence with price and MACD at the weekly chart level supporting the idea of a trend change, either already or coming up soon.
A close at 1,990 or below would provide a close 3% of market value below the double aqua blue trend line, providing trend line confirmation of a sizeable trend change. I will only have confidence in this wave count when there is confirmation of this trend change.
A new low below 1,980.90 would provide further confirmation of a trend change.
Price is now below the 34 day SMA, but remains above the 144 day SMA (I am playing with different time frames for moving averages and using Fibonacci numbers). A close below the longer 144 day SMA would add confidence in this trend change. A cross of the two moving averages with the 34 below the 144 day would also add confidence to this trend change. While we have neither this trend change remains unconfirmed.
Volume for the last two up days is reduced from the prior two down days, which indicates this upwards movement is a correction and not a new trend.
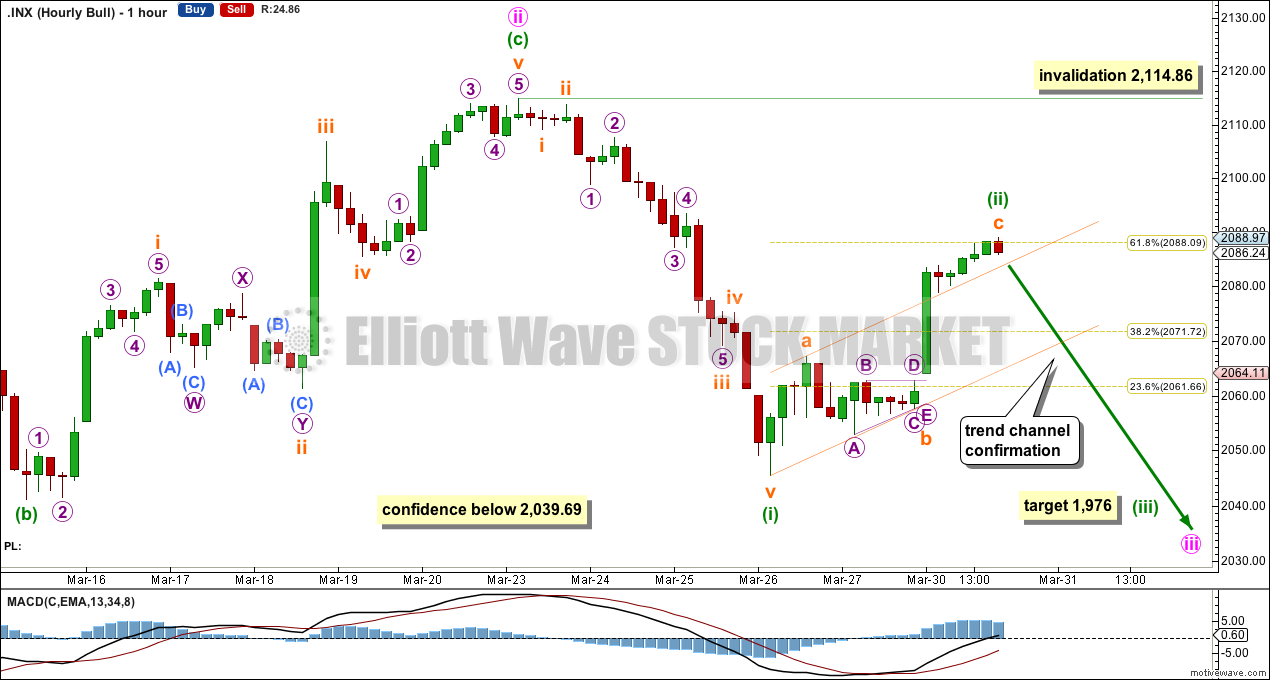
Minuette wave (ii) is now a complete 5-3-5 zigzag structure. There is no Fibonacci ratio between subminuette waves a and c. Minuette wave (ii) has ended close to the 0.618 Fibonacci ratio of minuette wave (i). I had expected it to be more shallow because it is within a third wave one degree higher. That is a tendency, but it is not always how it works.
It is very likely that minuette wave (ii) is over here, but there is not enough downwards movement at the end of Monday’s session to confirm it as complete. A breach of the small channel about it would provide confidence that the middle of a third wave down has begun.
At 1,976 minuette wave (iii) would reach 1.618 the length of minuette wave (i).
Minuette wave (iii) should show a clear strong increase in downwards momentum, must subdivide as an impulse, and should see an increase in volume on the daily chart.
When minuette waves (iii) and (iv) are complete then I will again calculate a target for minute wave iii to end for you. At that stage I will be able to calculate it at two wave degrees.
When minuette wave (iii) is over minuette wave (iv) should unfold as a shallow sideways correction which should show on the daily chart as two or more green candlesticks or doji.
While we have no confirmation that minuette wave (ii) is over the risk that it may continue higher must be accepted. It may not move beyond the start of minuette wave (i) above 2,114.86.
Minuette wave (i) lasted a Fibonacci three days. Third waves are often extended for the S&P and so usually last longer than first waves. Minuette wave (iii) may last a total of either five or eight days.
Alternate Bullish Wave Count
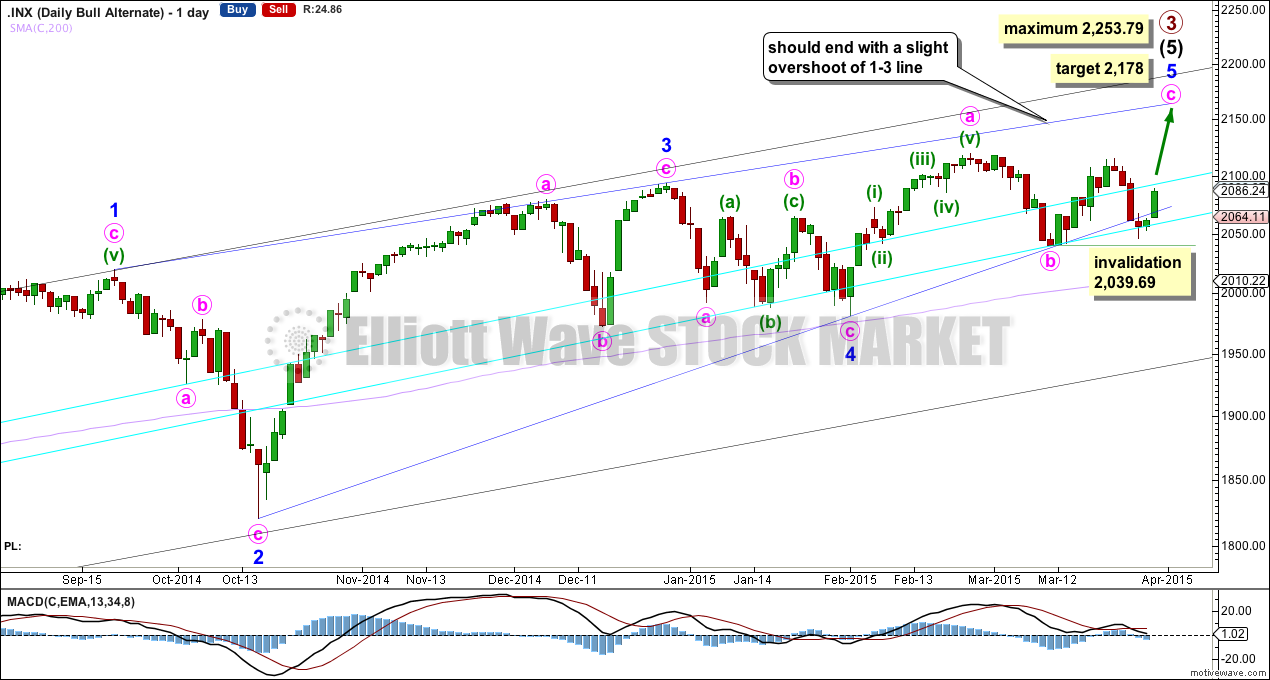
The lower 2-4 trend line of the contracting diagonal is now breached by one full daily candlestick below it and not touching it. Diagonals normally adhere very well to their trend lines and this wave count now looks wrong.
The breach is small. This wave count is still technically possible but it has substantially reduced in probability and must now be an alternate.
Within minute wave c no second wave correction may move beyond its start below 2,039.69.
This wave count is identical to the main wave count except for minor wave 5 being incomplete. It expects minor 5 to overshoot the 1-3 trend line because this is the most common tendency for fifth waves of contracting diagonals.
Bear Wave Count
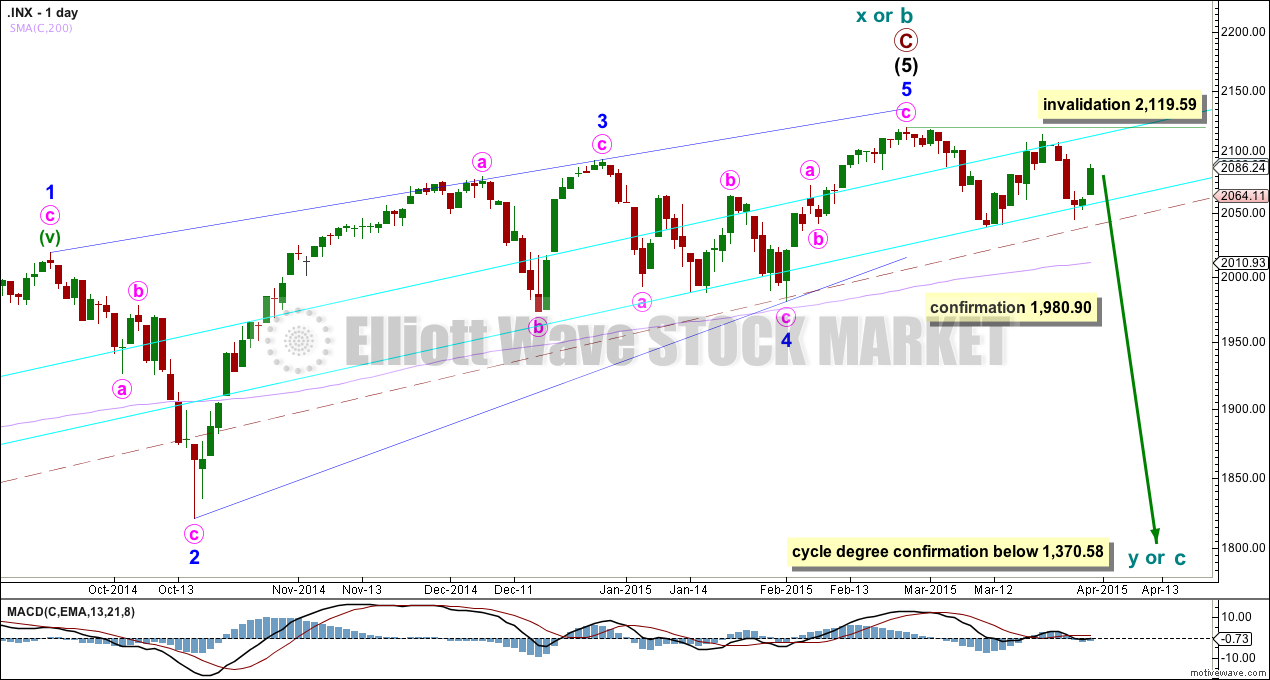
The subdivisions within primary waves A-B-C are seen in absolutely exactly the same way as primary waves 1-2-3 for the bull wave count. The alternate bull wave count idea also works perfectly for this bear wave count.
To see the difference at the monthly chart level between the bull and bear ideas look at the last historical analysis here.
At cycle degree wave b is over the maximum common length of 138% the length of cycle wave a, at 167% the length of cycle wave a. At 2,393 cycle wave b would be twice the length of cycle wave a and at that point this bear wave count should be discarded.
While we have no confirmation of this wave count we should assume the trend remains the same, upwards. This wave count requires confirmation before I have confidence in it. Full and final confirmation that the market is crashing would only come with a new low below 1,370.58. However, structure and momentum should tell us long before that point which wave count is correct, bull or bear.
This analysis is published about 06:31 p.m. EST.