
Some upwards / sideways movement was expected for Friday’s session.
Summary: The alternate wave count is now the main wave count. A little more upwards movement for Monday to about 2,072 should complete a small correction, and should be followed by downwards movement with an increase in momentum. The main wave count comes with the strong caveat: that a sizeable trend change is unconfirmed. I will retain an alternate while we do not have confirmation of a primary or cycle degree trend change.
Click charts to enlarge.
Bullish Wave Count
If primary wave 3 is over then primary wave 4 should begin.
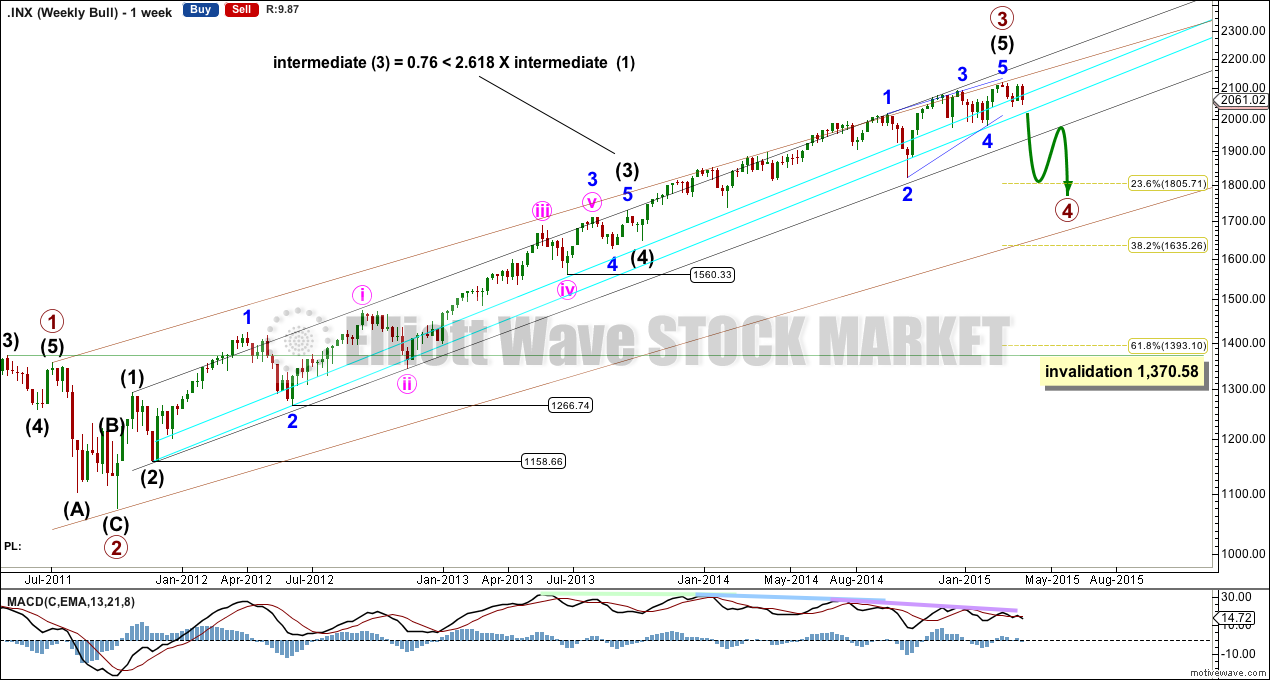
Primary wave 2 was a relatively shallow 0.41 zigzag lasting 12 weeks. Primary wave 4 may be more shallow and is most likely to be a flat, combination or triangle. It may be longer lasting than primary wave 2 as these types of sideways corrective structures tend to be more time consuming than zigzags. Primary wave 4 is likely to end in the price territory of the fourth wave of one lesser degree between 1,730 – 1,647. It may last about 13 or maybe even 21 weeks. So far it has completed its fourth week.
This weekly chart shows how I have drawn the aqua blue trend lines: draw the first trend line from the low labelled intermediate wave (2) within primary wave 3 to the next swing low labelled minor wave 2, then create a parallel copy and push it up to sit on the low labelled minute wave iv within minor wave 3 of intermediate wave (3). On the weekly chart this lower trend line perfectly shows where minor wave 4 within the ending diagonal of intermediate wave (5) ended.
The black channel is an Elliott channel drawn about primary wave 3: draw the first trend line from the highs of intermediate waves (1) to (3), then place a parallel copy on the low of intermediate wave (2). Primary wave 4 should break out of this black channel containing primary wave 3, and that would provide final trend channel confirmation of a primary degree correction.
The maroon channel is an Elliott channel drawn about cycle wave V: draw the first trend line from the highs of primary waves 1 to 3, then place a parallel copy on the low of primary wave 3. Primary wave 4 may remain contained within this channel. If this wider maroon channel is breached by strong downwards movement that would favour the bear wave count over this bull wave count.
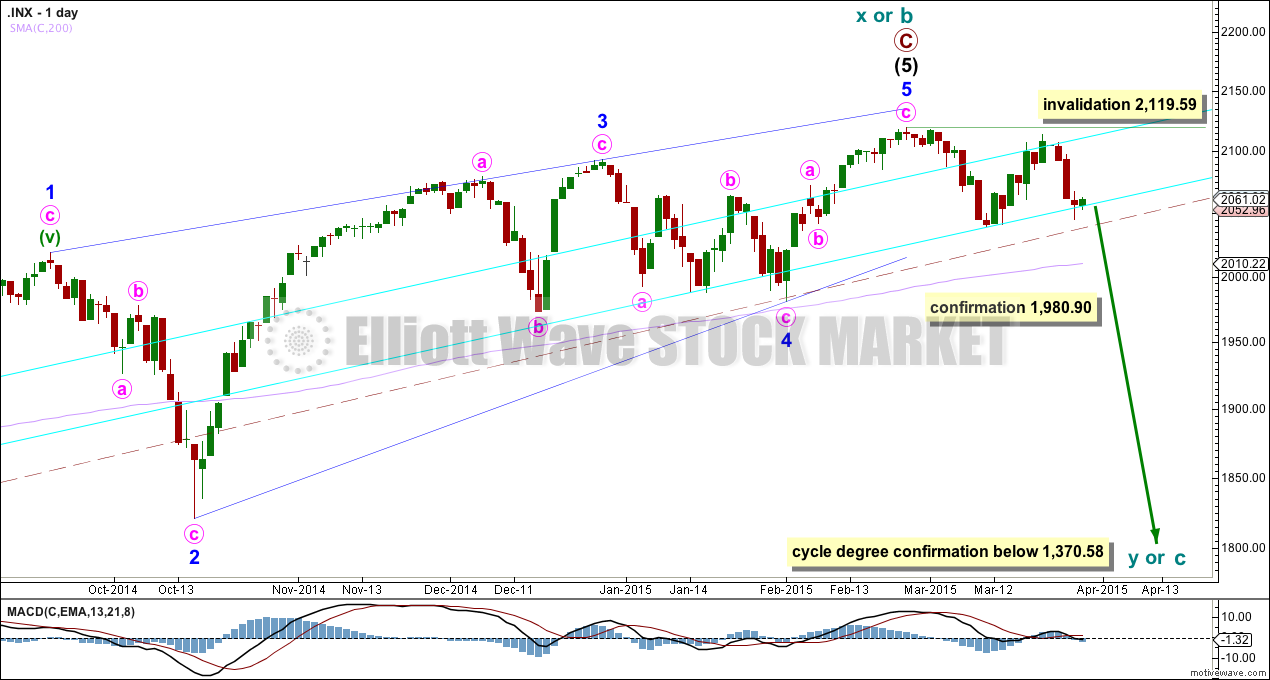
Primary wave 4 may not move into primary wave 1 price territory below 1,370.58. Invalidation of this bull wave count would provide full confidence in the bear wave count.
Because primary wave 4 may be an expanded flat, running triangle or double combination it may include a new high beyond its start at 2,119.59. If this happens the bear wave count would be invalidated.
There is triple (quadruple?) divergence with price and MACD supporting the idea of a trend change, either already or coming up soon.
Upwards movement from the low at 666.79 subdivides now as a complete 5-3-5. For the bull wave count this is seen as primary waves 1-2-3. The wave count sees intermediate wave (5) as an ending contracting diagonal. Ending diagonals require all sub waves to be zigzags.
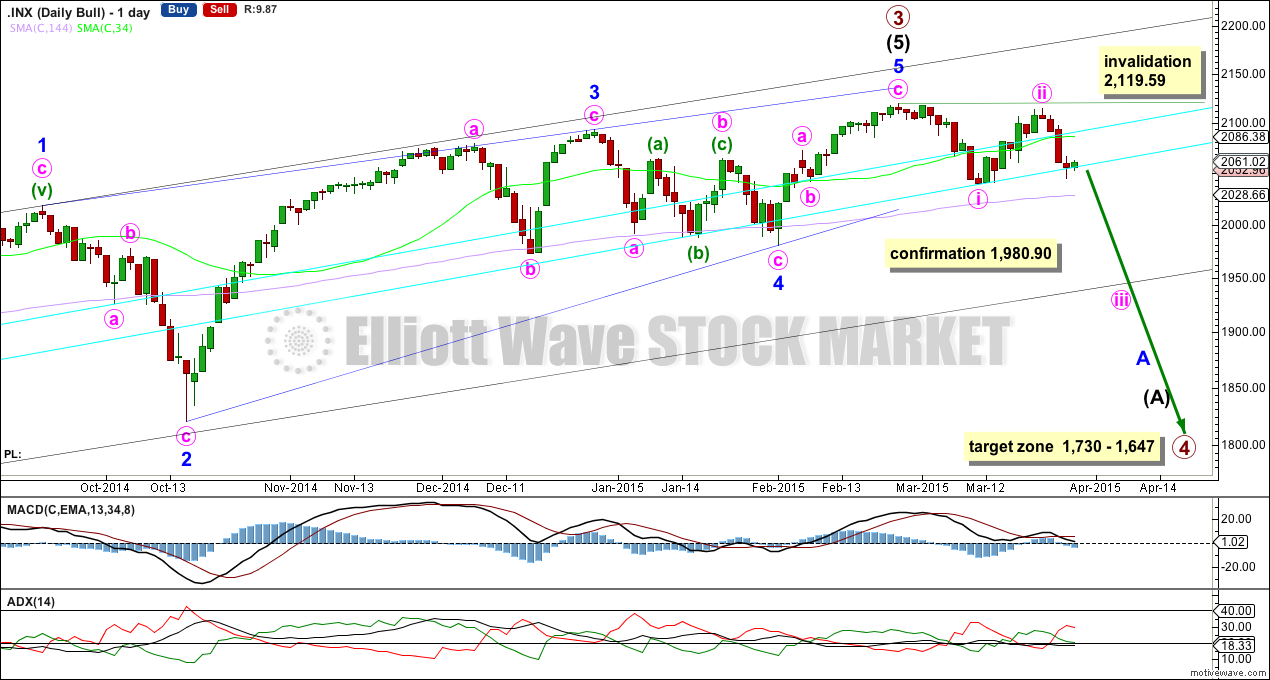
Unfortunately, the aqua blue trend lines do not copy over to the daily chart perfectly. Here price is again at the lower line, where the weekly chart shows it above this line. I will follow the daily chart at this stage.
At this stage price has is testing the lower aqua blue trend line. A close at 1,990 or below would provide a close 3% of market value below the trend line, providing trend line confirmation of a sizeable trend change. I will only have confidence in this wave count when there is confirmation of this trend change.
A new low below 1,980.90 would provide further confirmation of a trend change.
ADX indicates the trend is down as of three days ago. Price is now below the 34 day SMA, but remains above the 144 day SMA (I am playing with different time frames for moving averages and using Fibonacci numbers). A close below the longer 144 day SMA would add confidence in this trend change. A cross of the two moving averages with the 34 below the 144 day would also add confidence to this trend change. While we have neither this trend change remains unconfirmed.
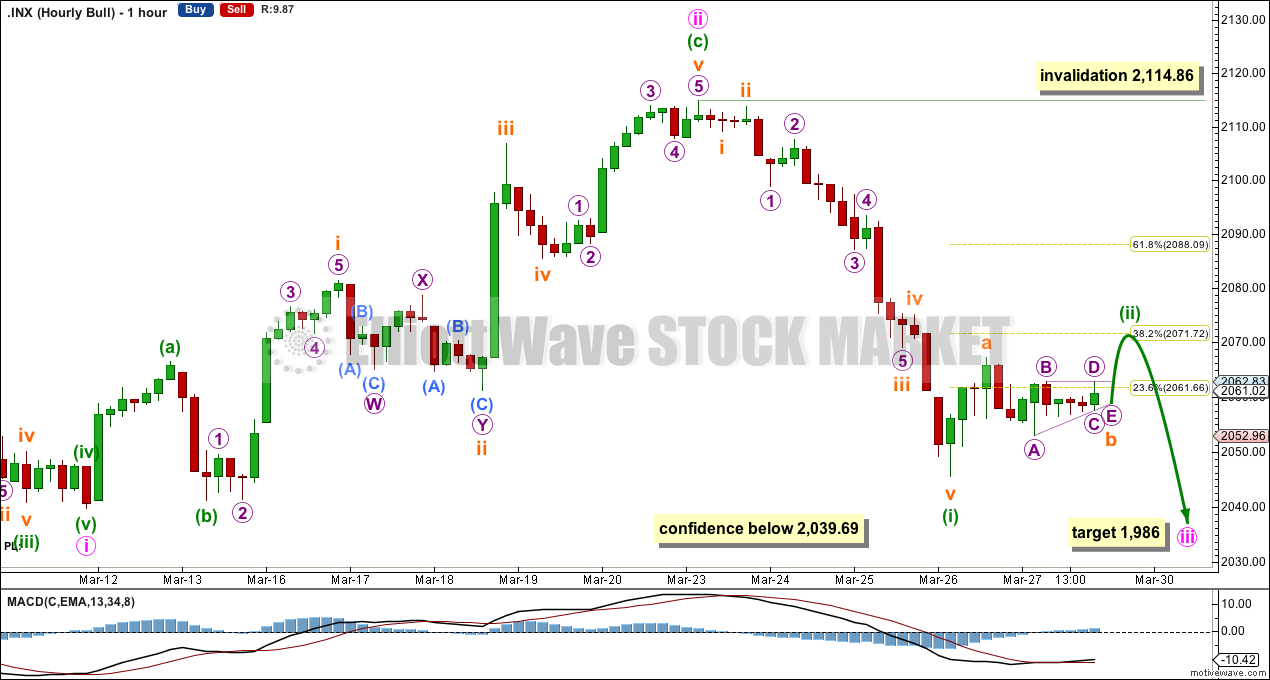
At 1,986 minute wave iii would reach 1.618 the length of minute wave i. Minute wave i lasted 10 days. Minute wave iii should be expected to be longer in duration, and may last a total Fibonacci 13 days. So far it has taken 4 days.
Minuette wave (ii) is incomplete. About 2,072 subminuette wave c would reach 0.618 the length of subminuette wave a, and minuette wave (ii) would correct to the 0.382 Fibonacci ratio of minuette wave (i). Because this is a second wave correction within a third wave one degree higher it may be forced to be more brief and / or shallow than normal by the strong downwards pull of minute wave iii.
Minuette wave (ii) may not move beyond the start of minuette wave (i) above 2,114.86.
Minuette wave (ii) may end on Monday.
Alternate Bullish Wave Count
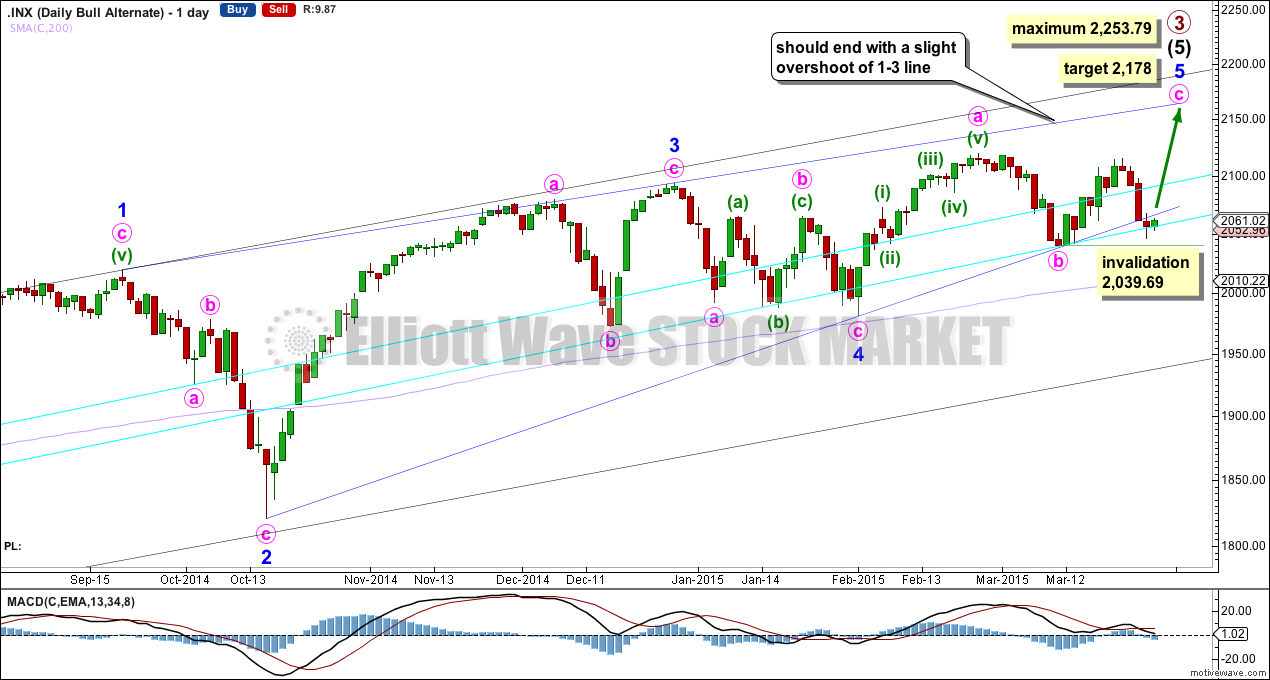
The lower 2-4 trend line of the contracting diagonal is now breached by one full daily candlestick below it and not touching it. Diagonals normally adhere very well to their trend lines and this wave count now looks wrong.
The breach is small. This wave count is still technically possible but it has substantially reduced in probability and must now be an alternate. If the breach gets bigger I must discard this wave count.
Within minute wave c no second wave correction may move beyond its start below 2,039.69.
This wave count is identical to the main wave count except for minor wave 5 being incomplete. It expects minor 5 to overshoot the 1-3 trend line because this is the most common tendency for fifth waves of contracting diagonals.
Bear Wave Count
The subdivisions within primary waves A-B-C are seen in absolutely exactly the same way as primary waves 1-2-3 for the bull wave count. The alternate bull wave count idea also works perfectly for this bear wave count.
To see the difference at the monthly chart level between the bull and bear ideas look at the last historical analysis here.
At cycle degree wave b is over the maximum common length of 138% the length of cycle wave a, at 167% the length of cycle wave a. At 2,393 cycle wave b would be twice the length of cycle wave a and at that point this bear wave count should be discarded.
While we have no confirmation of this wave count we should assume the trend remains the same, upwards. This wave count requires confirmation before I have confidence in it. Full and final confirmation that the market is crashing would only come with a new low below 1,370.58. However, structure and momentum should tell us long before that point which wave count is correct, bull or bear.
This analysis is published about 01:29 a.m. EST.