
Downwards movement favours the alternate Elliott wave count over the main Elliott wave count.
Summary: Thursday’s candlestick overshoots but does not breach the lower 2-4 trend line. If tomorrow’s candlestick remains below and not touching that trend line, I must discard the main wave count in favour of the alternate. The alternate expects a third wave down is nearing its middle.
Click charts to enlarge.
Bullish Wave Count
Upwards movement from the low at 666.79 subdivides as an incomplete 5-3-5. For the bull wave count this is seen as primary waves 1-2-3.
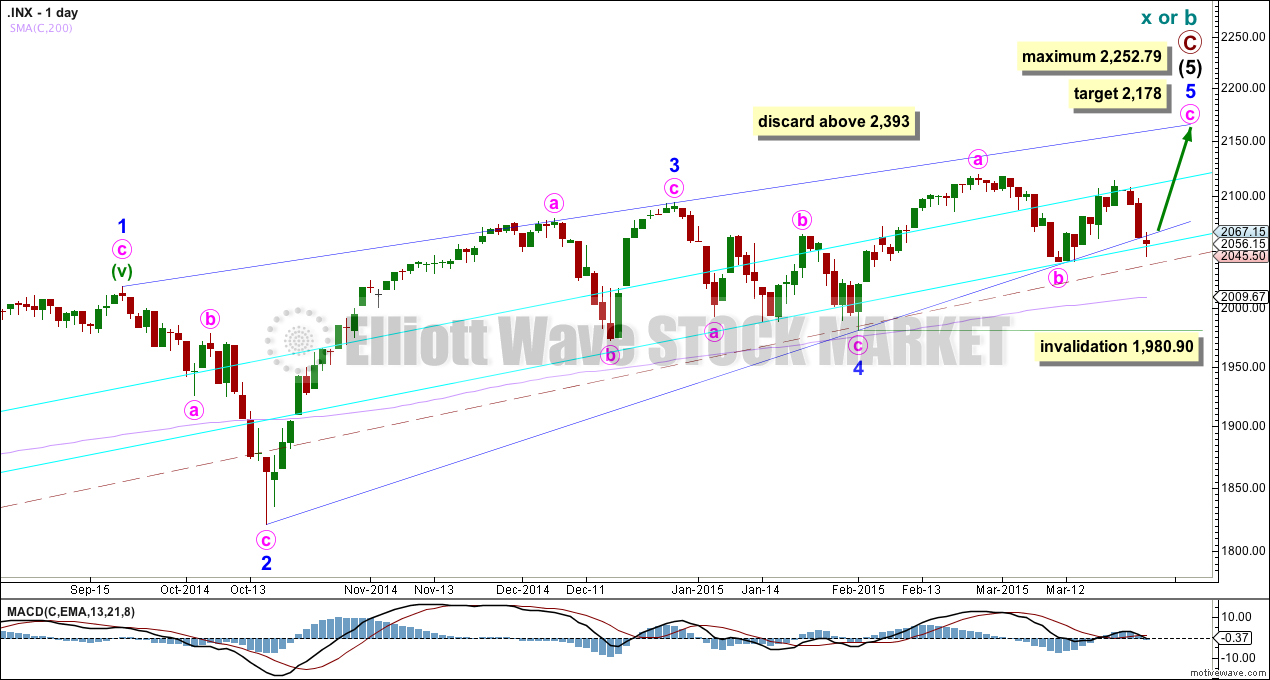
The aqua blue trend lines are traditional technical analysis trend lines. These lines are long held (the lower one has its first anchor in November, 2011), repeatedly tested, and shallow enough to be highly technically significant. To see a weekly chart where I have drawn these trend lines click here.
At this stage price has begun to again test the lower aqua blue trend line. A close at 1,990 or below would provide a close 3% of market value below the trend line, providing trend line confirmation of a sizeable trend change.
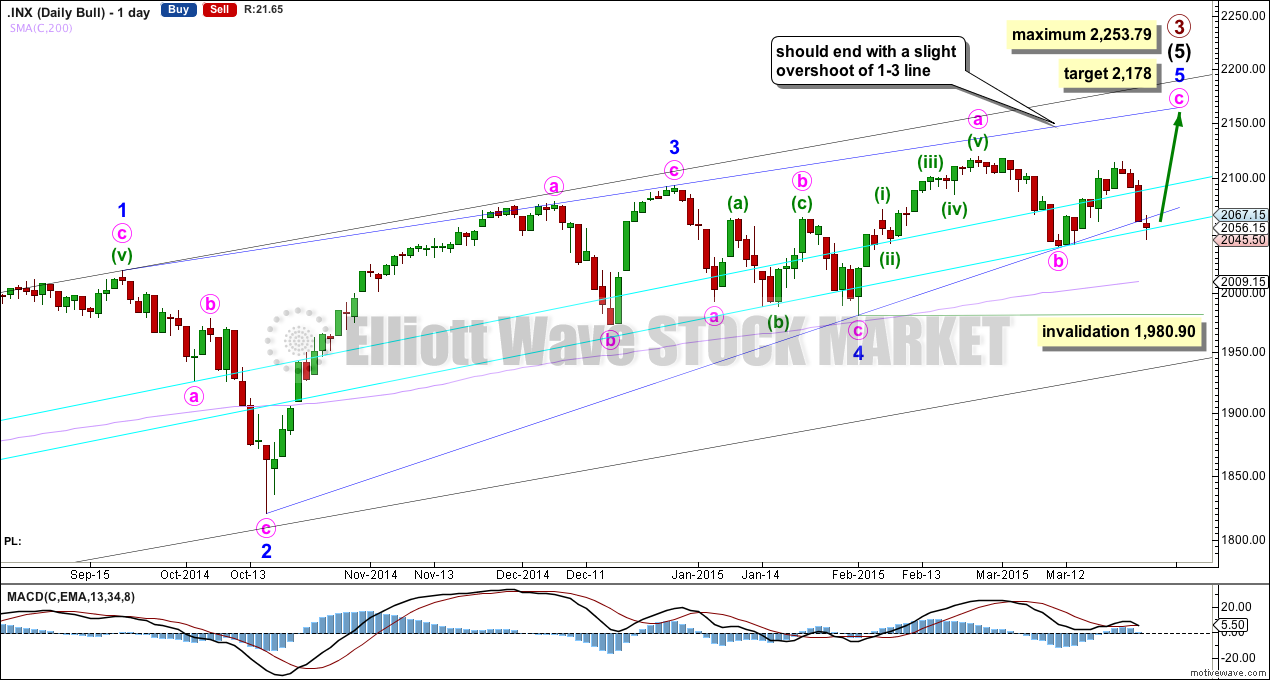
The wave count sees intermediate wave (5) as an ending contracting diagonal. Ending diagonals require all sub waves to be zigzags.
The diagonal is contracting. Minor waves 2 and 4 are more shallow than second and fourth waves within diagonals normally are. In this case they may have been forced to be more shallow by support offered from the double aqua blue trend line.
Because the third wave within the contracting diagonal is shorter than the first wave and a third wave may never be the shortest wave, this limits the final fifth wave to no longer than equality with the third wave at 2,253.79.
Within minor wave 5 minute wave b may not move beyond the start of minute wave a below 1,980.90.
The lower blue 2-4 trend line of the diagonal is overshot, but not yet breached. However, this is a sizeable overshoot and so I would expect another one to three days should provide a clear breach of this trend line at which stage this wave count would be discarded. Diagonals normally adhere closely to their trend lines.
At 2,178 minute wave c would reach equality in length with minute wave a.
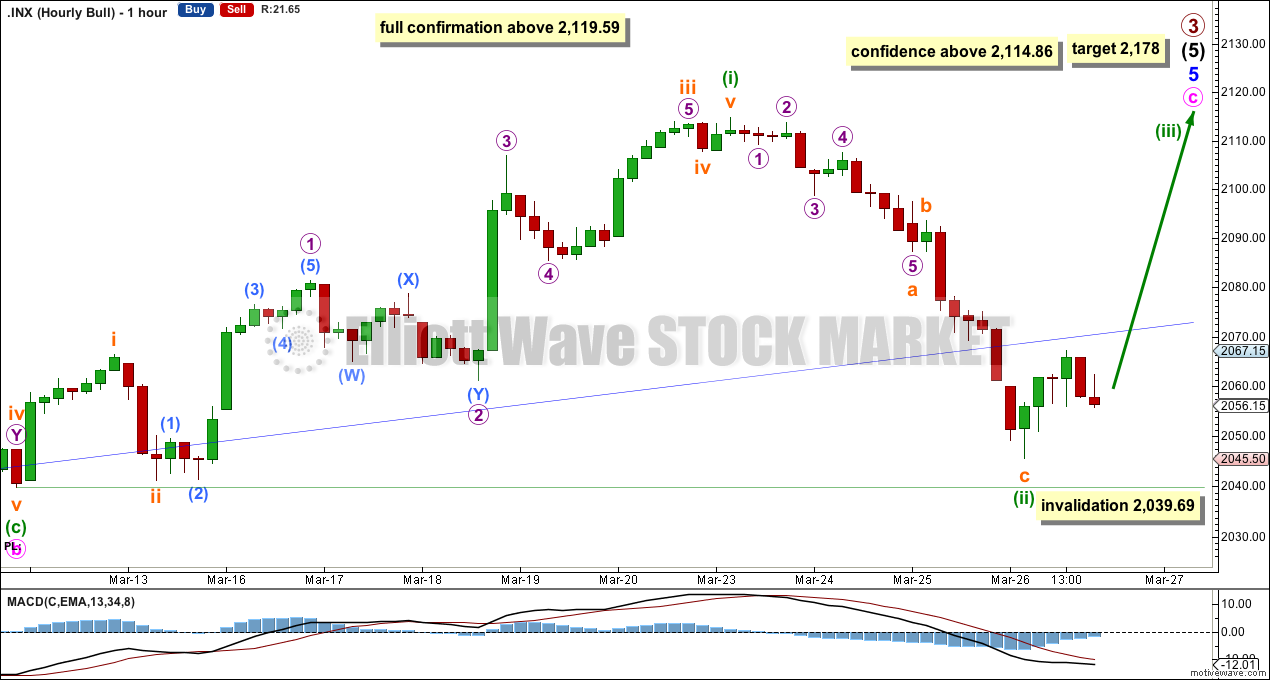
This wave count requires upwards movement from here. The strong overshoot of the blue 2-4 trend line on the daily chart today puts this wave count in serious doubt. A third wave up should continue and should increase upwards momentum tomorrow if this wave count is correct.
Minuette wave (ii) may not move beyond the start of minuette wave (i) below 2,039.69.
Alternate Bullish Wave Count
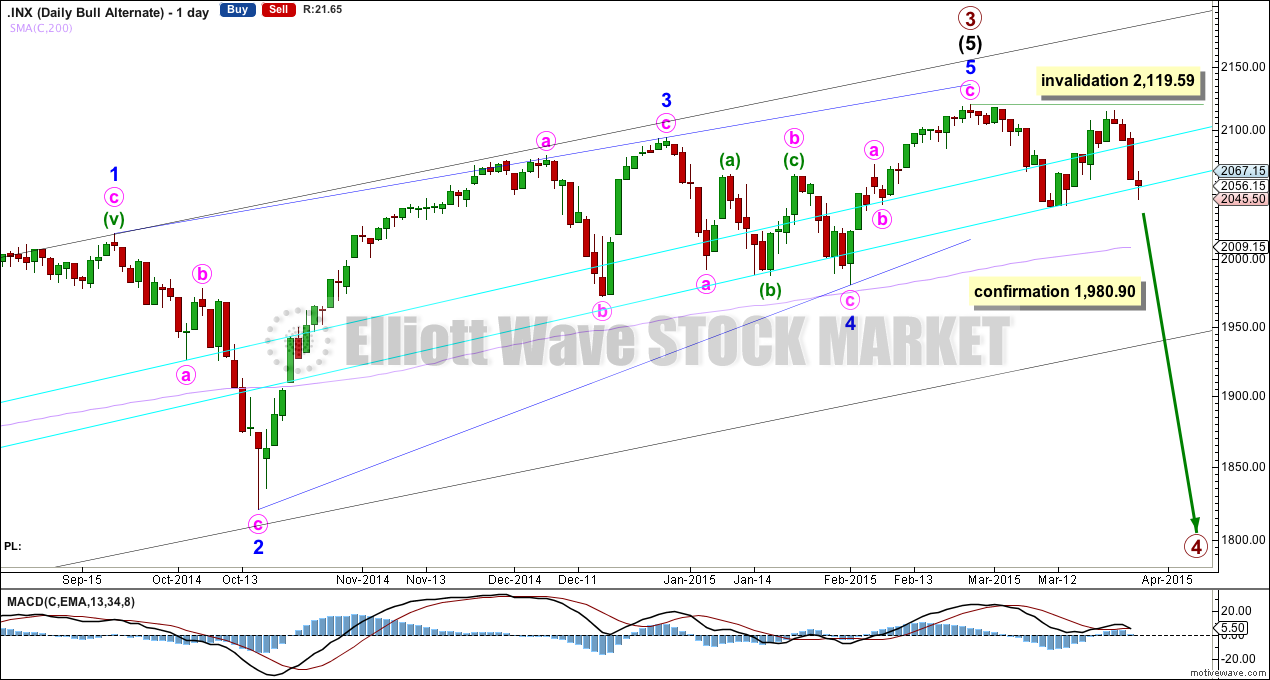
This wave count is identical to the main wave count up to the low labelled minor wave 4. Thereafter, this alternate looks at the possibility that minor wave 5 may be over. Minor wave 5 would have fallen slightly short of the 1-3 trend line. This is unusual but does occasionally happen for fifth waves of contracting diagonals.
We should always assume the trend remains the same until proven otherwise. At this stage I will not state a preference for either wave count, and it must be left to the market over the next one to three days to tell us which one is correct. This alternate wave count calls for a primary degree trend change which should last months, so waiting for some confirmation before having confidence in this wave count would be a wise idea.
A new low below 1,980.90 would invalidate the main wave count. A close below 1,990 would provide added confidence in this wave count. At that stage I would expect that downwards movement may be the early stages of primary wave 4. The bearish wave count below would also be entirely possible, but would require further confirmation.
Primary wave 2 was a 0.41 zigzag correction lasting 62 days in total. I would expect primary wave 4 to be more shallow because it may find support at the lower edge of an Elliott channel (which must be drawn on a weekly chart at this stage). Primary wave 4 should break out of the black channel copied over here from the weekly chart (this is a channel containing primary wave 3). A breach of that channel would provide further confidence that primary wave 3 is over and primary wave 4 is underway.
Primary wave 4 may end within the price territory of the fourth wave of one lesser degree which is between 1,730 to 1,647.
Primary wave 4 may last about a Fibonacci 55 days if it is a flat correction. If it is a combination or triangle it may be more time consuming, maybe up to a Fibonacci 89 days.
The new downwards movement has an ambiguous first wave down, which may be seen as either a three or a five. It would most likely be a five because the first wave down is more likely to be an impulse than a leading diagonal.
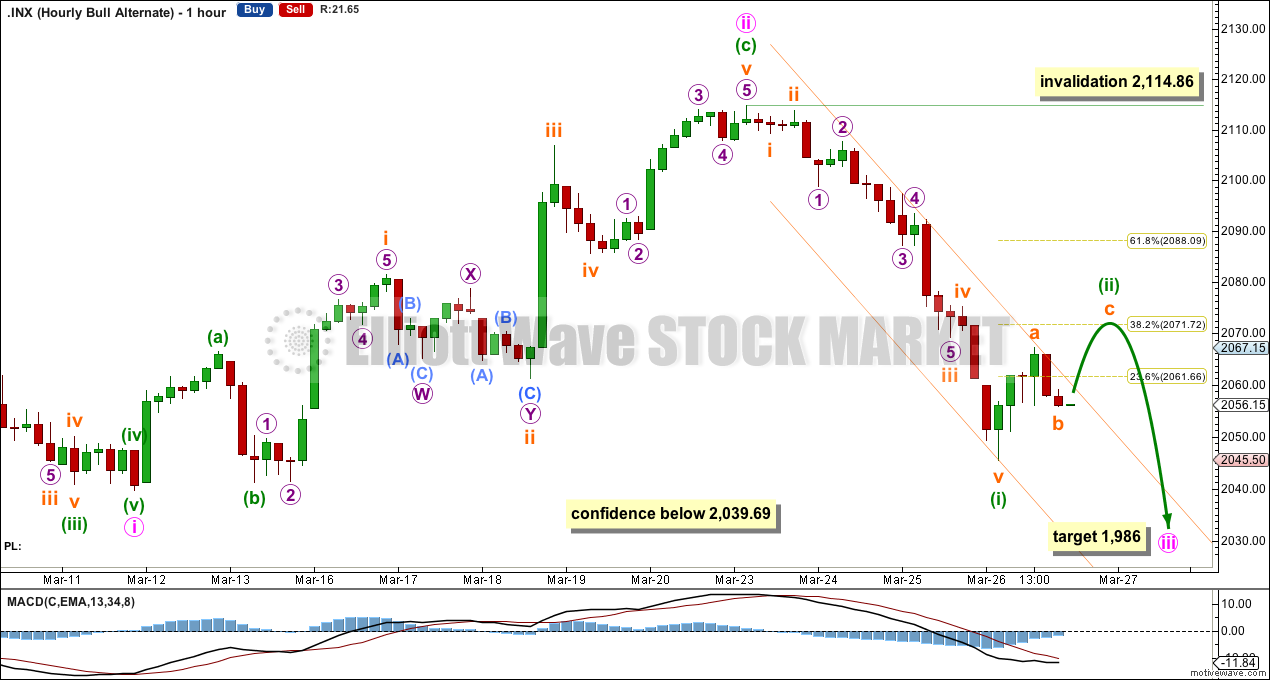
This wave count expects a third wave down to continue tomorrow. At 1,986 minute wave iii would reach 1.618 the length of minute wave i.
Minute wave iii must move below the end of minute wave i at 2,039.69. A new low below this point would add substantial confidence to this alternate wave count at this stage.
Within minute wave iii minuette wave (i) may now be seen as complete. Minuette wave (ii) may end about the 0.382 or 0.618 Fibonacci ratio of minuette wave (i). I slightly favour the 0.382 Fibonacci ratio in this instance because if subminuette wave b is over at the close of Thursday’s session then subminuette waves a and c would be close to equality in length. This is a second wave within a third wave one degree higher and the strong downwards pull of minute wave iii may force this second wave to be more shallow than second waves normally are.
Minuette wave (ii) may not move beyond the start of minuette wave (i) above 2,114.86.
Bear Wave Count
The subdivisions within primary waves A-B-C are seen in absolutely exactly the same way as primary waves 1-2-3 for the bull wave count. The alternate bull wave count idea also works perfectly for this bear wave count.
To see the difference at the monthly chart level between the bull and bear ideas look at the last historical analysis here.
At cycle degree wave b is over the maximum common length of 138% the length of cycle wave a, at 167% the length of cycle wave a. At 2,393 cycle wave b would be twice the length of cycle wave a and at that point this bear wave count should be discarded.
While we have no confirmation of this wave count we should assume the trend remains the same, upwards. This wave count requires confirmation before I have confidence in it.
This analysis is published about 08:52 p.m. EST.