
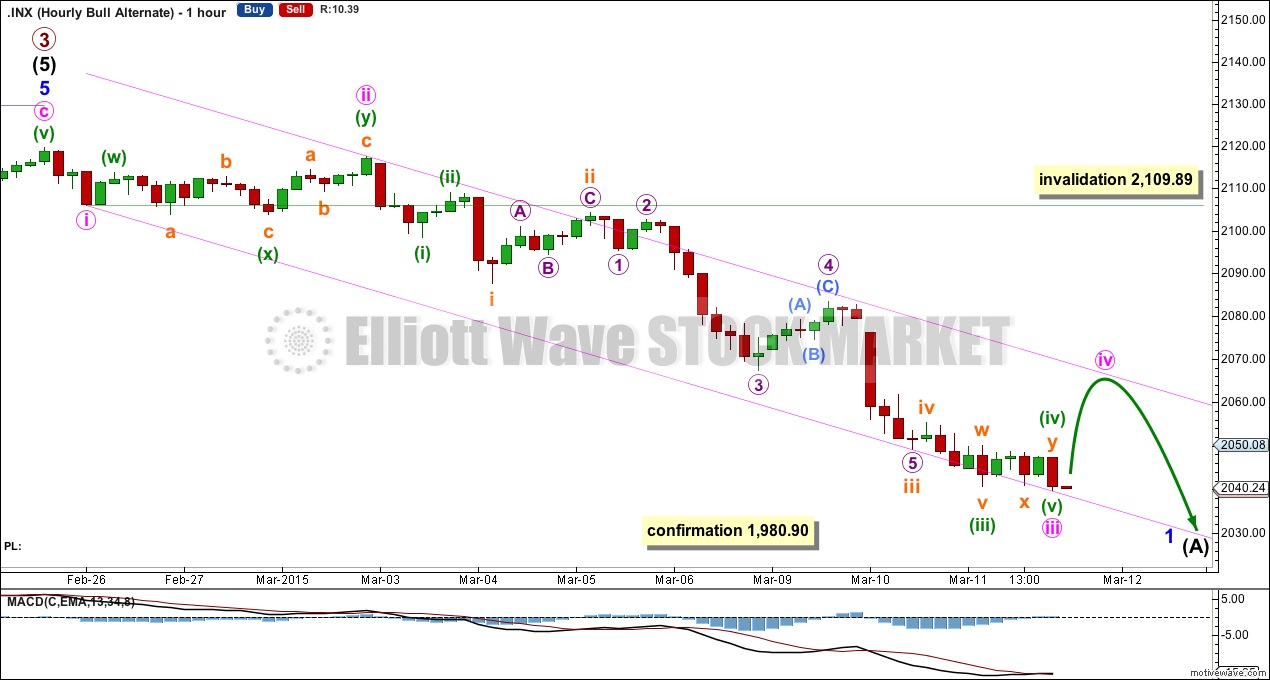
A little downwards movement was expected for both hourly Elliott wave counts. Price is finding strong support at the lower blue 2-4 diagonal trend line, and at the lower aqua blue TA trend line.
Summary: With price right at two trend lines providing support, how price behaves over the next few days will tell us which wave count is more likely. I expect a bounce up from here. The main wave count expects the bounce to make new highs; a new high above 2,109.89 would be strong indication that the main wave count is correct. More downwards movement to breach the blue 2-4 trend line of the diagonal would be strong indication that the alternate wave count is correct. The main wave count expects upwards movement to resume tomorrow with a green candlestick, for nine more sessions to 2,178. The main wave count expects a major turn on 25th March (give or take one to two days either side of this date).
Click charts to enlarge.
Bullish Wave Count
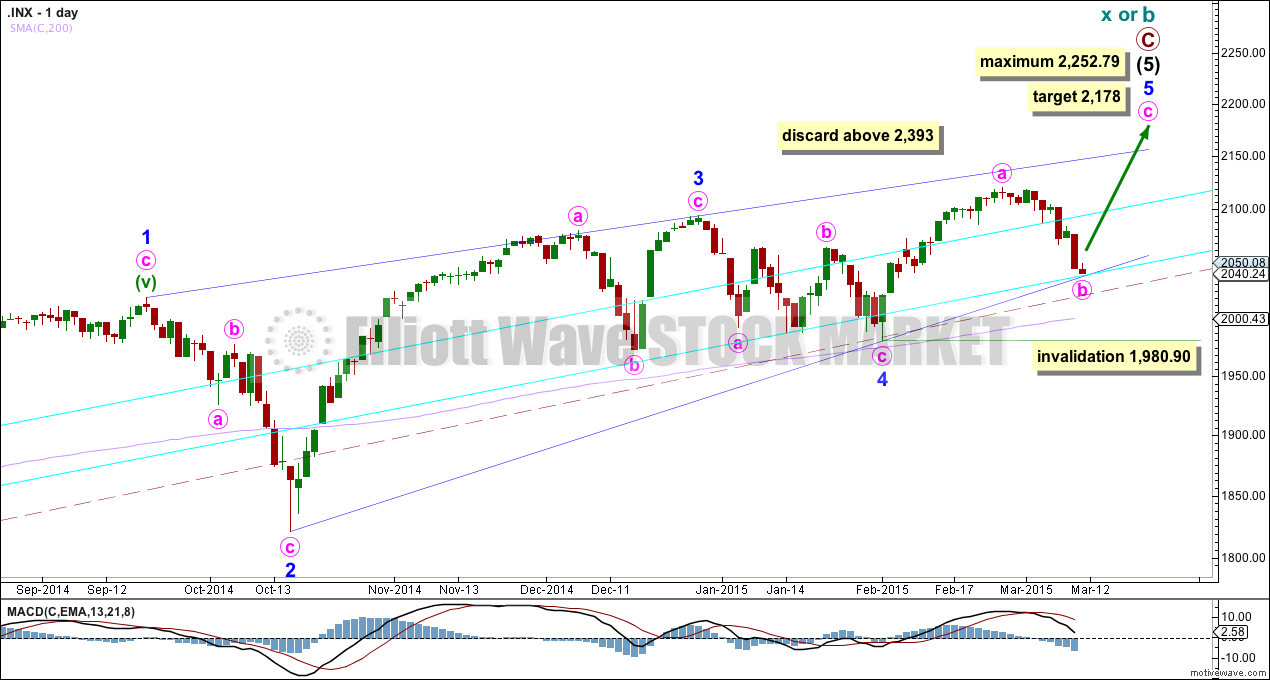
Upwards movement from the low at 666.79 subdivides as an incomplete 5-3-5. For the bull wave count this is seen as primary waves 1-2-3.
The aqua blue trend lines are traditional technical analysis trend lines. These lines are long held (the lower one has its first anchor in November, 2011), repeatedly tested, and shallow enough to be highly technically significant. When the lower of these double trend lines is breached by a close of 3% or more of market value that should indicate a trend change. It does not indicate what degree the trend change should be though. It looks like the last five corrections may have ended about the lower aqua blue trend line, which gives the wave count a typical look. To see a weekly chart where I have drawn these trend lines go here.
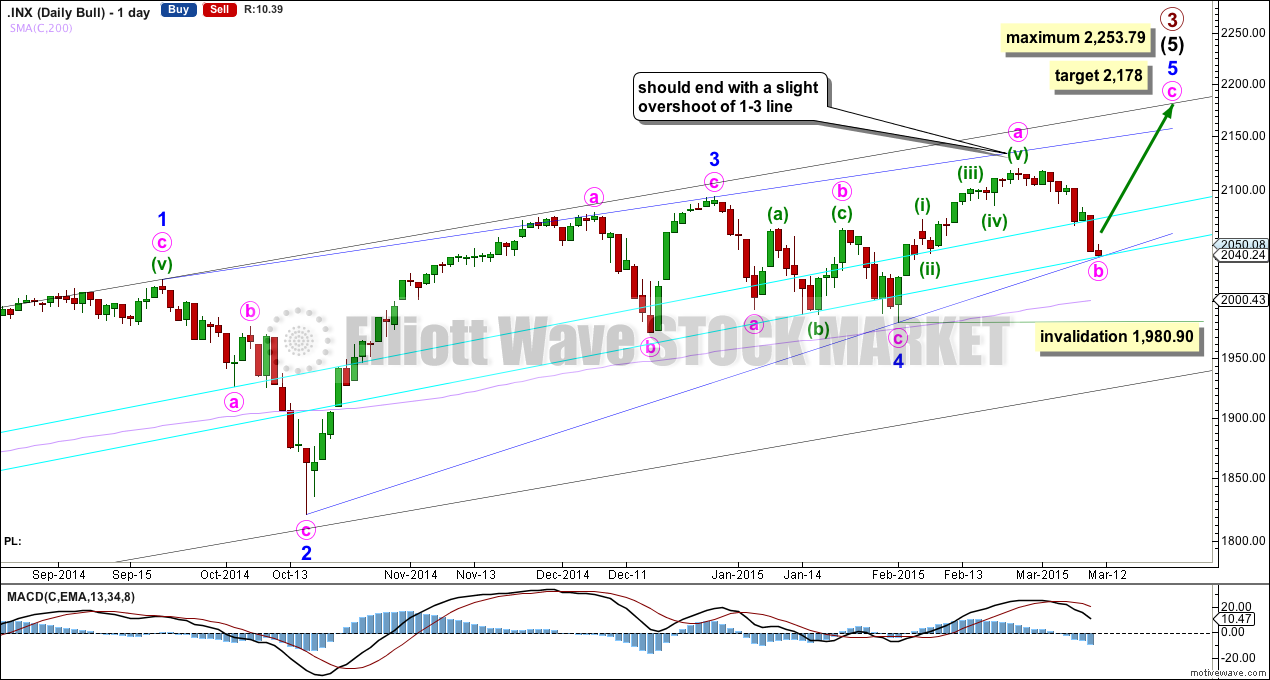
The wave count sees intermediate wave (5) as an ending contracting diagonal. Ending diagonals require all sub waves to be zigzags. So far this is a perfect fit. Minor wave 3 has stronger momentum than minor wave 5 on the daily chart.
The diagonal is contracting. The only problem with this possibility is that minor waves 2 and 4 are more shallow than second and fourth waves within diagonals normally are. In this case they may have been forced to be more shallow by support offered from the double aqua blue trend lines.
Because the third wave within the contracting diagonal is shorter than the first wave and a third wave may never be the shortest wave, this limits the final fifth wave to no longer than equality with the third wave at 2,253.79.
Within intermediate wave (5) minor wave 1 lasted 238 days (5 days longer than a Fibonacci 233), minor wave 2 lasted 18 days (2 short of a Fibonacci 21), minor wave 3 lasted 51 days (4 short of a Fibonacci 55) and minor wave 4 lasted 23 days (2 longer than a Fibonacci 21). While none of these durations are perfect Fibonacci numbers, they are all reasonably close. So far minor wave 5 has lasted 25 days and the structure looks incomplete. It may now end close to a total Fibonacci 34 sessions, so may continue for a further 9 sessions give or take one to two days either side of this expectation. This gives a possible end date of 25th March, 2015.
Within minor wave 5 minute wave b may not move beyond the start of minute wave a below 1,980.90.
Contracting diagonals normally have fifth waves which end with a slight overshoot of the 1-3 trend line. Because this is such a common tendency I will still expect more upwards movement to see this trend line overshot. It is possible that the fifth wave is over already, and this idea is presented as an alternate.
Diagonals almost always adhere well to their trend lines. This one has slight overshoots within minute wave a of minor wave 3, but the 1-3 trend line is not breached. Minute wave b is now right on the lower diagonal trend line, and also finding support at the lower of the double aqua blue trend lines. For this main wave count this must be where it ends. This main wave count expects the final bounce to begin from here tomorrow. At 2,178 minute wave c would reach equality in length with minute wave a.
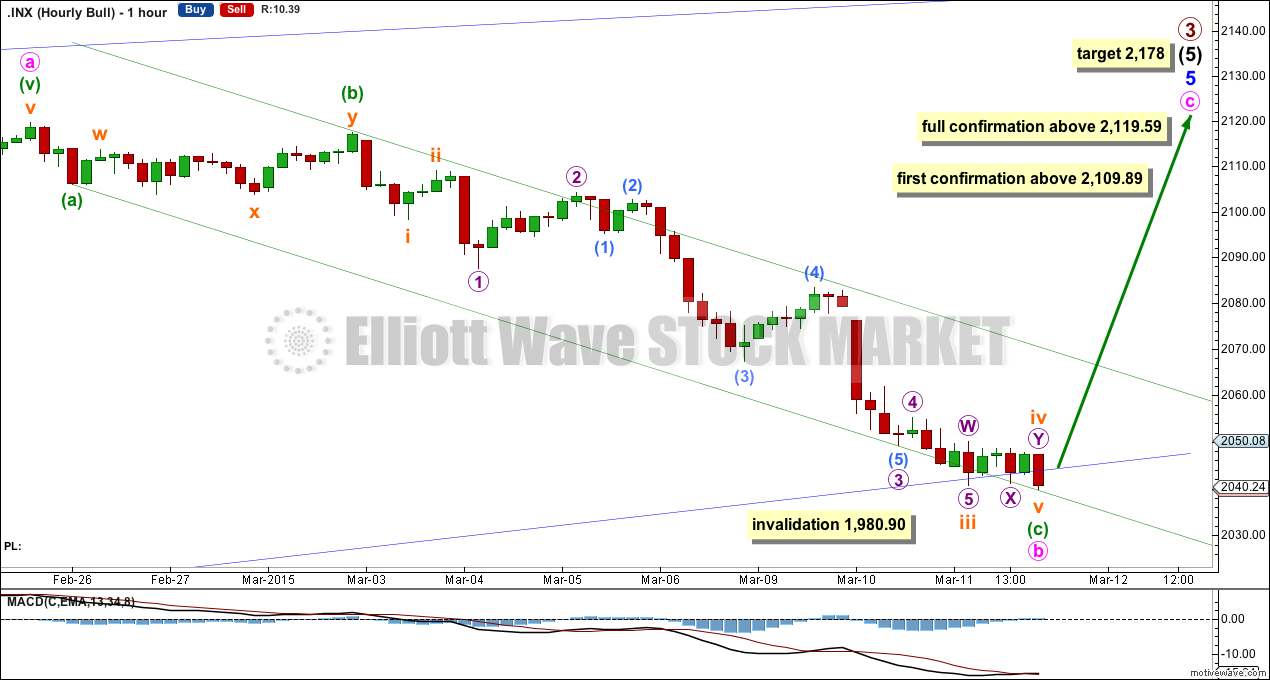
1-2-3 and A-B-C (of a zigzag) have exactly the same subdivisions. This main bull hourly wave count has exactly the same subdivisions for this downwards movement as the alternate hourly bull wave count.
Minute wave b may now be seen as a complete zigzag, and should find very strong support at the lower blue 2-4 trend line of the diagonal. Diagonals almost always adhere strongly to their trend lines. This main wave count requires upwards movement from this point to make new highs.
My concern for this wave count is the length of minuette wave (c) in relation to minuette wave (a) because it is much longer than what should be expected.
The channel drawn about minuette wave (c) is the same as that drawn today for the alternate bull hourly wave count. For the alternate the upper edge of the channel should provide resistance, so a breach of this channel would provide a little confidence for this main wave count.
First price confirmation would come with a new high above 2,109.89.
Full and final confirmation would come with a new high above 2,119.59.
Minute wave b may not move beyond the start of minute wave a below 1,980.90.
Alternate Bullish Wave Count
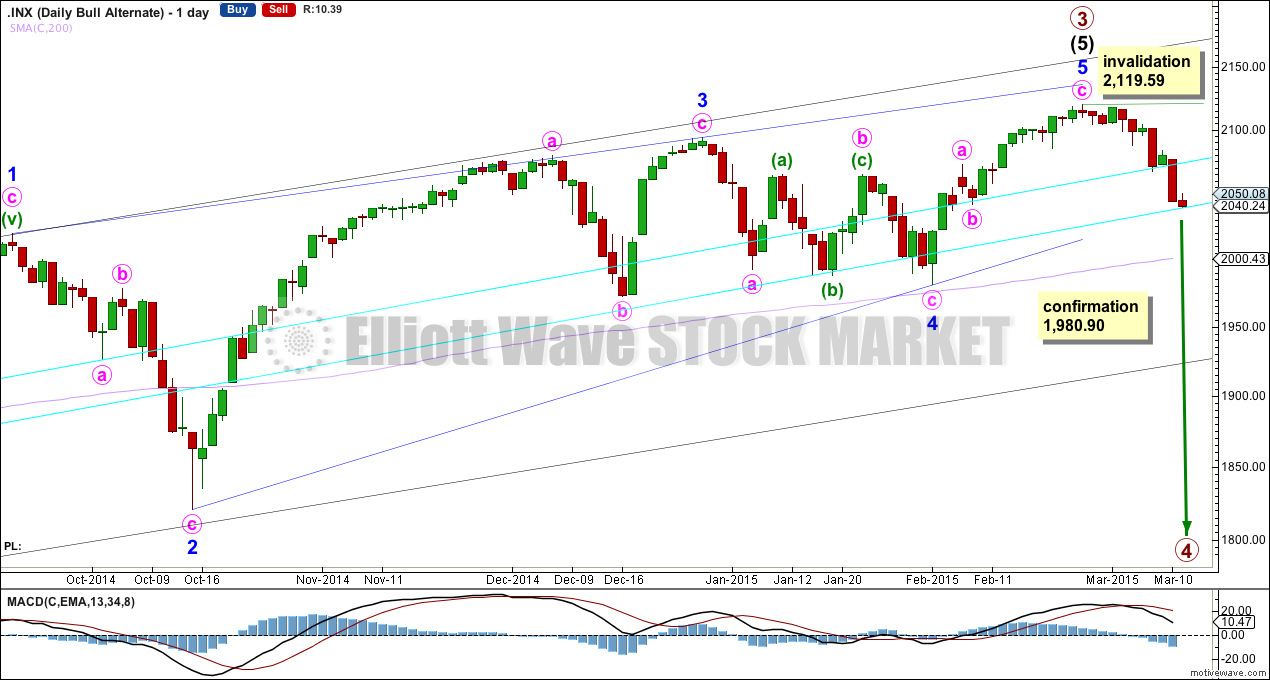
This wave count is identical to the main wave count up to the low labelled minor wave 4. Thereafter, this alternate looks at the possibility that minor wave 5 may be over. Minor wave 5 would have fallen slightly short of the 1-3 trend line. This is unusual but does occasionally happen for fifth waves of contracting diagonals.
A new low below 1,980.90 would invalidate the main wave count. A close below the lower aqua blue trend line of 3% or more of market value would provide added confidence in this wave count. At that stage I would expect that downwards movement may be the early stages of primary wave 4. The bearish wave count below would also be entirely possible, but would require further confirmation.
Primary wave 2 was a 0.41 zigzag correction lasting 62 days in total. I would expect primary wave 4 to be more shallow because it may find support at the lower edge of an Elliott channel (which must be drawn on a weekly chart at this stage). Primary wave 4 should break out of the black channel copied over here from the weekly chart (this is a channel containing primary wave 3). A breach of that channel would provide further confidence that primary wave 3 is over and primary wave 4 is underway.
Primary wave 4 may last about a Fibonacci 55 days if it is a flat correction. If it is a combination or triangle it may be more time consuming, maybe up to a Fibonacci 89 days.
We should always assume the trend remains the same, until proven otherwise. At this early stage we have no confirmation of a big trend change, so this idea must remain an alternate until we do. We should assume the trend remains up.
If there has been a trend change at primary or cycle degree, then a clear five down should develop at the hourly and daily chart levels. So far this is still incomplete, and should have begun with a series of overlapping first and second waves.
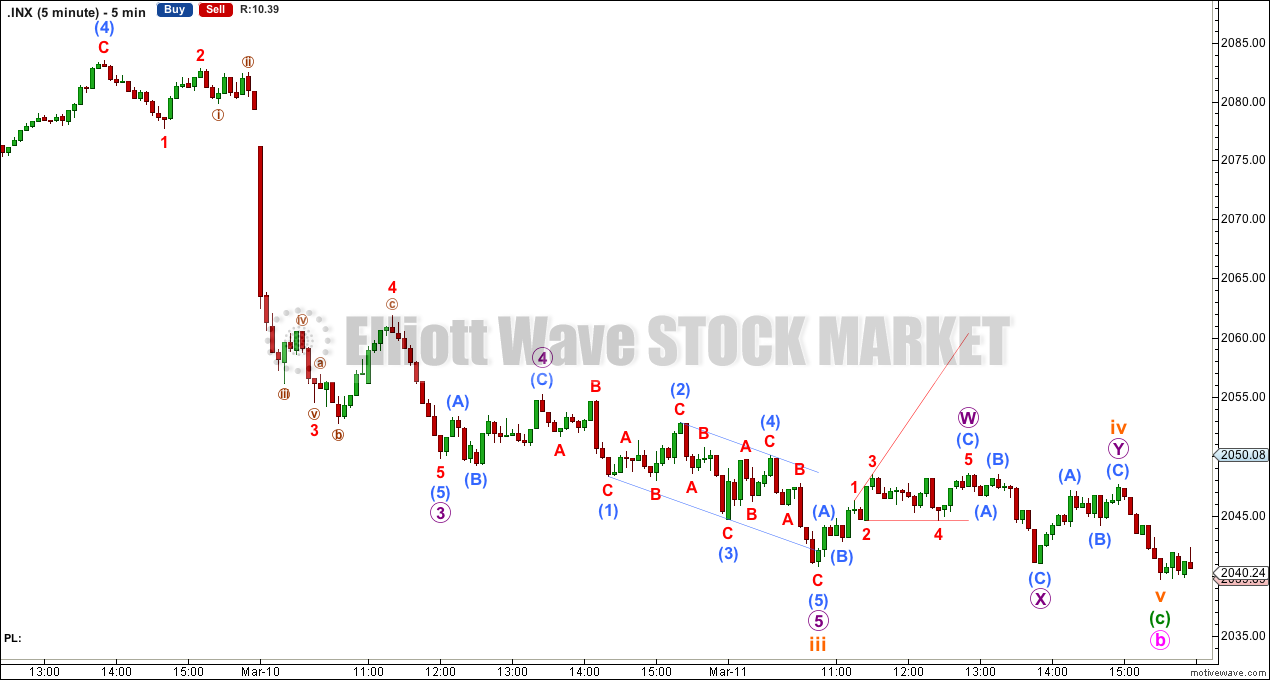
Subminuette wave iii is 1.15 points short of 2.618 the length of subminuette wave i.
Bear Wave Count
The subdivisions within primary waves A-B-C are seen in absolutely exactly the same way as primary waves 1-2-3 for the bull wave count. The alternate bull wave count idea also works perfectly for this bear wave count.
To see the difference at the monthly chart level between the bull and bear ideas look at the last historical analysis here.
At cycle degree wave b is over the maximum common length of 138% the length of cycle wave a, at 167% the length of cycle wave a. At 2,393 cycle wave b would be twice the length of cycle wave a and at that point this bear wave count should be discarded.
While we have no confirmation of this wave count we should assume the trend remains the same, upwards. This wave count requires confirmation before I have confidence in it.
This analysis is published about 05:57 p.m. EST.