
Again, upwards movement was expected, but downwards movement breached the invalidation point (which was very close by) on the hourly Elliott wave count.
Summary: This downwards movement looks like minute wave b within minor wave 5. This changes the target calculation. I still expect to see minor wave 5 overshoot the 1-3 trend line on the daily chart. The first target is at 2,140. If price reaches the first target and the line is not overshot, then the second target is at 2,173. Upwards movement may end in another 14 sessions.
Click charts to enlarge.
Bullish Wave Count
Upwards movement from the low at 666.79 subdivides as an incomplete 5-3-5. For the bull wave count this is seen as primary waves 1-2-3.
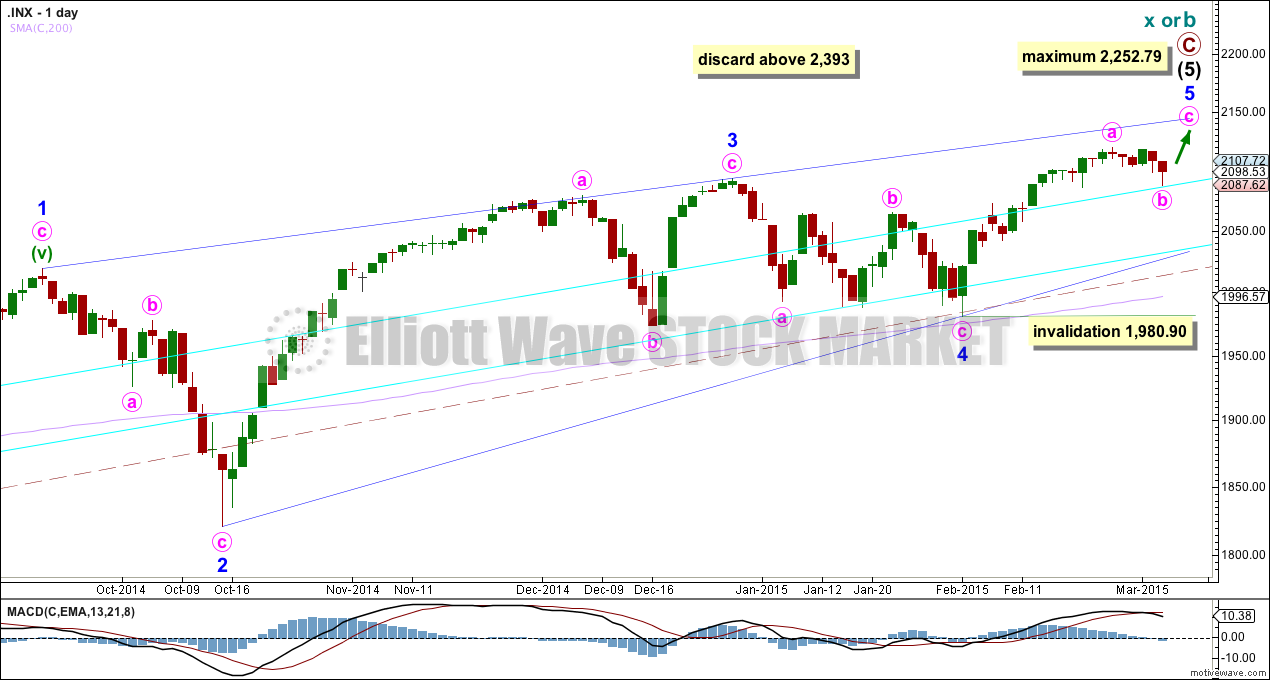
The aqua blue trend lines are traditional technical analysis trend lines. These lines are long held (the lower one has its first anchor in November, 2011), repeatedly tested, and shallow enough to be highly technically significant. When the lower of these double trend lines is breached by a close of 3% or more of market value that should indicate a trend change. It does not indicate what degree the trend change should be though. It looks like the last four corrections may have ended about the lower aqua blue trend line, which gives the wave count a typical look. To see a weekly chart where I have drawn these trend lines go here.
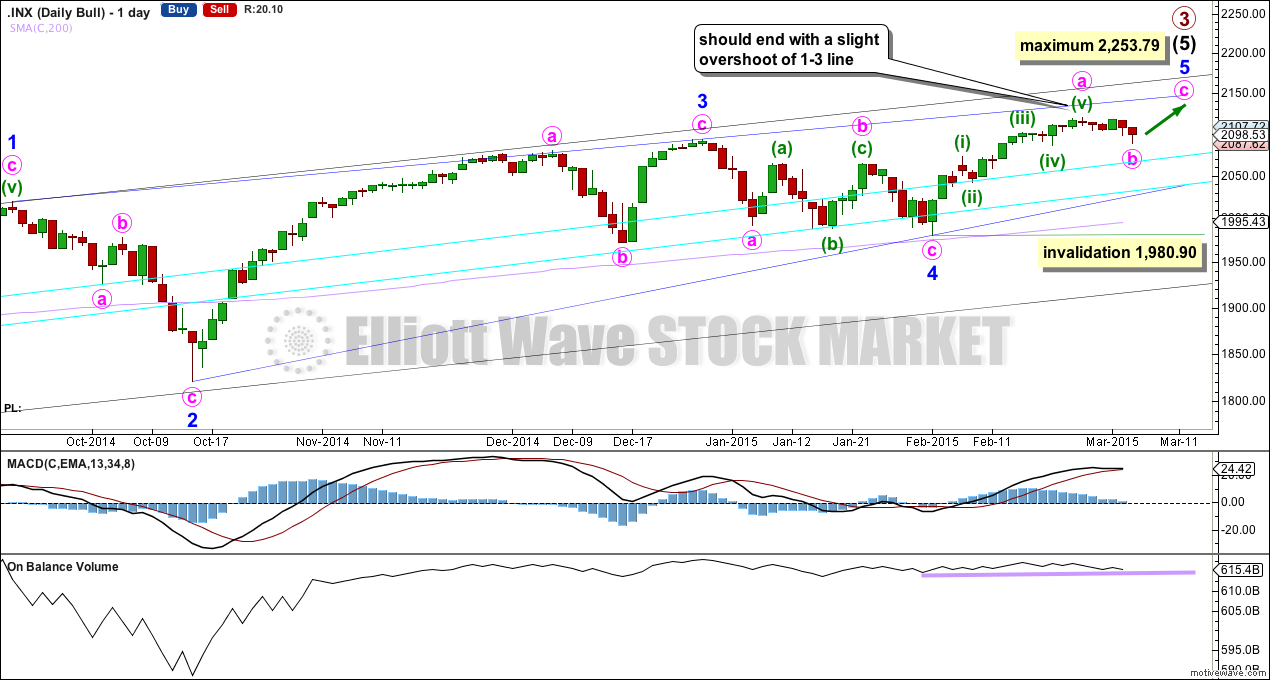
The wave count looks at intermediate wave (5) as an ending contracting diagonal. Ending diagonals require all sub waves to be zigzags. So far this is a perfect fit. Minor wave 3 has stronger momentum than minor wave 5 on the daily chart.
The diagonal is contracting. The only problem with this possibility is that minor waves 2 and 4 are more shallow than second and fourth waves within diagonals normally are. In this case they may have been forced to be more shallow by support offered from the double aqua blue trend lines.
Because the third wave within the contracting diagonal is shorter than the first wave and a third wave may never be the shortest wave, this limits the final fifth wave to no longer than equality with the third wave at 2,253.79.
Within intermediate wave (5) minor wave 1 lasted 238 days (5 days longer than a Fibonacci 233), minor wave 2 lasted 18 days (2 short of a Fibonacci 21), minor wave 3 lasted 51 days (4 short of a Fibonacci 55) and minor wave 4 lasted 23 days (2 longer than a Fibonacci 21). While none of these durations are perfect Fibonacci numbers, they are all reasonably close. So far minor wave 5 has lasted 20 days and the structure is incomplete and does not look like it can end in just one more session to total a Fibonacci 21, so the next likely duration would be another 14 sessions to total a Fibonacci 34, give or take one or two days either side of this expectation.
Within minor wave 5 minute wave b may not move beyond the start of minute wave a below 1,980.90.
Contracting diagonals normally have fifth waves which end with a slight overshoot of the 1-3 trend line. Because this is such a common tendency I will still expect more upwards movement to see this trend line overshot. It is possible that the fifth wave is over already, but this would look less common.
Minute wave b may be finding support at the upper aqua blue trend line. There is slight divergence with On Balance Volume (OBV): a new price low for 4th March has not seen a new low for OBV. OBV may have found support at the trend line shown, which may initiate more upwards movement.
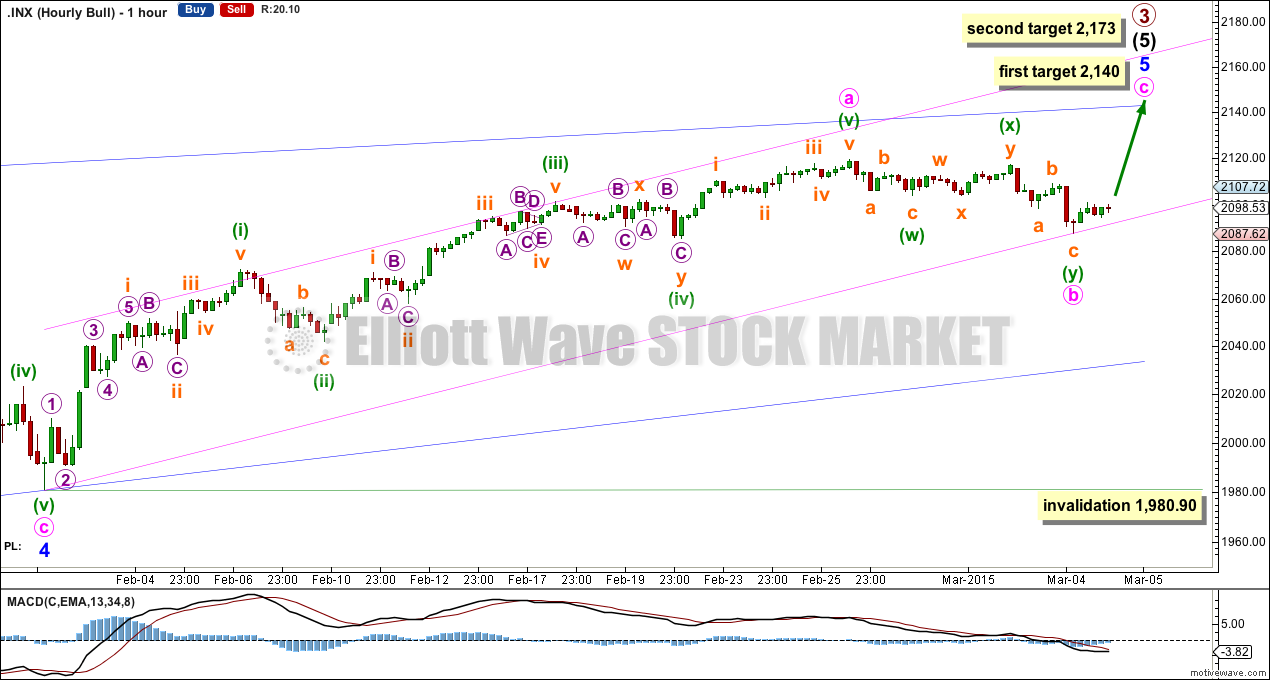
This downwards movement is too big to be a low degree second wave correction. It looks more likely to be minute wave b. This would give minor wave 5 a really strong three wave look at the daily chart level, which would give the wave count entirely the “right look”.
I am adjusting the main wave count to see the last wave up in the same way as the alternate hourly chart.
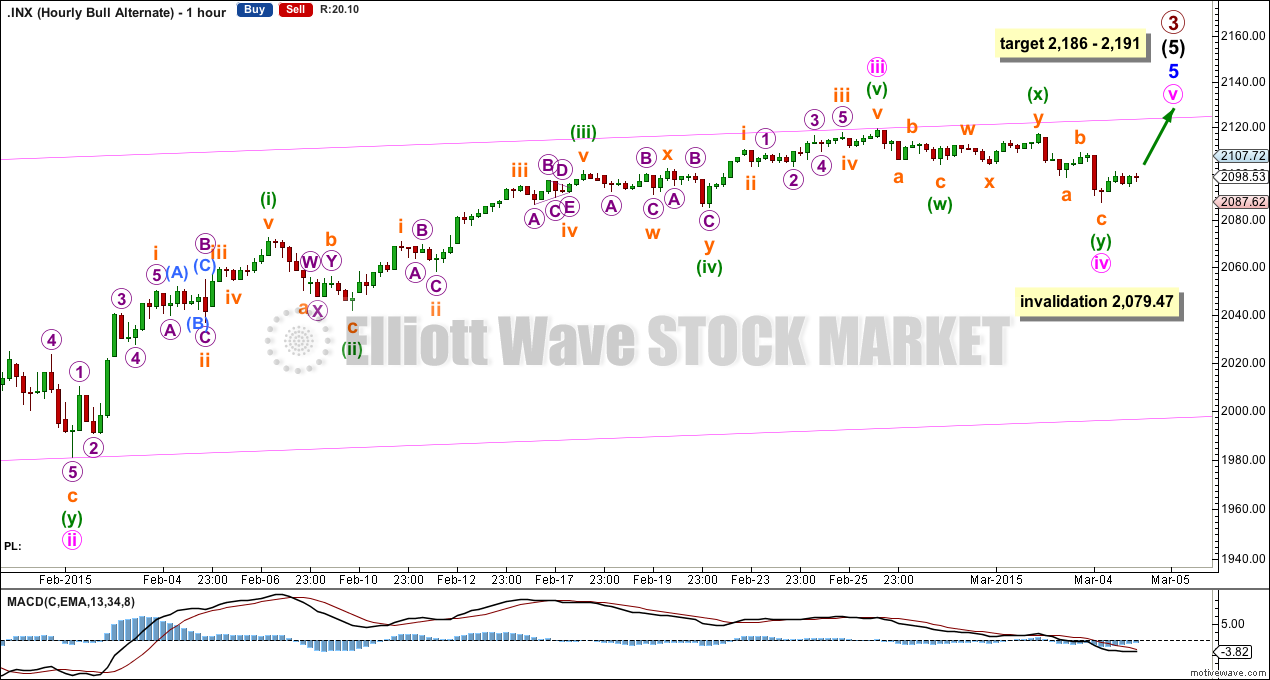
Ratios within minute wave a are: minuette wave (iii) is 2.87 points longer than 0.618 the length of minuette wave (i), and minuette wave (v) 2.57 points short of 0.618 the length of minuette wave (iii).
Minuette wave (iii) has weaker momentum than minuette wave (i), but it is not the weakest so this is acceptable. Minuette wave (v) has weaker momentum than minuette wave (iii).
Minute wave b may be a complete double zigzag, and within it minuette wave (x) is itself a double. This is okay because X waves may be multiples, whereas W, Y and Z waves may not be multiples though because the maximum number of corrective structures within a multiple is three.
At 2,140 minute wave c would reach 0.382 the length of minute wave a. This target may not be high enough for minor wave 5 to overshoot the channel now, particularly if it is slow moving. The second target may now be more likely. At 2,173 minute wave c would reach 0.618 the length of minute wave a.
If minute wave b moves lower then the two targets must also move correspondingly lower. Minute wave b is likely to be complete, but it may continue sideways as a flat correction. The degree of labelling within it may be moved down one degree so that only minuette wave (a) within it is complete as a double zigzag. That would indicate a flat correction unfolding and would require upwards movement for a B wave at this stage so this idea does not diverge in the expectation of upwards movement at this time.
Minute wave b may not move beyond the start of minute wave a below 1,980.90.
Alternate Bull Wave Count
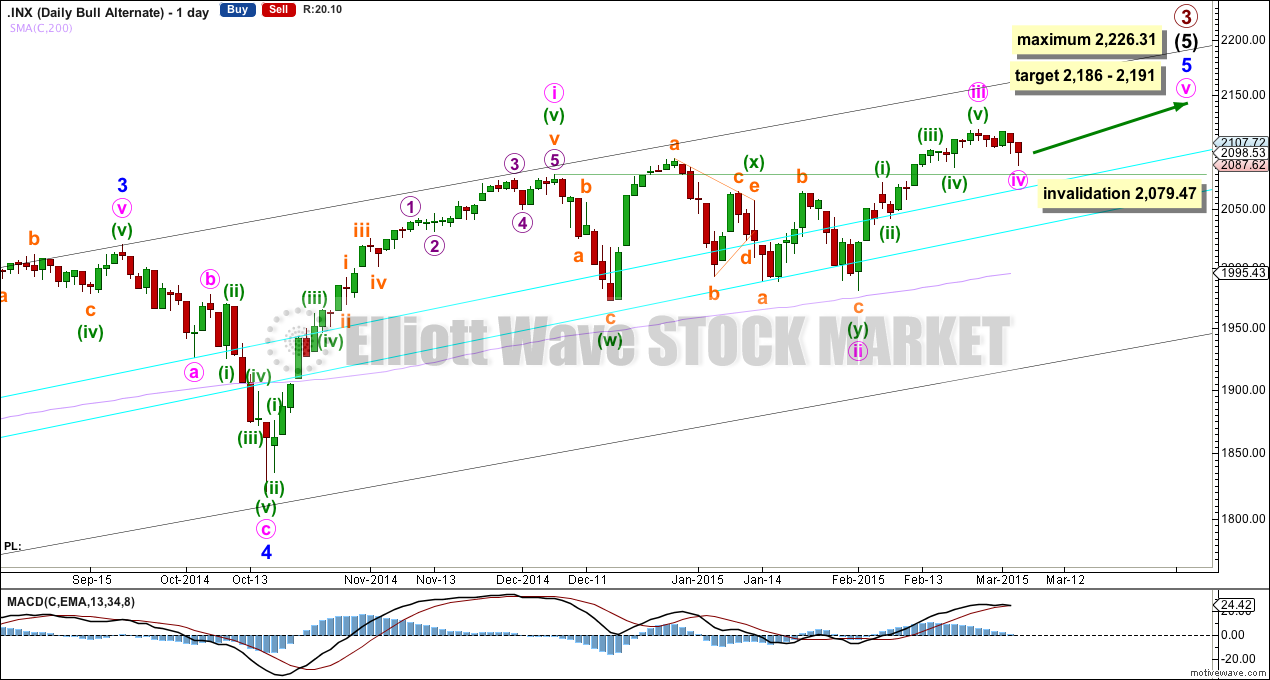
This wave count is an alternate because it does not fit well with momentum at the daily chart level. It is now the same as the main wave count at the hourly chart level.
Within intermediate wave (5) minor wave 3 has weaker momentum than minor waves 1 and 5. This is opposite to how it should behave. However, at the weekly chart level minor wave 3 has stronger momentum than minor wave 5 so this could still fit.
At 2,191 primary wave 3 would reach 1.618 the length of primary wave 1. At 2,186 minute wave v would reach 0.382 the length of minute wave i. This gives a 5 point target zone for primary wave 3 to end.
Because minute wave iii is shorter than minute wave i this limits minute wave v to no longer than equality with minute wave iii, because a third wave may never be the shortest. This limit is at 2,226.31.
Although minute wave iv is much more brief than minute wave ii (the S&P does not always exhibit good proportions) the structure is complete and there is perfect alternation.
Minute wave iv only subdivides as a double zigzag. It is very shallow at only 0.23 of minute wave iii. This provides perfect alternation with the less shallow 0.38 double combination of minute wave ii.
For this alternate idea minute wave v must begin from here. There is almost no room left for downwards movement of minute wave iv. Double zigzags are reasonably common, but triples are very rare. At this stage it could continue further as a triple, but the probability is very low.
Minute wave iv may not move into minute wave i price territory below 2,079.47.
Bear Wave Count
The subdivisions within primary waves A-B-C are seen in absolutely exactly the same way as primary waves 1-2-3 for the bull wave count. The alternate bull wave count idea also works perfectly for this bear wave count.
To see the difference at the monthly chart level between the bull and bear ideas look at the last historical analysis here.
At cycle degree wave b is over the maximum common length of 138% the length of cycle wave a, at 167% the length of cycle wave a. At 2,393 cycle wave b would be twice the length of cycle wave a and at that point this bear wave count should be discarded.
While we have no confirmation of this wave count we should assume the trend remains the same, upwards. This wave count requires confirmation before I have confidence in it.
This analysis is published about 07:30 p.m. EST.