
Upwards movement was expected again for both Elliott wave counts.
Note: My internet connection today will not allow me to upload video. I have said everything I need to say in the article below.
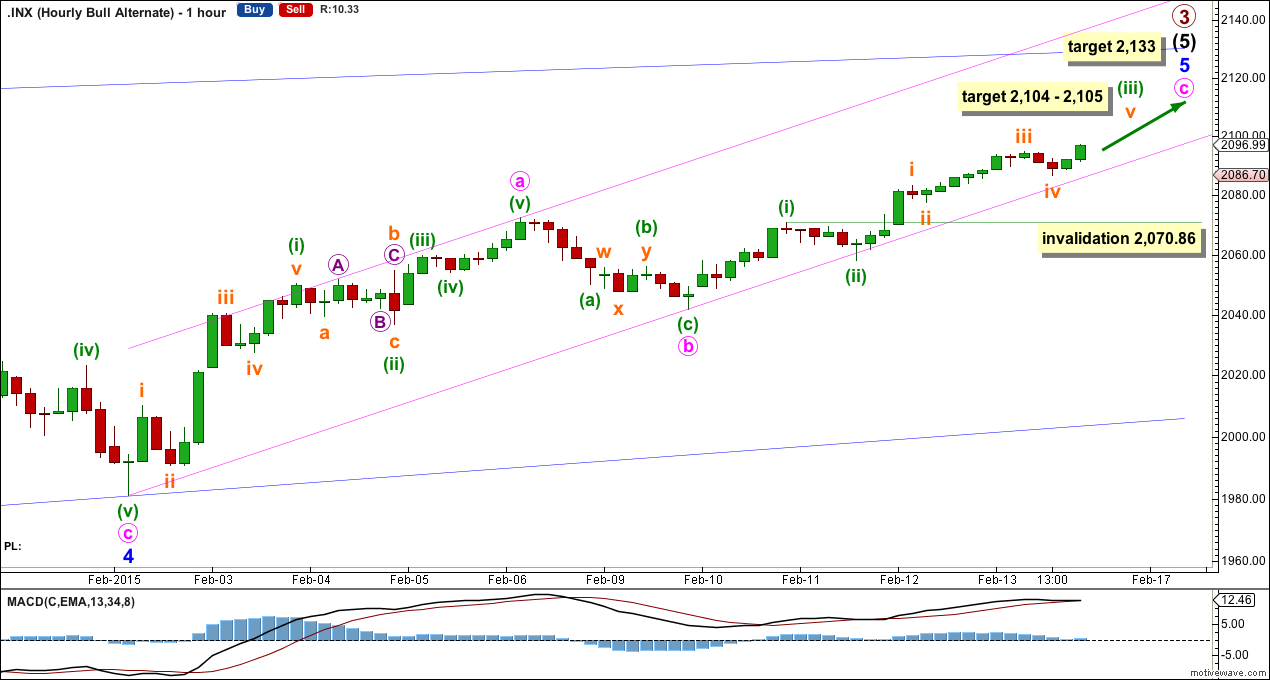
Summary: The upwards trend should continue next trading day. The short term target is either 2,104 – 2,105 or 2,118.
Click charts to enlarge.
Bullish Wave Count
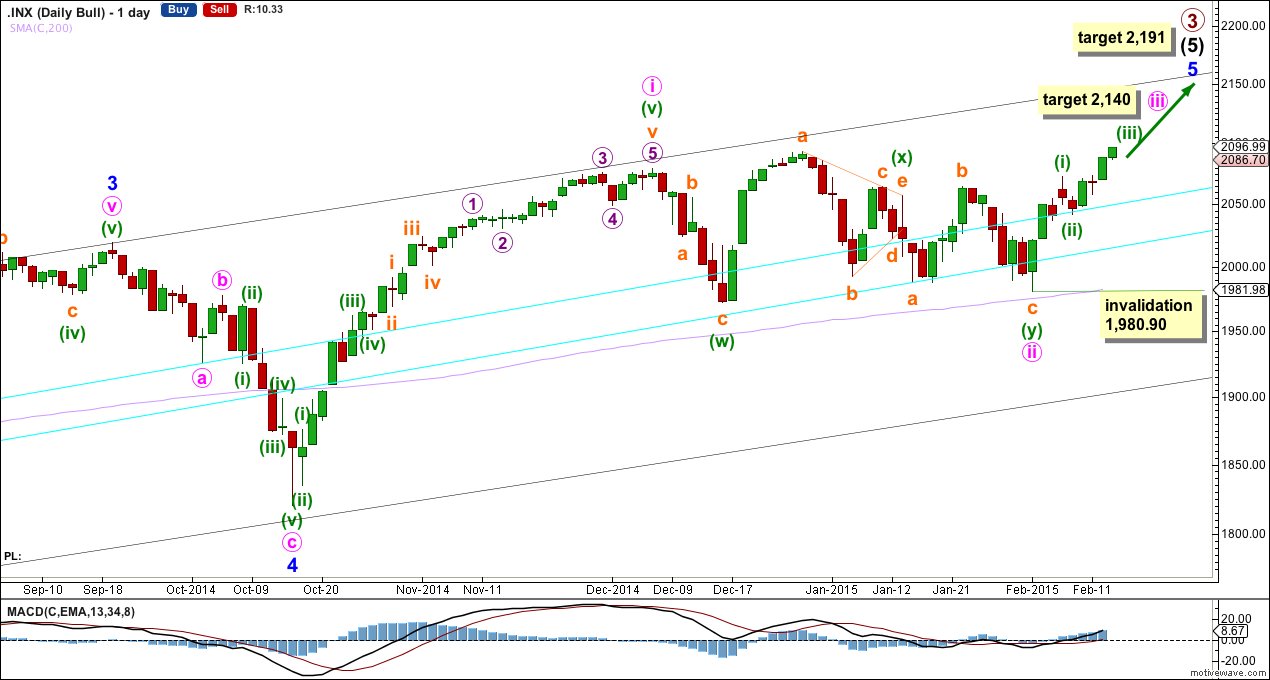
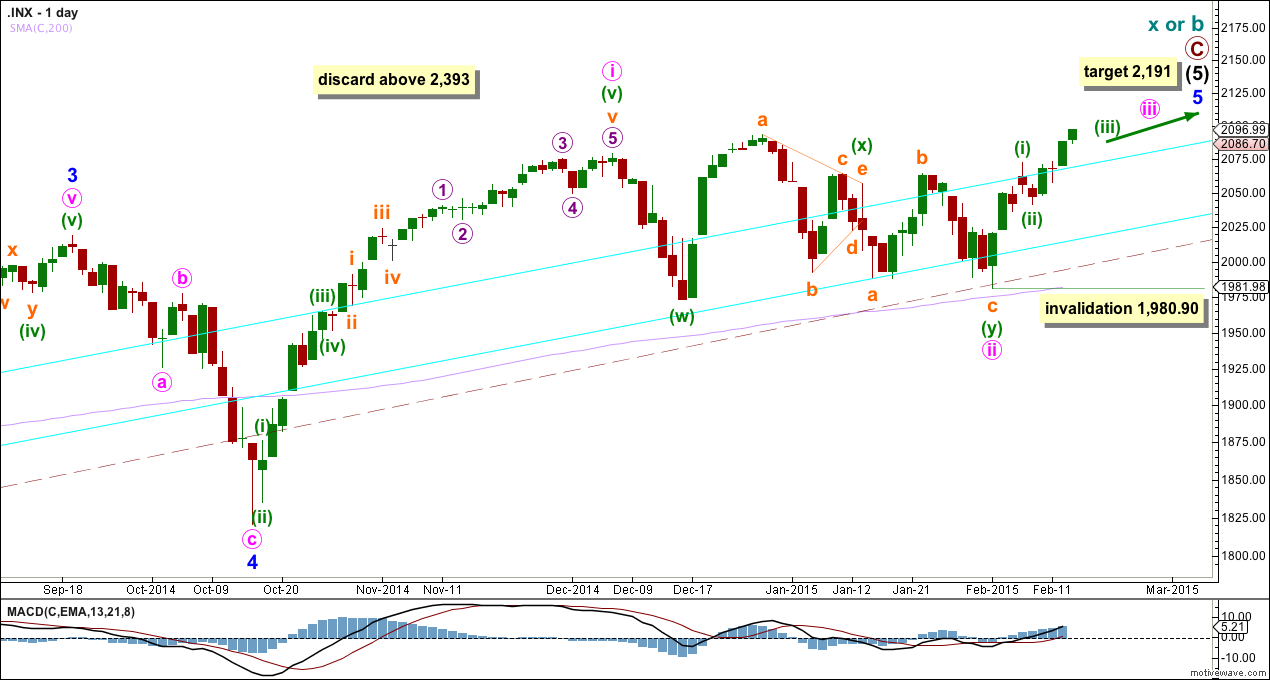
Upwards movement from the low at 666.79 subdivides as an incomplete 5-3-5. For the bull wave count this is seen as primary waves 1-2-3.
The aqua blue trend lines are traditional technical analysis trend lines. These lines are long held (the lower one has its first anchor in November, 2011), repeatedly tested, and shallow enough to be highly technically significant. When the lower of these double trend lines is breached by a close of 3% or more of market value that should indicate a trend change. It does not indicate what degree the trend change should be though. It looks like the last four corrections may have ended about the lower aqua blue trend line, which gives the wave count a typical look. To see a weekly chart where I have drawn these trend lines go here.
I have pulled the upper trend line down a little to touch the low of minute wave a within minor wave 4. This may be a better position for recent movement.
At 2,191 primary wave 3 would reach 1.618 the length of primary wave 1. This would expect that within minor wave 5 minute wave iii will be shorter than minute wave i, and minute wave v will be shorter still, which would be a repeat of the pattern seen within minor wave 1. Or the target is wrong.
At 2,140 minute wave iii would reach 0.618 the length of minute wave i.
Looking at momentum within intermediate wave (5) it is concerning that minor wave 3 exhibits weakest momentum at the daily chart level, although at the weekly chart level it does have stronger momentum than minor wave 5. It is for this reason I am seriously considering the alternate bullish wave count.
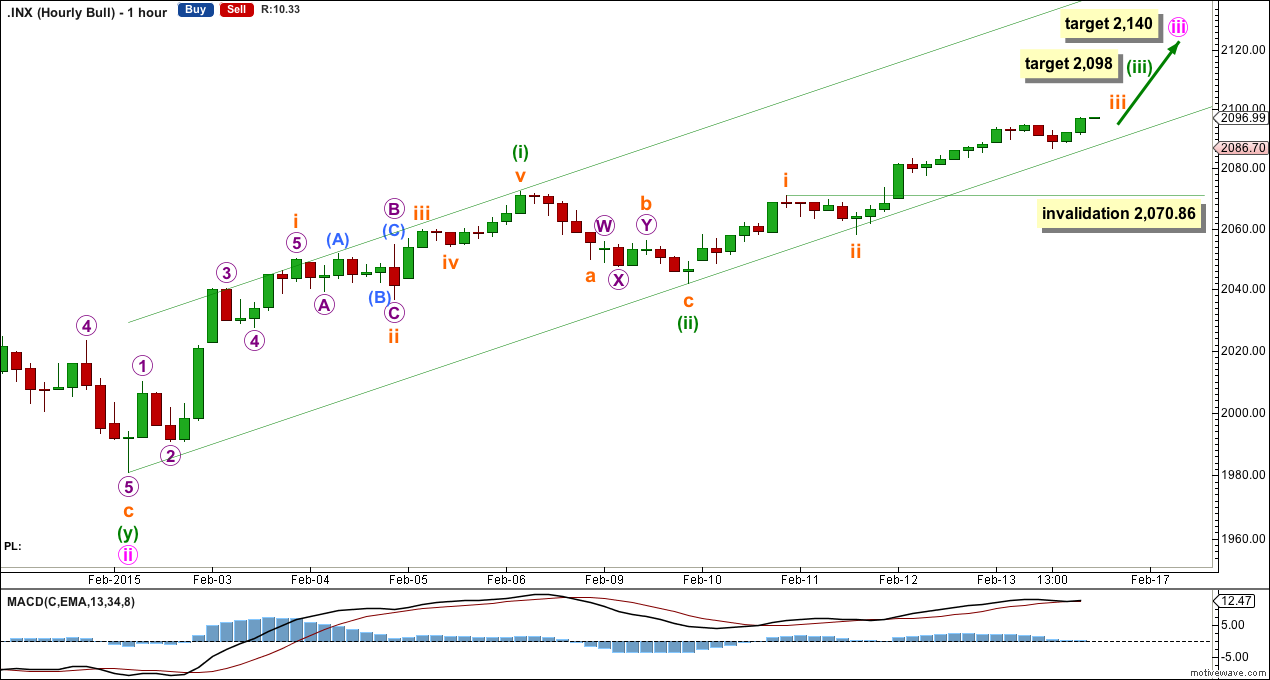
If minuette wave (iii) has begun then this main bullish wave count would expect it to show an increase in momentum beyond that seen for minuette wave (i), and to break above the upper edge of the base channel drawn here about minuette waves (i) and (ii). The fact that it has still done neither of these things so far indicates that the alternate bullish wave count may be correct.
At 2,098 minuette wave (iii) would reach 0.618 the length of minuette wave (i). I am expecting to see a lower fractal here of the same pattern expected for one degree higher, minute degree. This target is almost reached, and the structure is incomplete. Minuette wave (iii) may not exhibit a ratio to minuette wave (i), the target may be wrong. Or we may see a rapid end to minuette wave (iii) with a correction for subminuette wave iv to come before it, and a very short subminuette wave v.
Within minuette wave (iii) subminuette wave iii is close to an end. The subsequent correction for subminuette wave iv may not move back into subminuette wave i price territory below 2,070.86.
Alternate Bull Wave Count
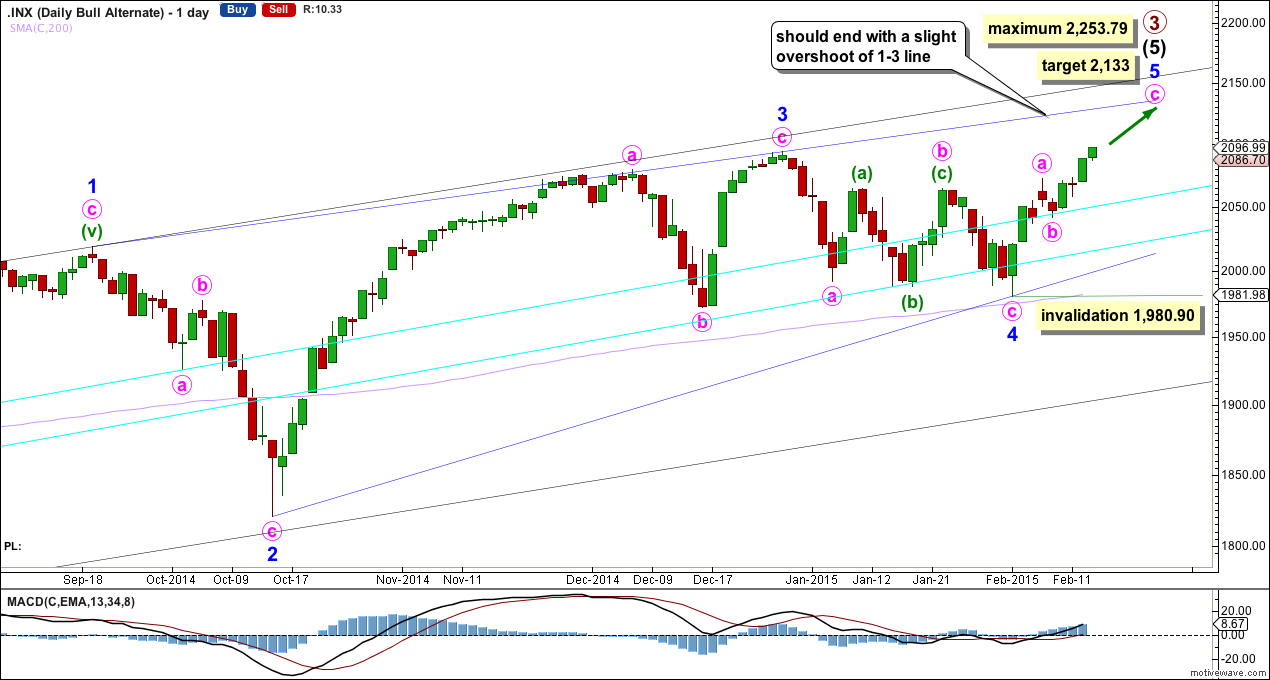
The alternate bullish wave count looks at the other less common structural possibility for intermediate wave (5) as an ending diagonal.
Ending diagonals require all sub waves to be zigzags. So far this is a perfect fit.
The diagonal is contracting. The only problem with this possibility is that minor waves 2 and 4 are more shallow than second and fourth waves within diagonals. In this case they may have been forced to be more shallow by support offered from the double aqua blue trend lines.
At the daily chart level this wave count has a better fit with momentum. At the daily chart level the strongest upwards momentum within intermediate wave (5) is within the high labeled minute wave a within minor wave 3. This wave count sees strongest momentum as within the third wave.
Within minor wave 5 minute wave b may not move beyond the start of minute wave a below 1,980.90.
At 2,133 minute wave c would reach equality in length with minute wave a.
Contracting diagonals normally have fifth waves which end with a slight overshoot of the 1-3 trend line.
Minor wave 5 must subdivide as a zigzag. So far minute waves a and b are complete. Minute wave c must subdivide as a five wave structure and looks like a simple impulse so far.
Minute wave c does not have to show an increase in momentum beyond that seen for minute wave a, and it does not have to break above the channel. Here the channel is correctly termed a corrective channel about this upwards zigzag. The lower trend line should provide support for corrections along the way up.
For this alternate I would expect minute wave c to show weaker momentum than minute wave a, as towards the end of a movement for intermediate wave (5) I would expect to see divergence develop between MACD and price at all time frames.
Within minute wave c at 2,105 minuette wave (iii) would reach 1.618 the length of minuette wave (i).
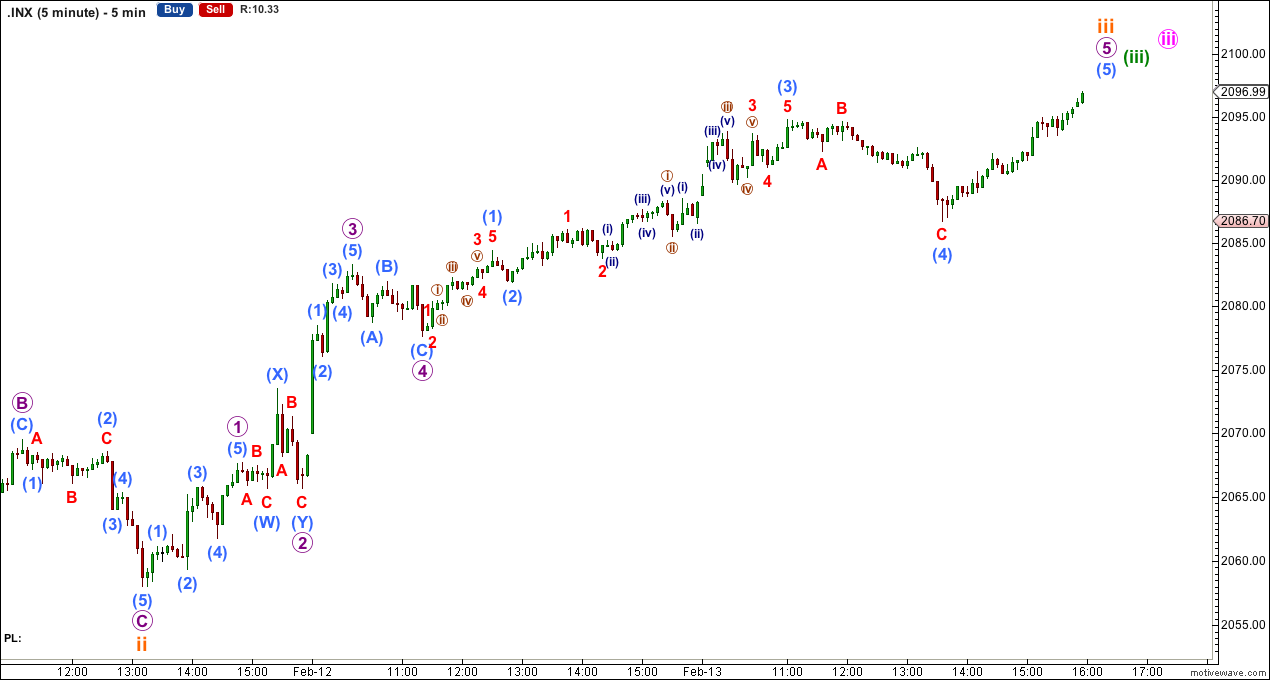
Subminuette wave iii is 1.51 points longer than 0.618 the length of subminuette wave i. At 2,104 subminuette wave v would reach equality in length with subminuette wave iii.
This gives a 1 point target zone for upwards movement to be interrupted by a small correction for minuette wave (iv). Because minuette wave (ii) shows up on the daily chart as a small red doji I would expect it is fairly likely that minuette wave iv may also show up on the daily chart as one to three red candlesticks or doji.
Minuette wave (iv) may not move into minuette wave (i) price territory below 2,070.86.
Bear Wave Count
The subdivisions within primary waves A-B-C are seen in absolutely exactly the same way as primary waves 1-2-3 for the bull wave count. The alternate bull wave count idea also works perfectly for this bear wave count.
To see the difference at the monthly chart level between the bull and bear ideas look at the last historical analysis here.
At cycle degree wave b is over the maximum common length of 138% the length of cycle wave a, at 165% the length of cycle wave a. At 2,393 cycle wave b would be twice the length of cycle wave a and at that point this bear wave count should be discarded.
While we have no confirmation of this wave count we should assume the trend remains the same, upwards. This wave count requires confirmation before I have confidence in it.
This analysis is published about 12:11 a.m. EST.