
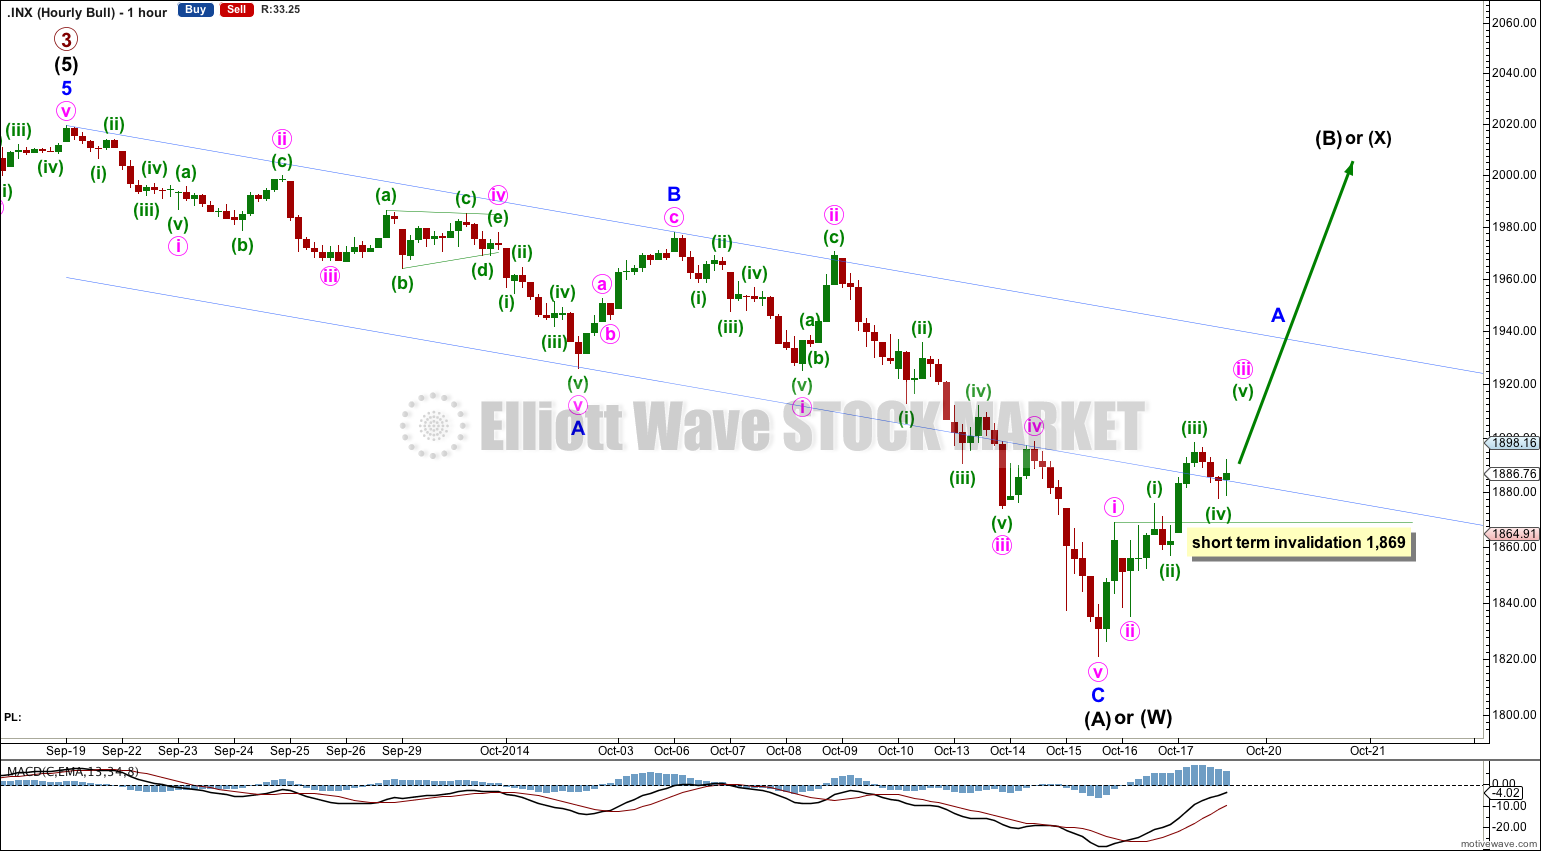
A little upwards movement to 1,880 was expected. Price moved a lot higher than this though, exceeding the target by 18.16 points.
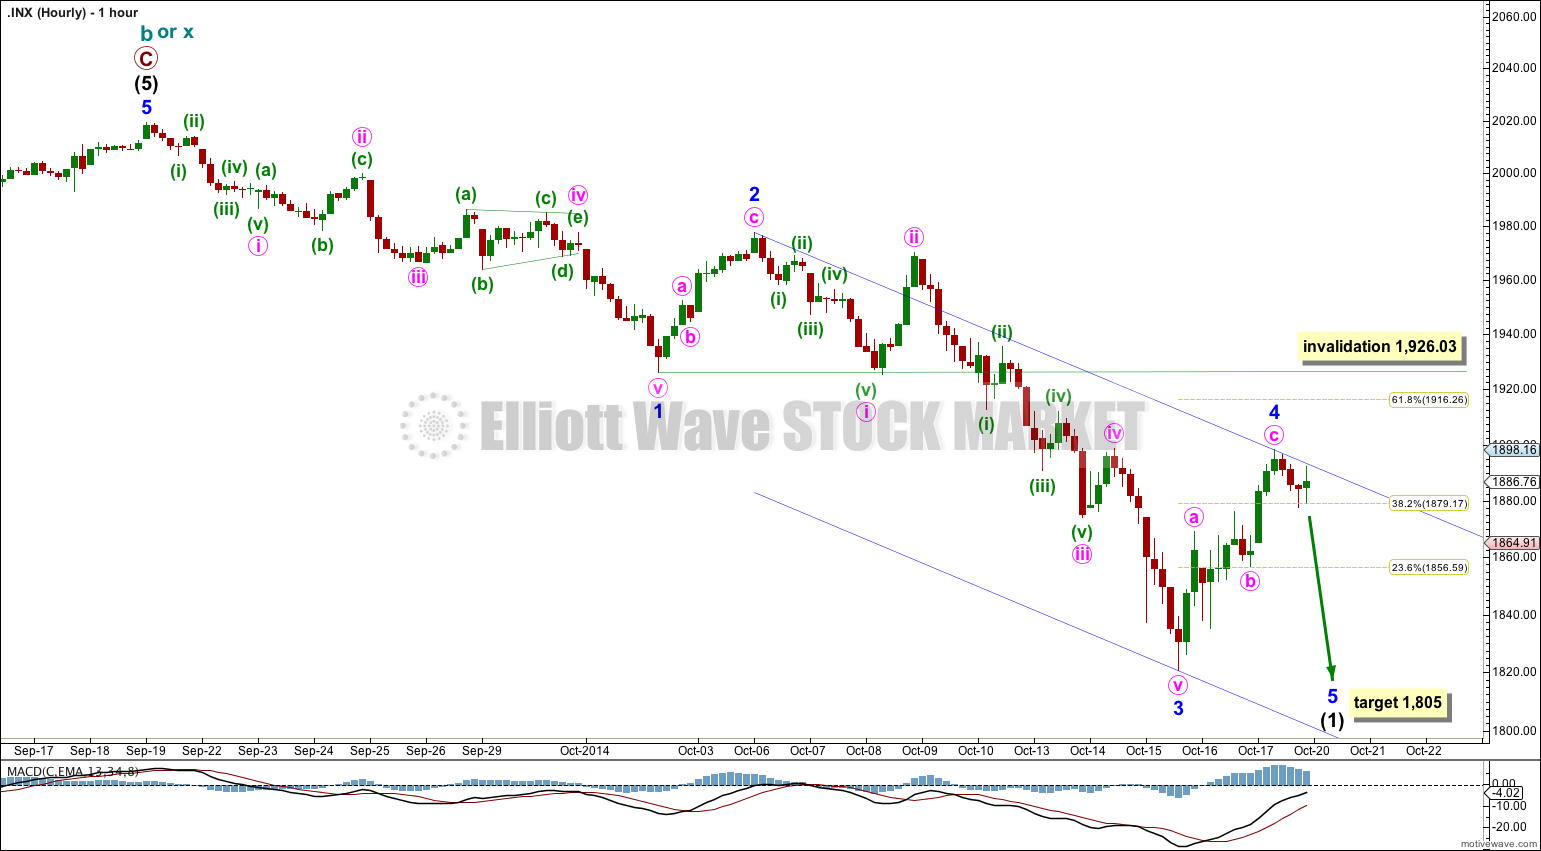
Summary: I expect downwards movement and a red candlestick for Monday’s session to a target at 1,805. If upwards movement breaches 1,926.03 the bullish wave count would increase in probability and the bearish wave count would decrease in probability.
Click on charts to enlarge.
Bearish Wave Count
All monthly, weekly and daily charts are on a semi-log scale.
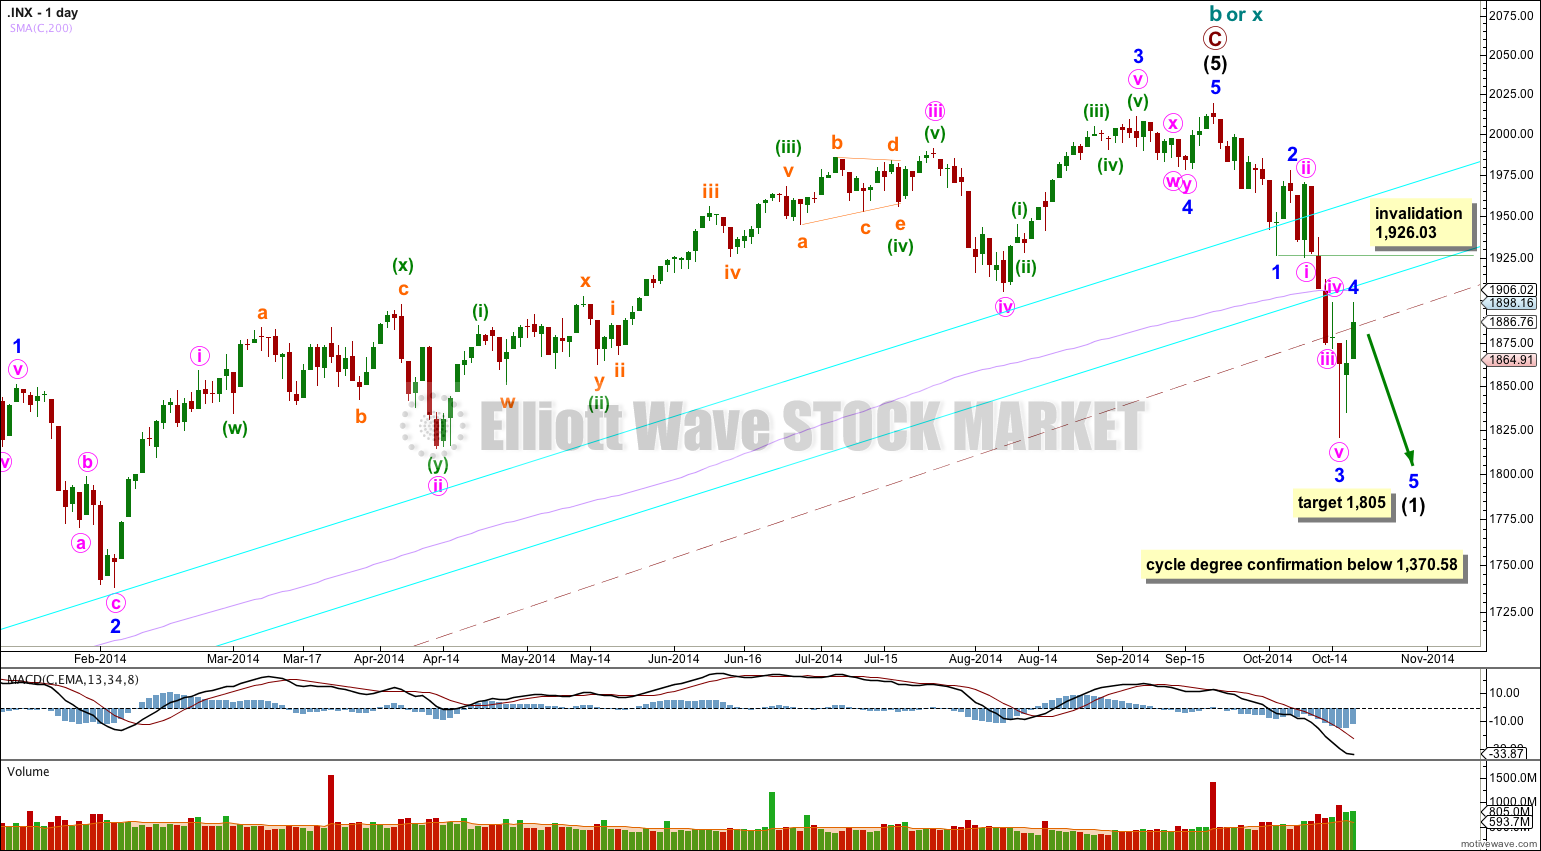
For the first time in three years the lower edge of the maroon – – – channel about cycle wave b (or x) was breached. This is significant.
The bear wave count sees a huge super cycle wave (II) incomplete as either an expanded flat correction, a combination, or a double flat.
The aqua blue trend lines are critical. Draw the first trend line from the low of 1,158.66 on 25th November, 2011, to the next swing low at 1,266.74 on 4th June, 2012. Create a parallel copy and place it on the low at 1,560.33 on 24th June, 2013. This lower trend line is now breached by about 4% of market value. As this is more than 3% it may now be used to indicate a major trend change. The lower aqua blue trend line may show where upwards movement may find resistance.
There are a couple of things about this wave count of which I am confident. I see intermediate wave (3) within primary wave C as over at 1,729.86 (19th September, 2013). It has the strongest upwards momentum and is just 0.76 longer than 2.618 the length of intermediate wave (1). At 455 days duration this is a remarkably close Fibonacci ratio. The subdivisions within it are perfect.
The large maroon – – – channel is copied over from the weekly chart. There is now a full daily candlestick below this channel and not touching the trend line. This is an indication of a trend change: cycle wave b (or x) zigzag should now be over and cycle wave c (or y) should be underway.
For the last 18 days as volume has increased it is down days which show higher volume. This may is some indication that the larger trend is downwards.
Minor wave 4 may not move into minor wave 1 price territory above 1,926.03.
To have full confidence in this bearish wave count, and to discard the bullish wave count, I want to see three things happen:
1. A clear five down on the daily chart, with completion of intermediate wave (1).
2. Confirmation from NASDAQ with a new swing low for that market below 3,414,11.
3. A new low below 1,370.58.
When we have those three things I will have full confidence in this wave count.
Minor wave 4 is now most likely to be over. There is little alternation between minor waves 2 and 4, but there is some. Minor wave 2 is a deep 56% zigzag with a short minute wave a and a longer minute wave c. Minor wave 4 is a more shallow 49% zigzag with a longer minute wave a than its minute wave c.
At 1,805 minor wave 5 would reach equality in length with minor wave 1. This would complete a five wave impulse downwards and would provide a little more confidence in this bearish wave count. When intermediate wave (1) is complete then the invalidation point would move up to its start and I will expect an upwards correction for intermediate wave (2) to last about three or four weeks.
If it continues further on Monday then minor wave 4 may not move into minor wave 1 price territory above 1,926.03.
Bullish Wave Count
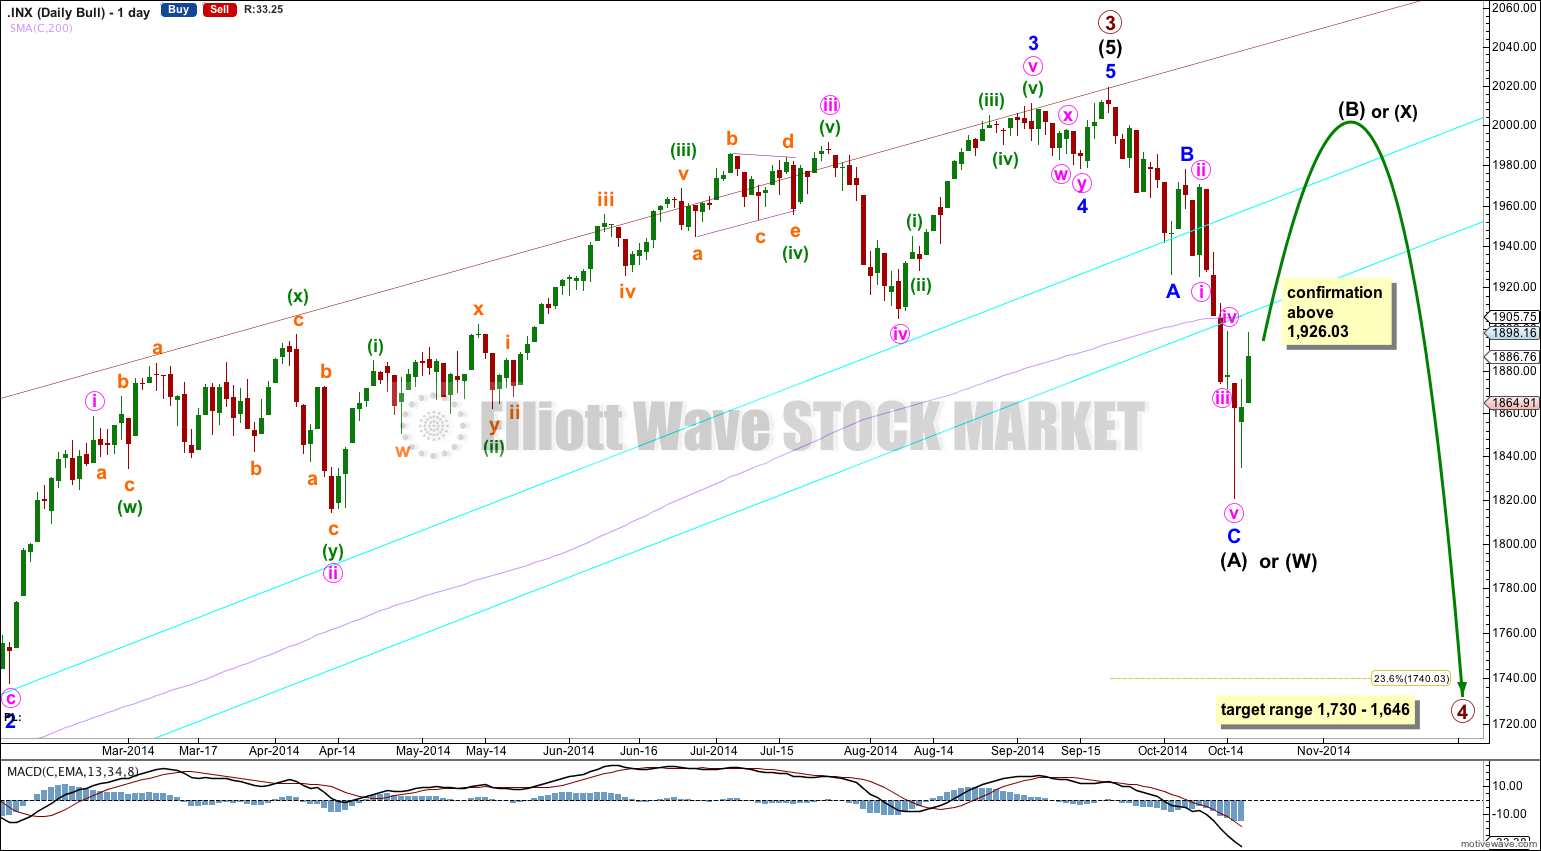
The bull wave count expects to see a primary degree fourth wave correction.
Primary wave 2 was a 41% zigzag correction.
I am expecting primary wave 4 to show alternation with the zigzag of primary wave 2 and so it is most likely to be a flat, triangle or combination. This means that the first wave down is most likely to be a three.
Primary wave 2 lasted a Fibonacci 13 weeks. I will initially expect primary wave 4 to most likely last about the same duration, but it does not have to. If it is a triangle or combination then it may be longer than 13 weeks in duration. Zigzags tend to be more brief structures than time consuming triangles and combinations.
Primary wave 4 is likely to end within the price territory of the fourth wave of one lesser degree, between 1,730 – 1,646.
Alternatively, the degree of labeling within primary wave 4 may be moved down one degree, and minor A may be an incomplete five wave structure.
I would not move the degree of labelling within primary wave 4 all up one degree to see it as a now completed zigzag for two reasons: it would be a remarkably brief primary degree wave, lasting only 4 weeks where its counterpart primary wave 2 lasted 13 weeks, and it would show no alternation in structure with primary wave 2 and they would both be single zigzags. This idea has too low a probability to seriously consider.
At this stage if we see movement above 1,926.03 it would be confirmed that intermediate wave (A) is a completed three wave zigzag.
If we see a new low below 1,820.66 shortly then I will move the degree of labeling within primary wave 4 all down one degree and expect minor wave A is a completed five wave structure. That idea would see no divergence in the short term expectation with the bearish wave count.
If primary wave 4 is an expanded flat, running triangle or combination then it may include a new price extreme beyond its start above 2,019.26. If we do see a new all time high the bearish wave count as it currently is would be invalidated and a bullish wave count would be my main wave count.
Primary wave 4 may not move into primary wave 1 price territory below 1,370.58.
At this time with this reworked bullish wave count, despite its problems, I have much more confidence in it. While price remains above 1,370.58 both bull and bear wave counts will be equally valid, both have problems and both have points which favour them. They expect quite different structures to unfold downwards though: the bear wave count expects a big five down should unfold, and the bull wave count expects a fourth wave correction. Over the next few weeks it should be clearer which of these two possibilities is unfolding. Careful attention to structure should illuminate which scenario is correct.
This analysis is published about 11:44 p.m. EST.