
A red candlestick was expected for Wednesday’s session. The targets were too high and the bear target was exceeded by 25.34 points.
I am swapping over my bull and bear wave counts today, a week early, for several reasons. This analysis will outline those more traditional technical analysis reasons.
Summary: I expect upwards movement tomorrow for a fourth wave correction to end about 1,879.17. This should be followed by more downwards movement to new lows below 1,820.66.
Click on charts to enlarge.
Bearish Wave Count
All monthly, weekly and daily charts are on a semi-log scale.
For the first time in three years the lower edge of the maroon – – – channel about cycle wave b (or x) was breached. This is significant.
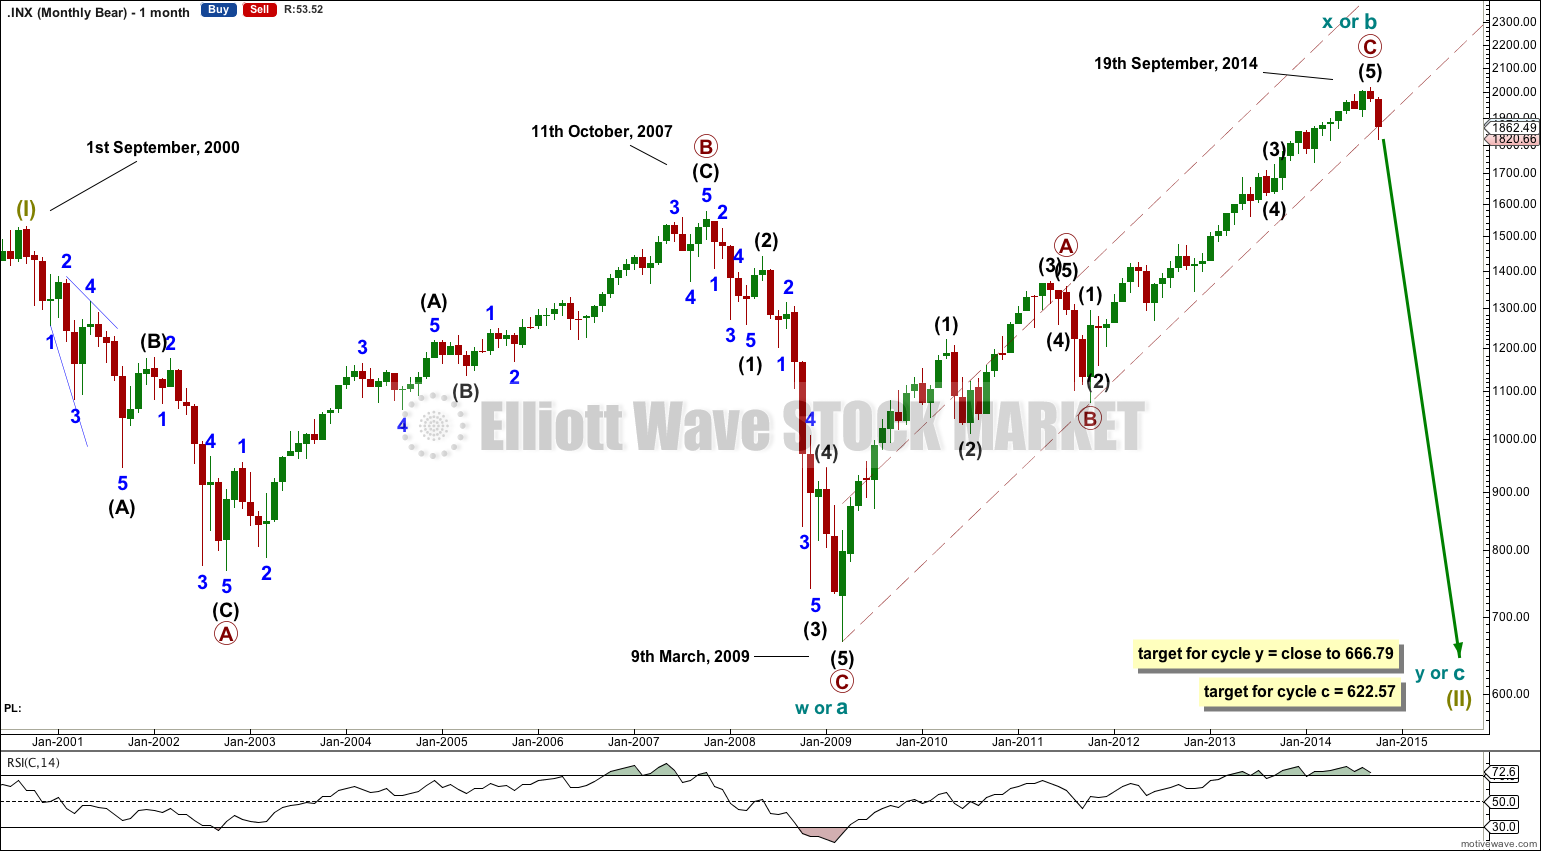
The bear wave count sees a huge super cycle wave (II) incomplete as either an expanded flat correction, a combination, or a double flat.
There is double divergence between RSI and price at the end of this upwards wave. Also, when we see the first correction (a second wave) along the way down then we may see a failure swing for RSI: it may try again to break above 70 but fall short or just break the 70 level and then fall, which would repeat a pattern seen for the last two major market turns in 2000 (September) and 2007 (October).
If super cycle wave (II) is an expanded flat then at 622.57 cycle wave c would reach 1.618 the length of cycle wave a. However, for an expanded flat this target may be too high. The target for cycle wave c would be better calculated at primary wave degree, because a target at cycle degree using the next Fibonacci ratio in the sequence of 2.618 gives a negative result. I will recalculate this target when primary waves 1 through to 4 are complete and at that stage it would probably move substantially lower. C waves of expanded flats normally move substantially below the end of their A waves, and the higher B goes the lower C falls.
If super cycle wave (II) is a double flat then cycle wave y should look like a photocopy of cycle wave a, and would include two smaller market crashes within it: one for primary wave A and the next for primary wave C.
If super cycle wave (II) is a double combination then cycle wave y may be either a zigzag or a triangle.
The purpose of double combinations is to take up time and move price sideways. If super cycle wave (II) is a combination then the second structure in the double should end about the same level as the first at 666.79, and it should last about the same duration as cycle wave w at 8.5 years in total.
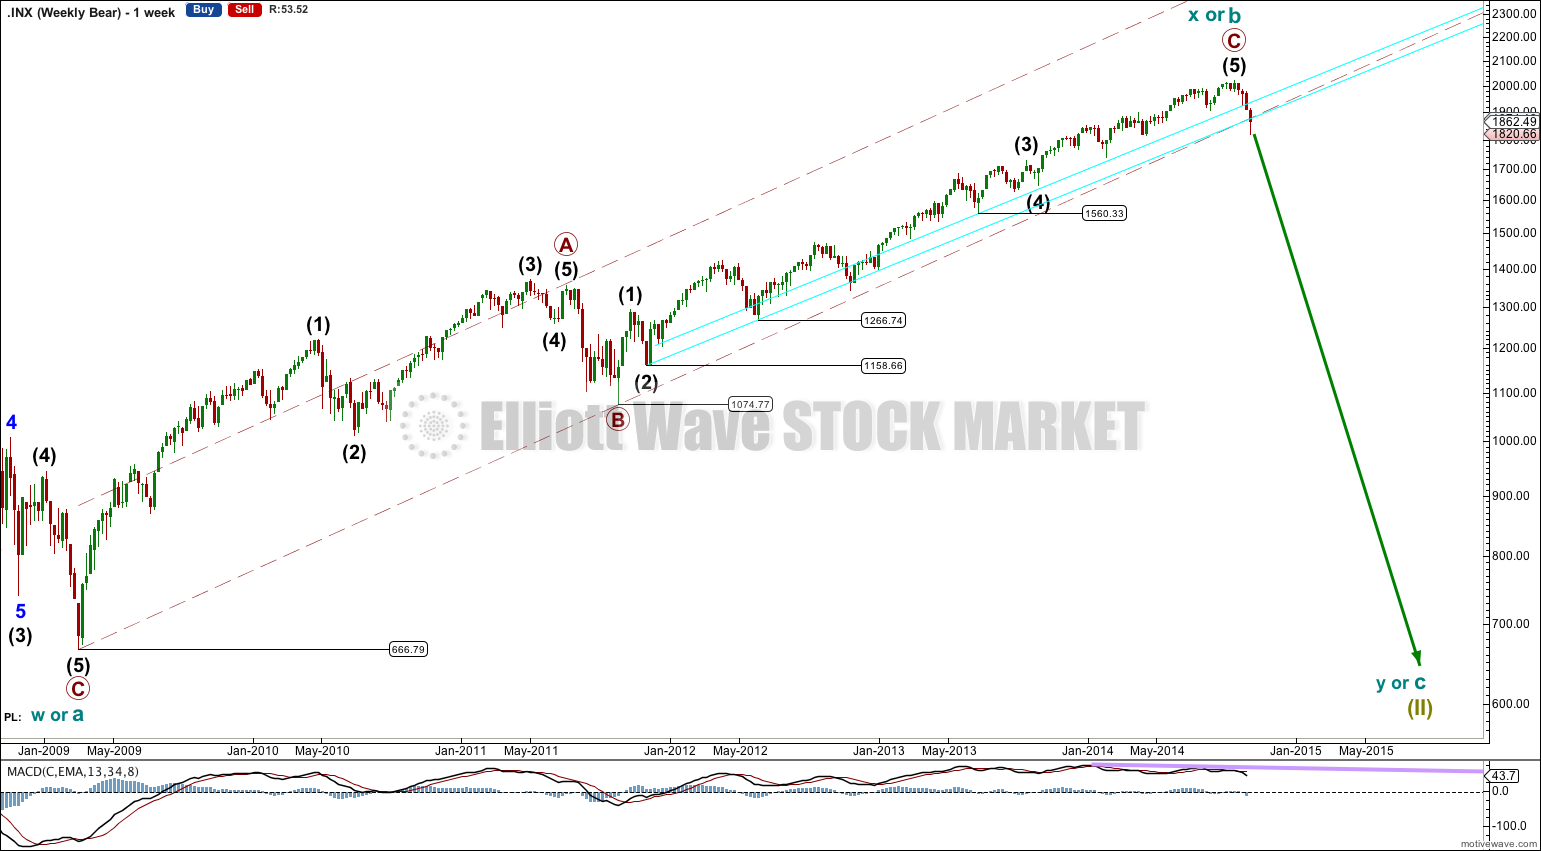
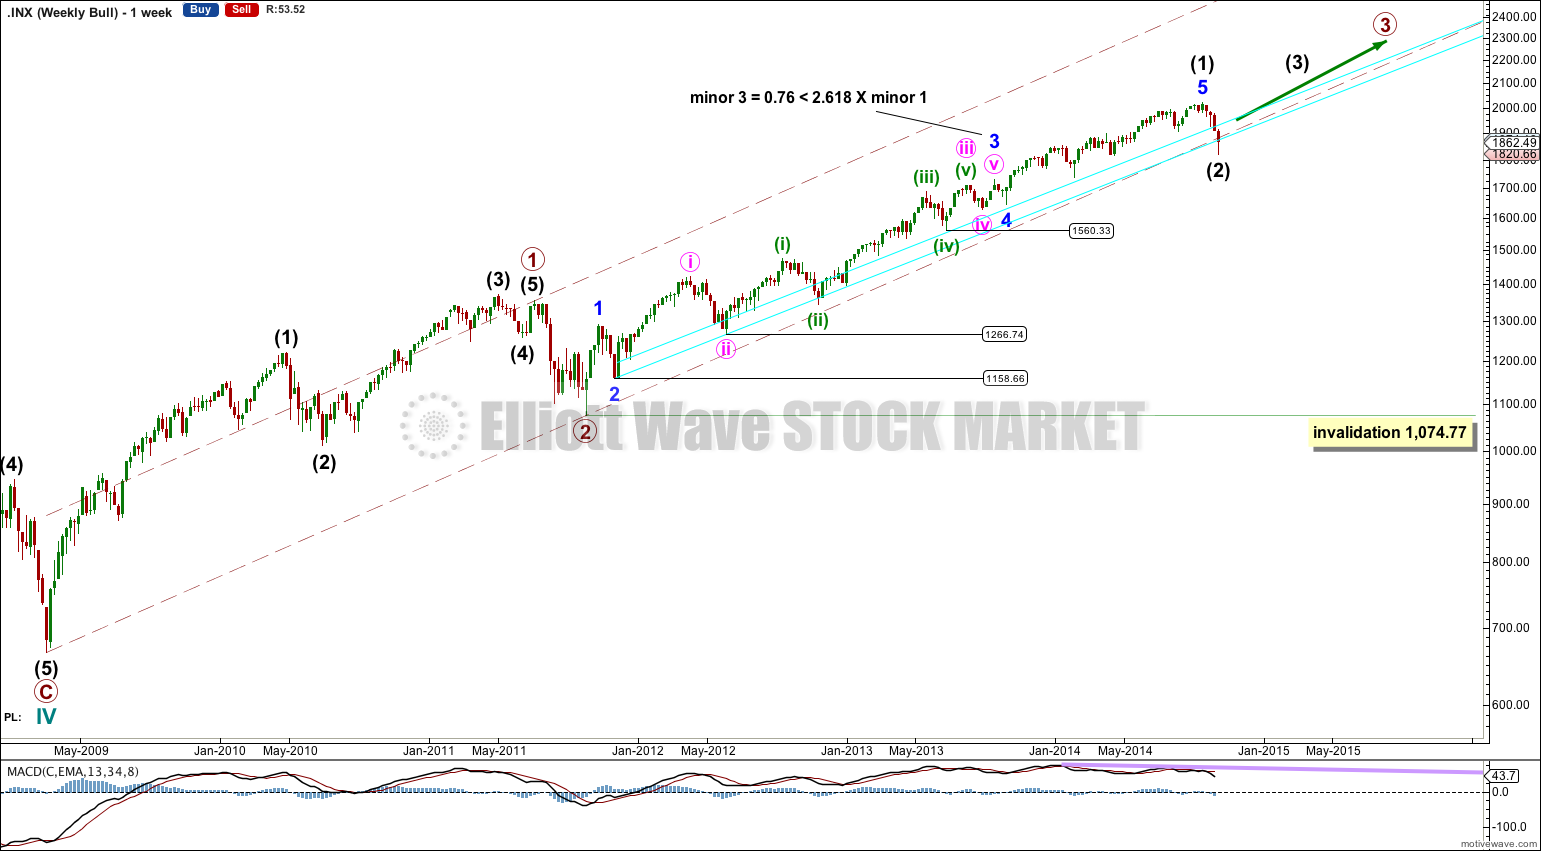
The aqua blue trend lines are critical. Draw the first trend line from the low of 1,158.66 on 25th November, 2011, to the next swing low at 1,266.74 on 4th June, 2012. Create a parallel copy and place it on the low at 1,560.33 on 24th June, 2013. This lower trend line is now breached by about 4% of market value. As this is more than 3% it may now be used to indicate a major trend change.
There is technical divergence at the weekly chart level with price and MACD.
Draw channels and trend lines on the weekly chart and copy over carefully to the daily chart.
There are a couple of things about this wave count of which I am confident. I see minor wave 3 within intermediate wave (1) as over at 1,729.86 (19th September, 2013). It has the strongest upwards momentum and is just 0.76 longer than 2.618 the length of minor wave 1. At 455 days duration this is a remarkably close Fibonacci ratio. The subdivisions within it are perfect.
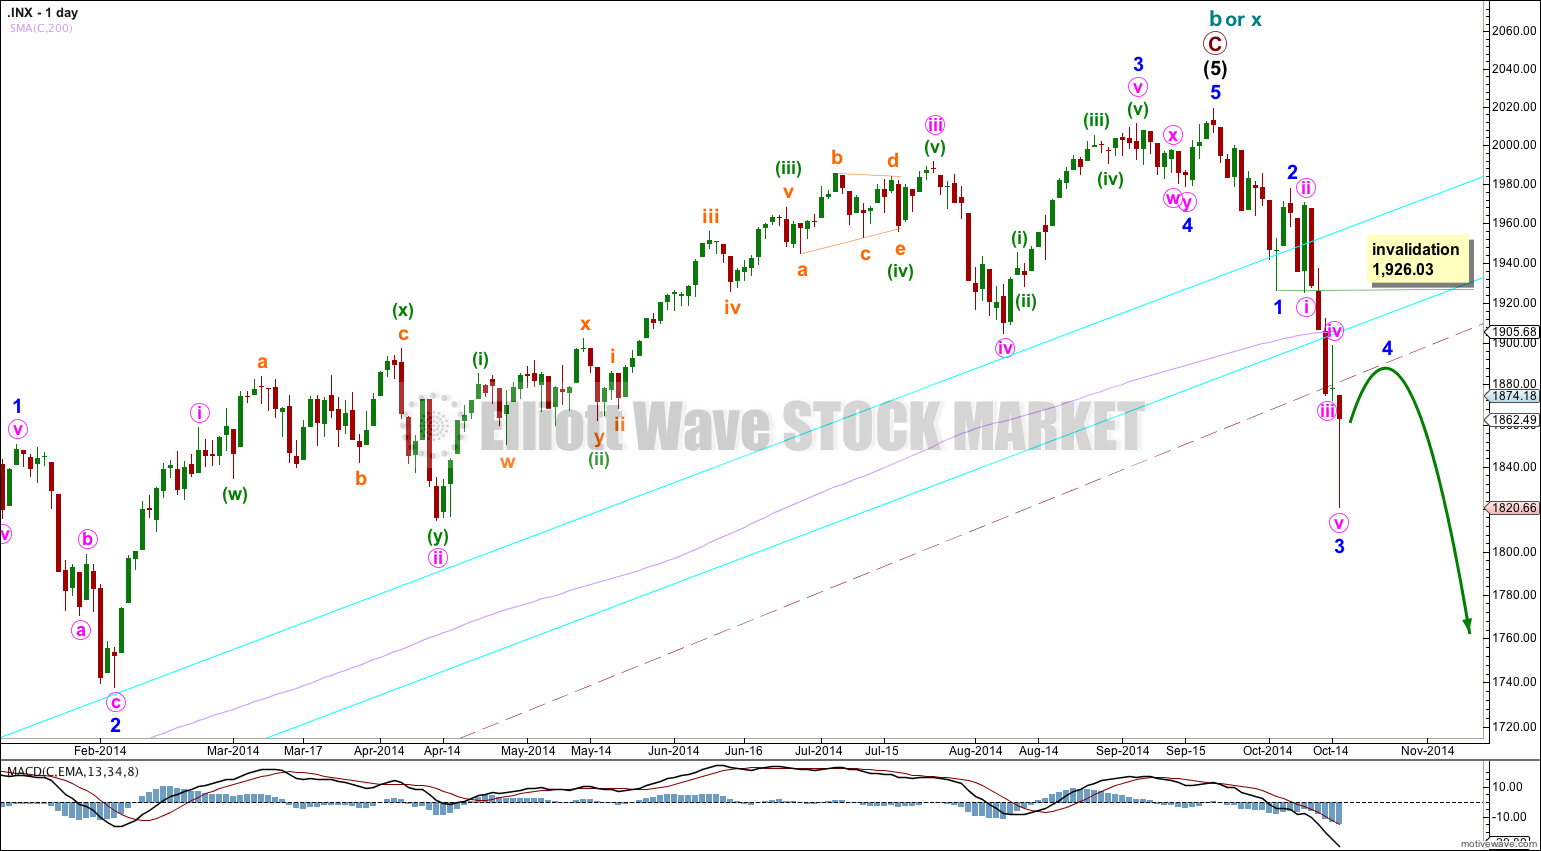
The large maroon – – – channel is copied over from the weekly chart. There is now a full daily candlestick below this channel and not touching the trend line. This is an indication of a trend change: cycle wave b (or x) zigzag should now be over and cycle wave c (or y) should be underway.
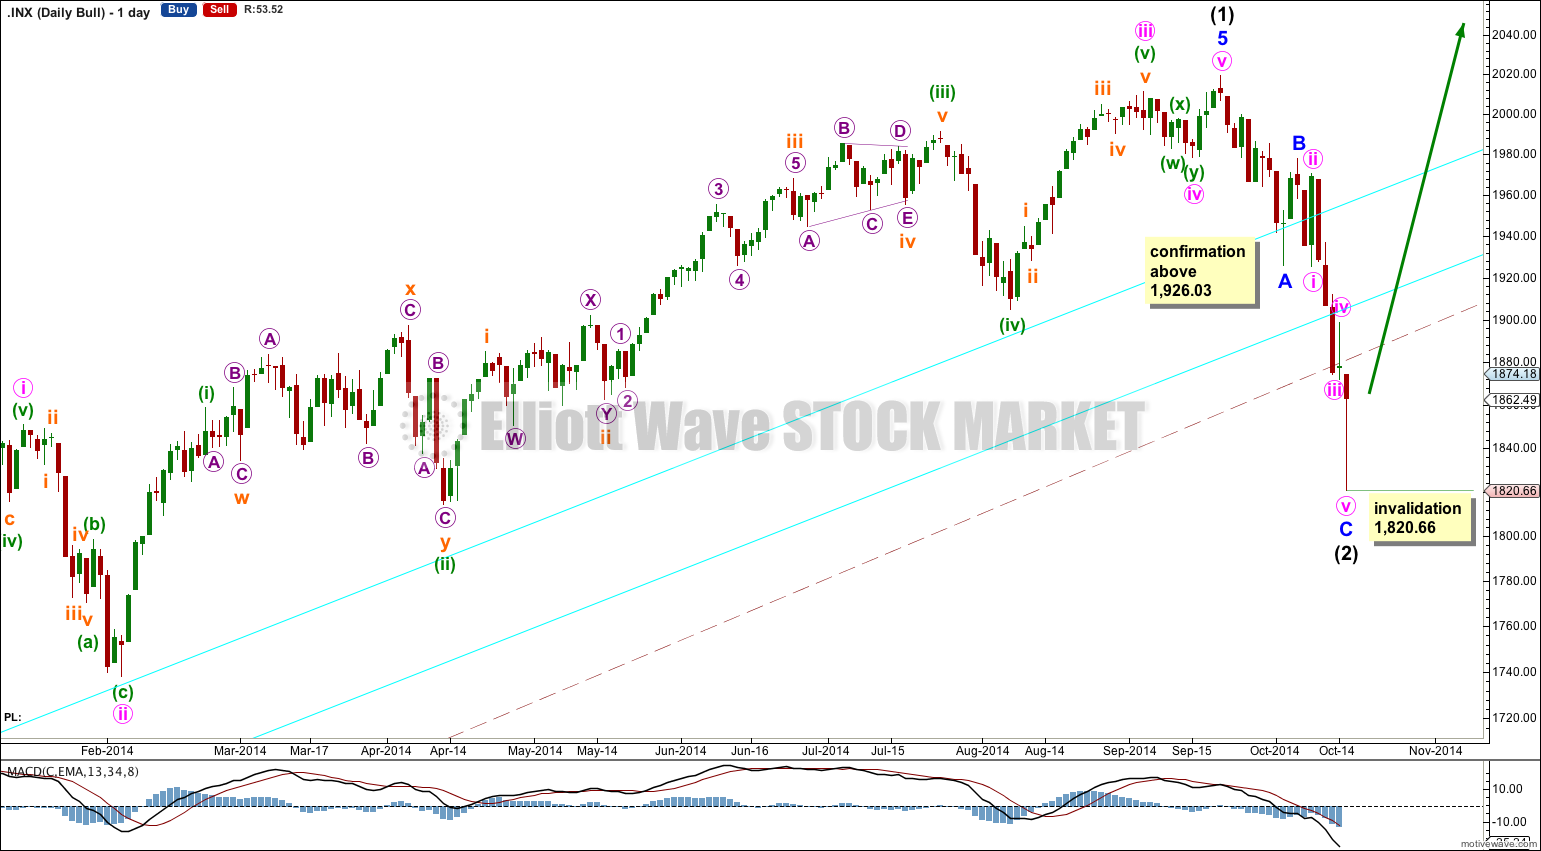
Downwards movement for Wednesday’s session has taken price back into minute wave i and minor wave 1 price territory: minute wave i ends at 1,858.71 and minor wave 1 ends at 1,850.84. This downwards movement may not now be a fourth wave correction of either wave degree. This is further indication of a major trend change.
Price is below the 200 day simple moving average.
I would expect a little upwards movement tomorrow (and maybe the day afterwards if it takes its time) for a fourth wave correction at minor degree. Thereafter, a new low below the end of minor wave 3 at 1,820.66 would provide further confidence in this wave count.
Minor wave 4 may not move into minor wave 1 price territory above 1,926.03.
To have full confidence in this bearish wave count, and to discard the bullish wave count, I want now to see two more things happen:
1. A clear five down on the daily chart, with completion of intermediate wave (1).
2. Confirmation from NASDAQ with a new swing low for that market below 3,414,11.
When we have those two things I will be very confident in this wave count.
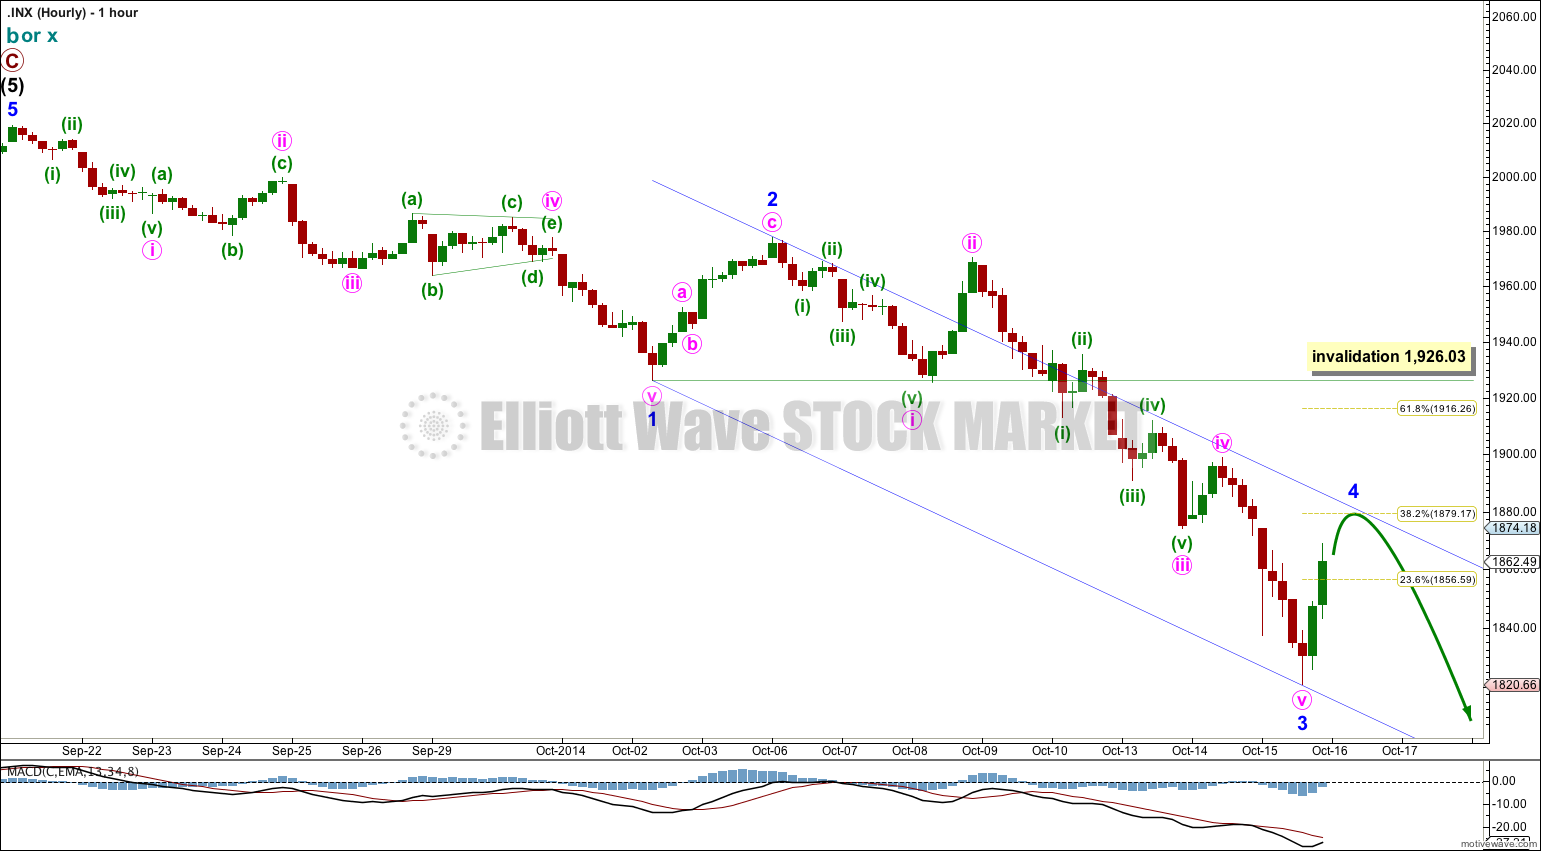
There is no Fibonacci ratio between minor waves 3 and 1.
Ratios within minor wave 3 are: there is no Fibonacci ratio between minute waves iii and i, and minute wave v is 7.04 points short of 1.618 the length of minute wave i.
Draw a channel about this downwards impulse using Elliott’s first technique: draw the first trend line from the lows of minor waves 1 to 3, then place a parallel copy on the high of minor wave 2. I would expect minor wave 4 to be contained within this channel.
Minor wave 4 should end within the price territory of the fourth wave of one lesser degree, which is between 1,874.14 to 1,898.71 of minute wave iv. Or minor wave 4 may end about the 0.383 Fibonacci ratio of minor wave 3 at 1,879.17.
Minor wave 4 should show clearly on the daily chart as at least one or two green candlesticks. If minor wave 4 is an expanded flat, running triangle or combination then it may include a new price low below 1,820.66.
Minor wave 4 may not move into minor wave 1 price territory above 1,926.03.
Bullish Wave Count
For the bullish wave count the maroon – – – channel is a base channel about primary waves 1 and 2. Primary wave 3 should have breached the upper edge of this channel by now. The fact that it has not, and that price held for so long within the lower half of the channel, is cause for concern for this bullish wave count. I would not label primary wave 3 as over until the base channel is breached to the upside.
The base channel should not be breached to the downside by a lower degree second wave correction.
This bullish wave count remains valid, and will do so until there is a clear five down and confirmation from NASDAQ.
At this stage for the bull wave count intermediate wave (2) must be over here. It is now a complete zigzag, and has breached the base channel containing primary waves (1) and (2).
Movement above 1,926.03 should happen within a few days if this wave count is correct. If that happens this would again become my main wave count.
Intermediate wave (2) may not move beyond the start of intermediate wave (1) below 1,074.77, but this wave count should be discarded long before this price point is passed.
Dow Theory
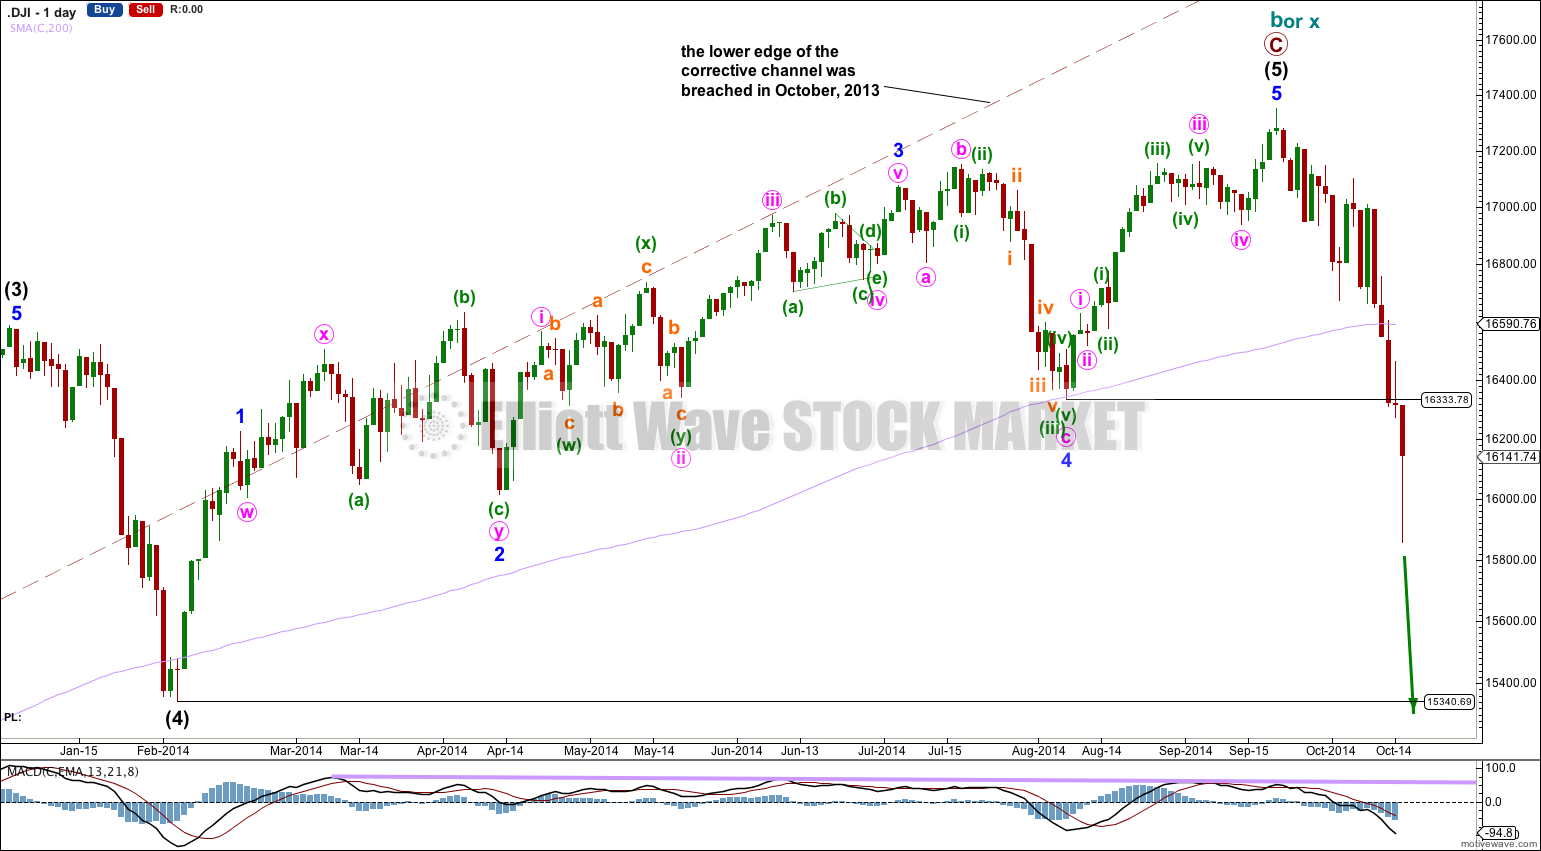
The DJIA has made a new swing low below 16,333.78. A new low below 15,340.69 would be further confirmation from the averages.
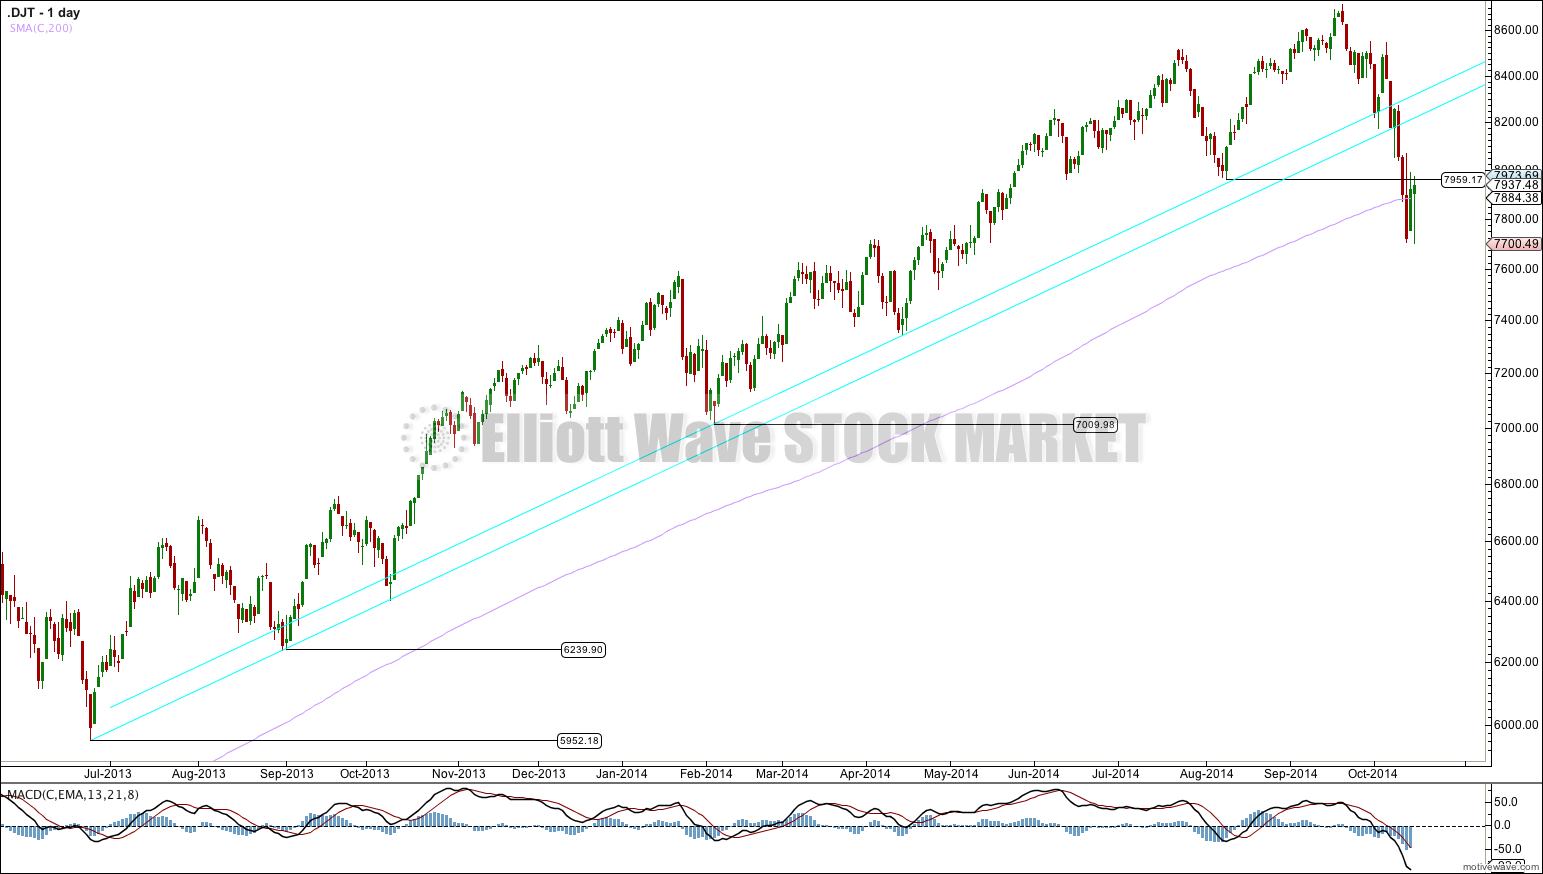
The transportation averages have made a new swing low below 7,959.17.
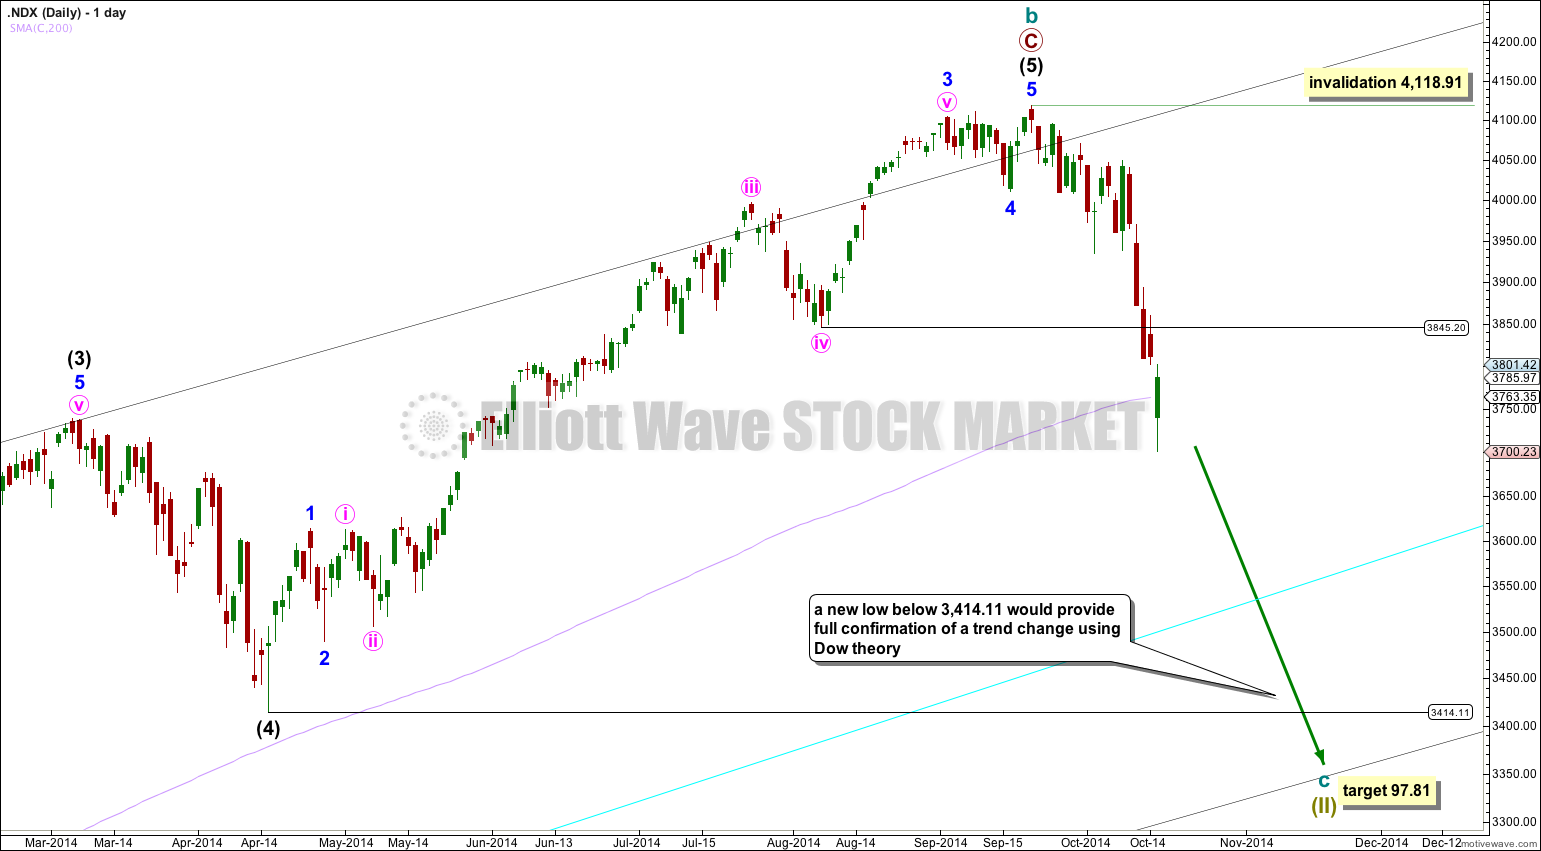
The Nasdaq is the modern day equivalent of the old transportation averages. There is a new swing low below 3,845.20, but for the Nasdaq I do not think this is enough.
The last major swing low is at 3,414.11. When the Nasdaq moves below this point it would provide confirmation of a major trend change in the markets.
The aqua blue line for Nasdaq is drawn from the low of 2,042.90 on 4th Oct, 2011 to the low of 2,494.38 on 16th Nov, 2012. When this line is breached by 3% or more of market value this would provide further confidence in a big trend change.
*Note: all markets have now broken below their 200 day moving averages.
This analysis is published about 08:57 p.m. EST.