
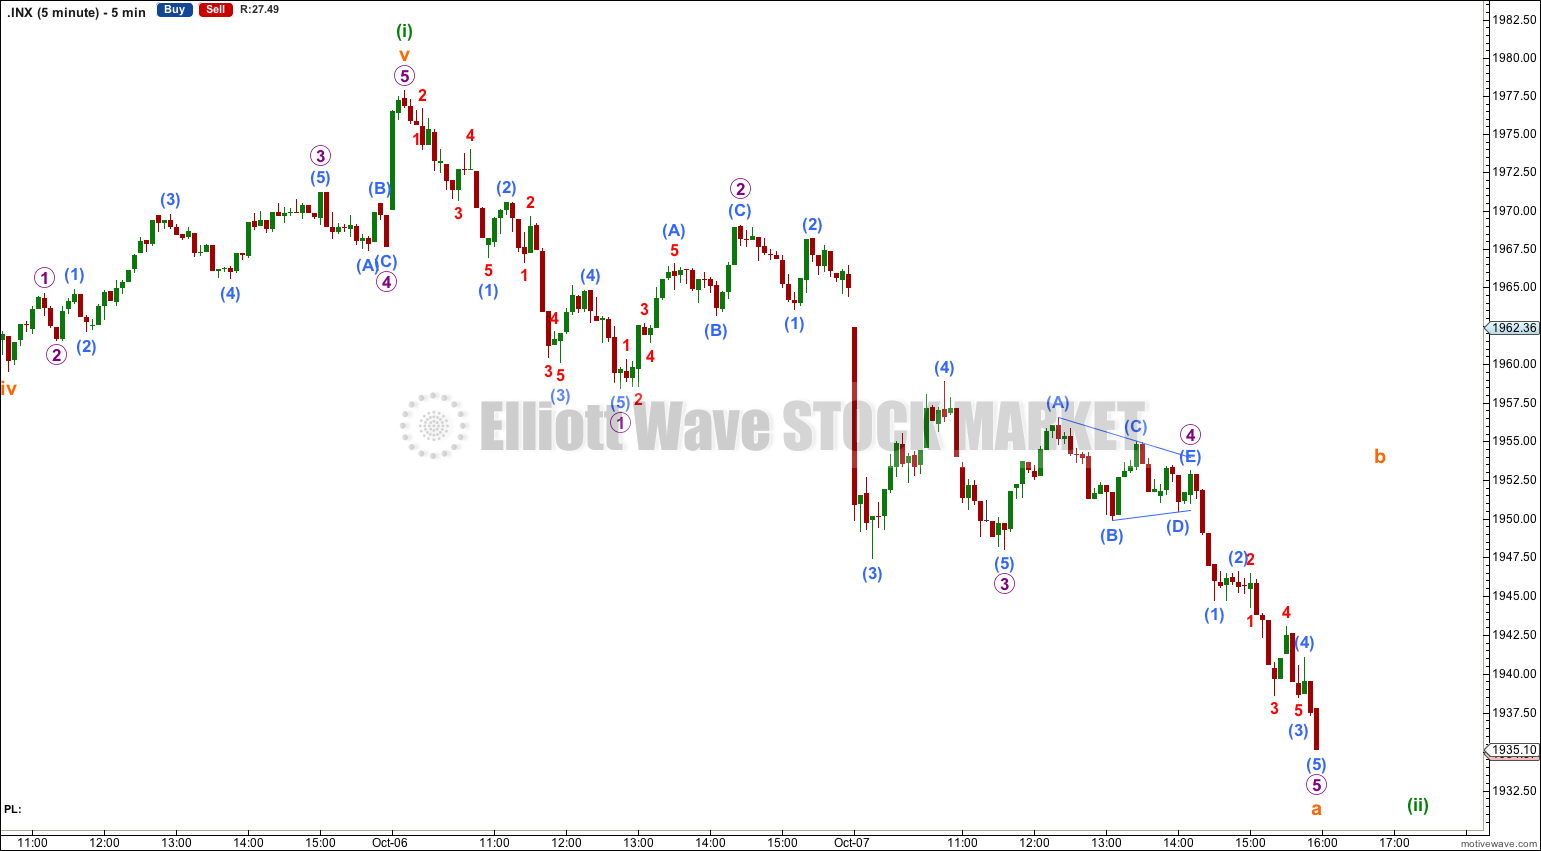
Although some downwards movement was expected for Tuesday’s session, the target at 1,950 was comfortably passed.
Summary: The correction is not yet over and price should continue a little lower tomorrow. If it breaks below 1,926.03 the wave count changes substantially: a high would probably be in place for the end of intermediate wave (1) (bull count) or cycle wave b (bear count). If 1,926.03 holds then I would expect a minuette degree third wave up to begin tomorrow or the day after.
Click on charts to enlarge.
Bullish Wave Count
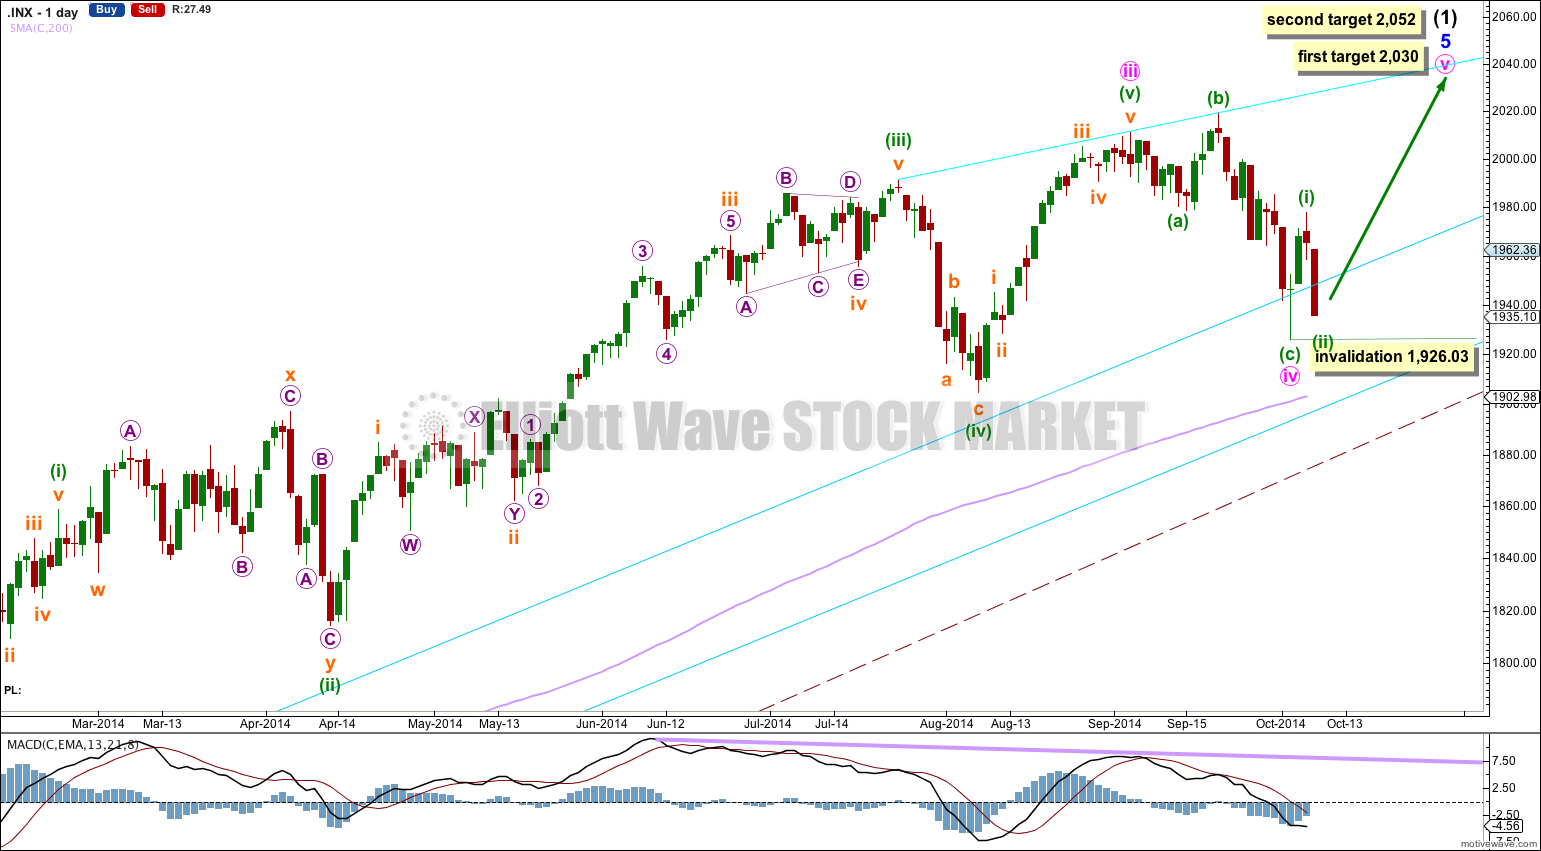
The aqua blue trend lines are critical. Draw the first trend line from the low of 1,158.66 on 25th November, 2011, to the next swing low at 1,266.74 on 4th June, 2012. Create a parallel copy and place it on the low at 1,560.33 on 24th June, 2013. While price remains above the lower of these two aqua blue trend lines we must assume the trend remains upwards. This is the main reason for the bullish wave count being my main wave count.
There are a couple of things about this wave count of which I am confident. I see minor wave 3 within intermediate wave (1) as over at 1,729.86 (19th September, 2013). It has the strongest upwards momentum and is just 0.76 longer than 2.618 the length of minor wave 1. At 455 days duration this is a remarkably close Fibonacci ratio. The subdivisions within it are perfect. If this is correct then minor wave 4 ends at 1,646.47 and this is where minor wave 5 begins.
Within minor wave 5 there is no Fibonacci ratio between minute waves i and iii. This makes it more likely that minute wave v will exhibit a Fibonacci ratio to either of i or iii. Within minor wave 5 minute waves i and iii are both extended. This means that minute wave v may not extend and should be relatively short and brief. At 2,030 minute wave v would reach 0.382 the length of minute wave iii. If price keeps rising through this first target, or if when it gets there the structure is incomplete, then I would use the second target. At 2,052 minute wave v would reach 0.618 the length of minute wave i.
I would expect to see more divergence between price and MACD develop over coming weeks as minute wave v unfolds.
Minute wave i has no Fibonacci duration, lasting 67 sessions. Minute wave ii lasted 14 sessions, one longer than a Fibonacci 13. Minute wave iii lasted 146 sessions, two longer than a Fibonacci 144. Minute wave iv lasted 20 sessions, one short of a Fibonacci 21. Minute wave v may complete in a total Fibonacci 13 or 21.
There is a clear morning doji star candlestick pattern at the end of minute wave iv. As this comes at the end of a downtrend (albeit a brief one) the pattern indicates a trend change.
The large maroon – – – channel is copied over from the weekly chart. It is drawn in exactly the same way on bull and bear wave counts. For the bull wave count this channel is termed a base channel about primary waves 1 and 2. A lower degree second wave should not breach the lower edge of a base channel drawn about a first and second wave one or more degrees higher. The lower maroon – – – trend line differentiates the bull and bear wave counts at cycle degree and monthly chart level.
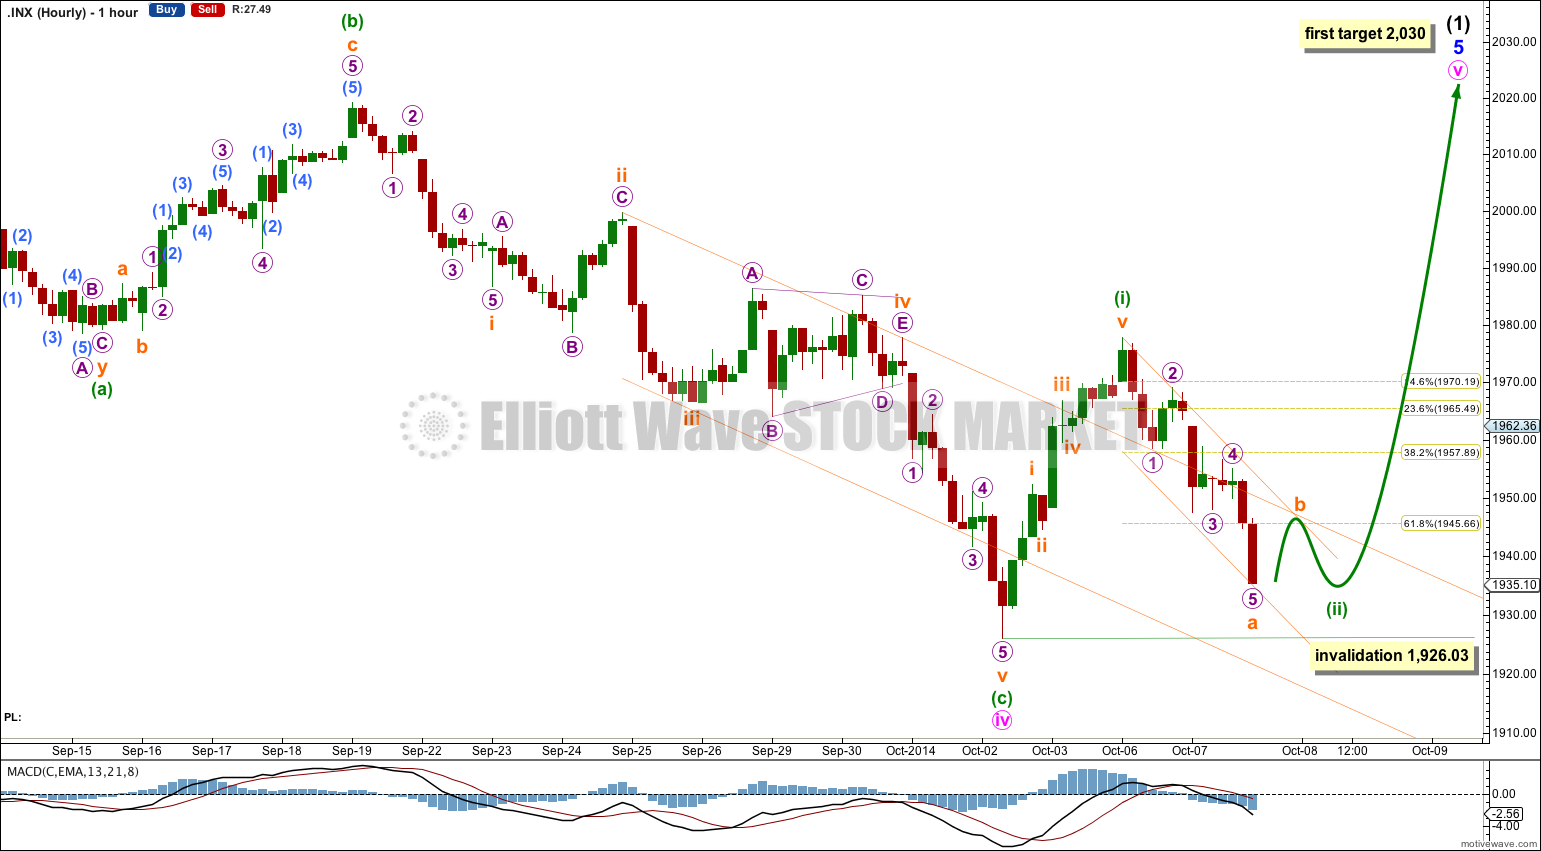
Minuette wave (ii) is showing up clearly on the daily chart as a strong red candlestick. Second wave corrections are more commonly deep than shallow, so although this one is particularly deep this is still normal. The structure for minuette wave (ii) is incomplete. Within it subminuette waves b and c must complete so that it looks like a clear three.
I would expect tomorrow to begin with a little upwards movement either straight away or very early in the session. When subminuette wave b is a completed three then subminuette wave c downwards would be very likely to end just a little below the end of subminuette wave a to avoid a truncation.
When minuette wave (ii) is a completed three wave structure then I would anticipate an increase in upwards momentum as a third wave up unfolds.
Minuette wave (ii) may not move beyond the start of minuette wave (i) below 1,926.03. If this invalidation point is breached at this stage I would expect that a high is in place and that intermediate wave (1) is over at 2,019.26 as per the alternate at the end of this analysis.
Bearish Wave Count
To see the difference between bull and bear wave counts they must be viewed on monthly charts here and video here.
The differentiation between the bull and bear wave count is the maroon – – – channel. For the bear wave count this channel is a corrective channel about cycle wave b or x zigzag. When a channel drawn about a zigzag is breached that provides trend channel confirmation that the zigzag is over and the next wave is underway.
If this trend line is breached by a full weekly candlestick below it and not touching it then this bear wave count would be my main wave count and I would then calculate downwards targets.
We should always assume the trend remains the same until proven otherwise; the trend is your friend. While price remains above the lower maroon – – – trend line I will assume that the S&P 500 remains within a bull market.
Alternate Wave Count
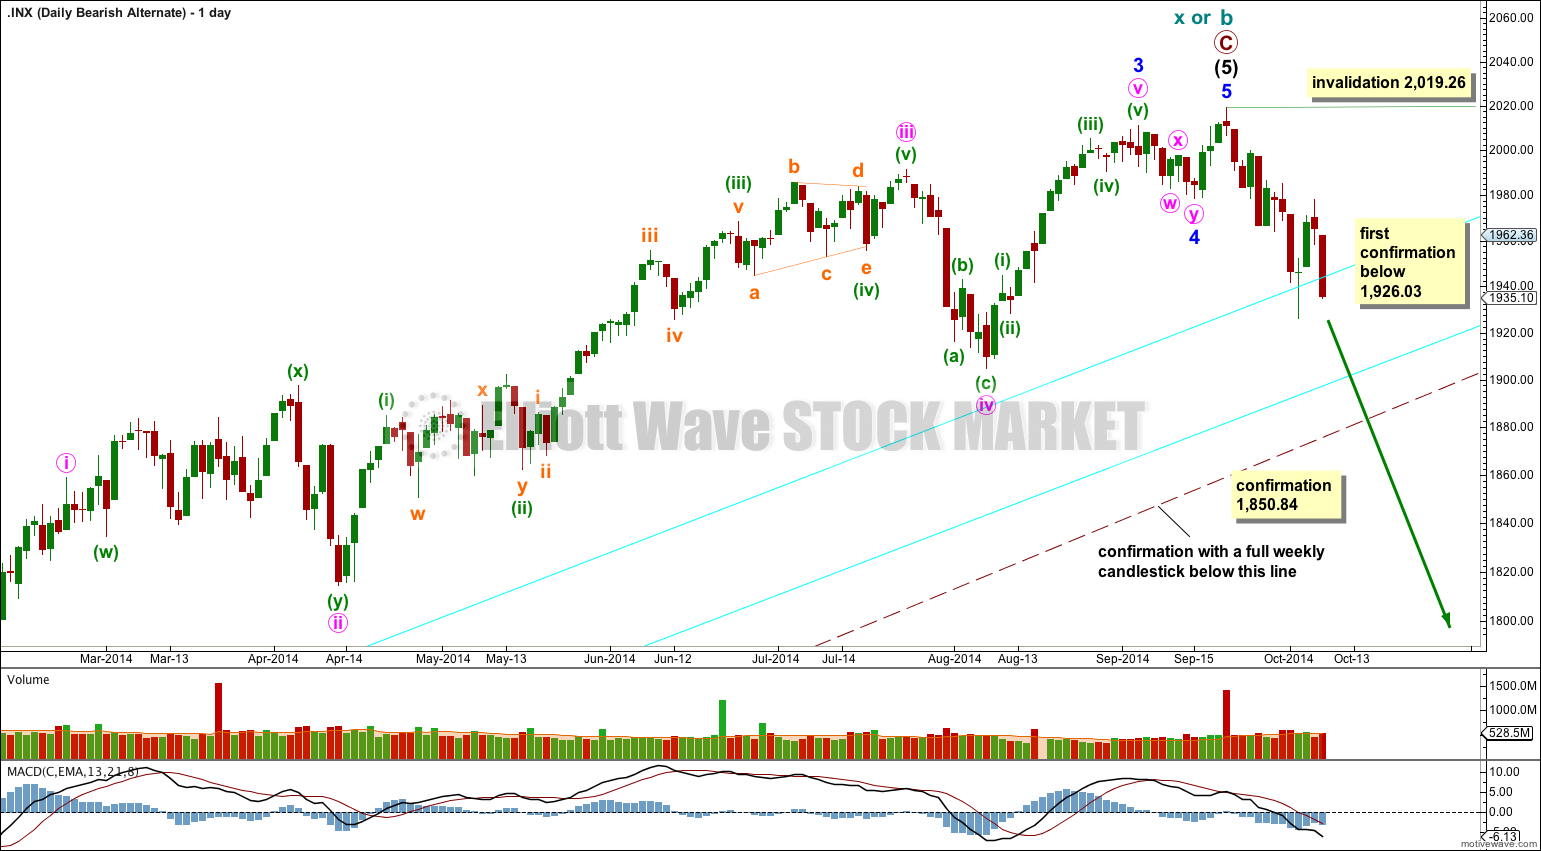
I will again publish this wave count, with the caveat that from an Elliott wave perspective it has a very low probability. But it is possible.
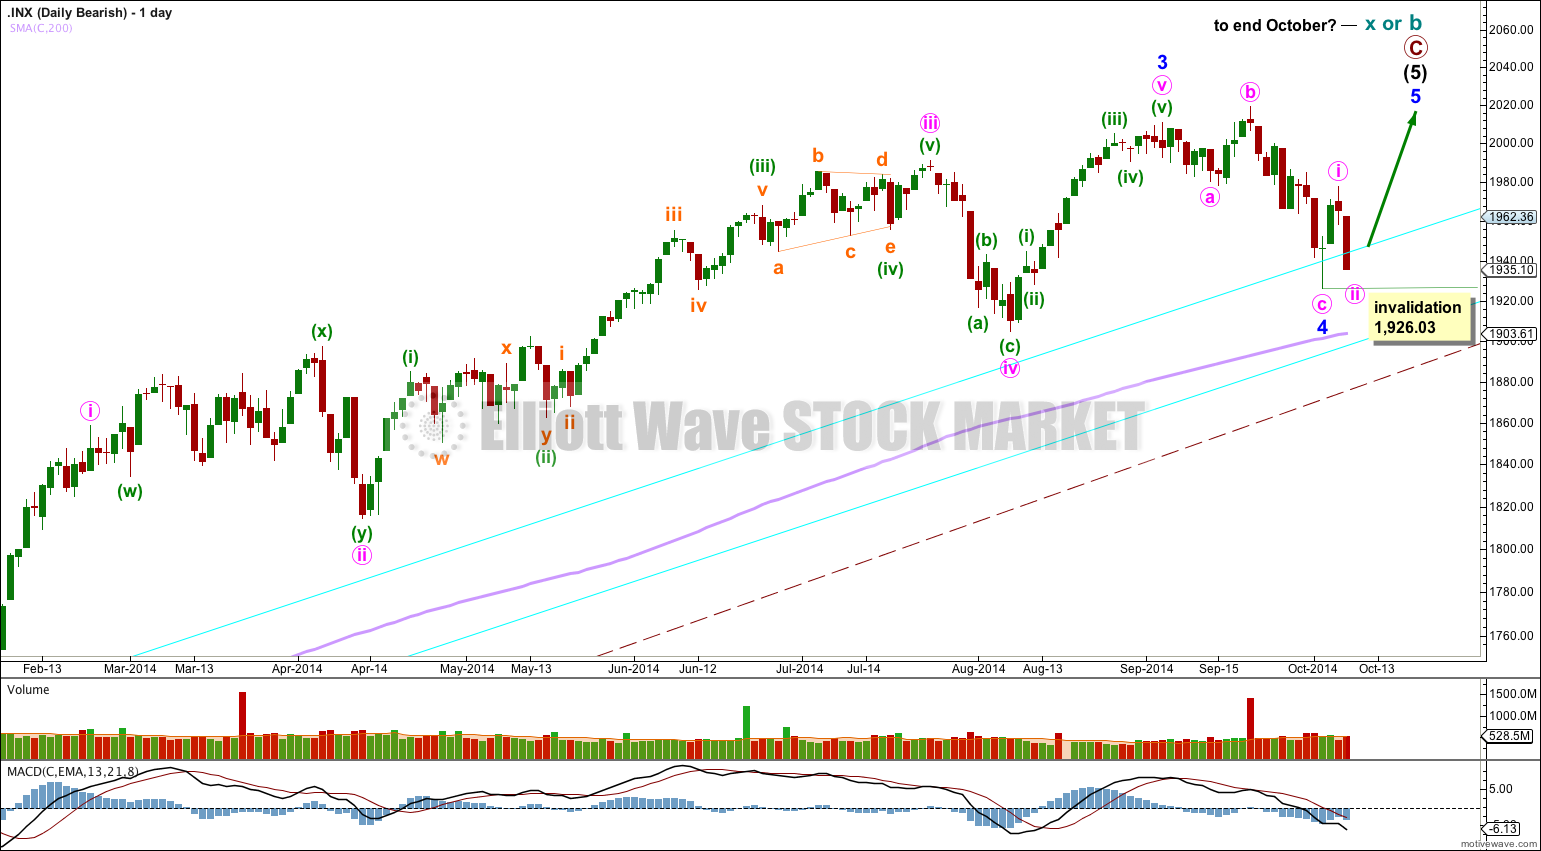
This wave count works for both the bullish and bearish scenarios. It is possible that the long impulse for primary wave C (and for the bull wave count for intermediate wave (1) ) is complete, but only if minor wave 4 is a very brief shallow double zigzag.
For this idea there is poor proportion and alternation between minor waves 2 and 4: minor wave 2 is a deep zigzag lasting 14 days and minor wave 4 is a shallow double zigzag lasting 7 days. This wave count does not have the “right look”.
So far to the downside there may be a first wave complete, and an incomplete second wave correction.
Movement below 1,926.03 prior to a new high would invalidate the main wave counts (both bull and bear) and confirm this idea.
Movement below 1,850.84 could not be a fourth wave correction within the upwards impulse, and so the impulse would have to be over. Also at that stage downwards movement would be below the lower edge of the maroon – – – channel and so the bull wave count should be discarded in its entirety.
This analysis is published about 07:30 p.m. EST.