
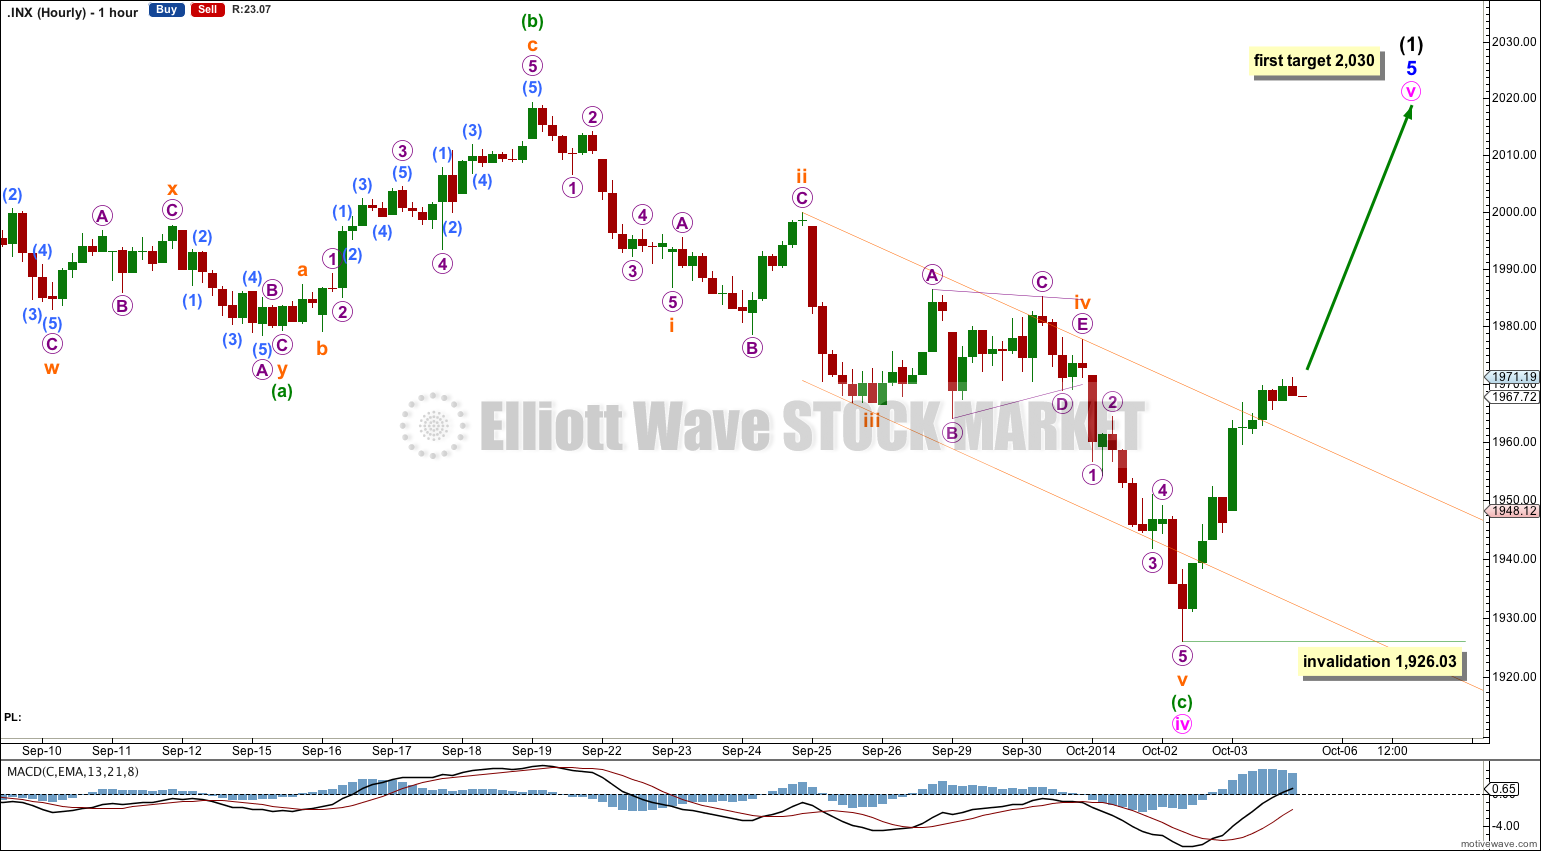
I had expected downwards movement for Friday, but price moved strongly higher to invalidate the hourly Elliott wave count.
Summary: Minute wave iv is over. A clear morning doji star candlestick pattern at the low indicates minute wave v should begin here. The first target at 2,030 may be met within October.
Click on charts to enlarge.
Bullish Wave Count
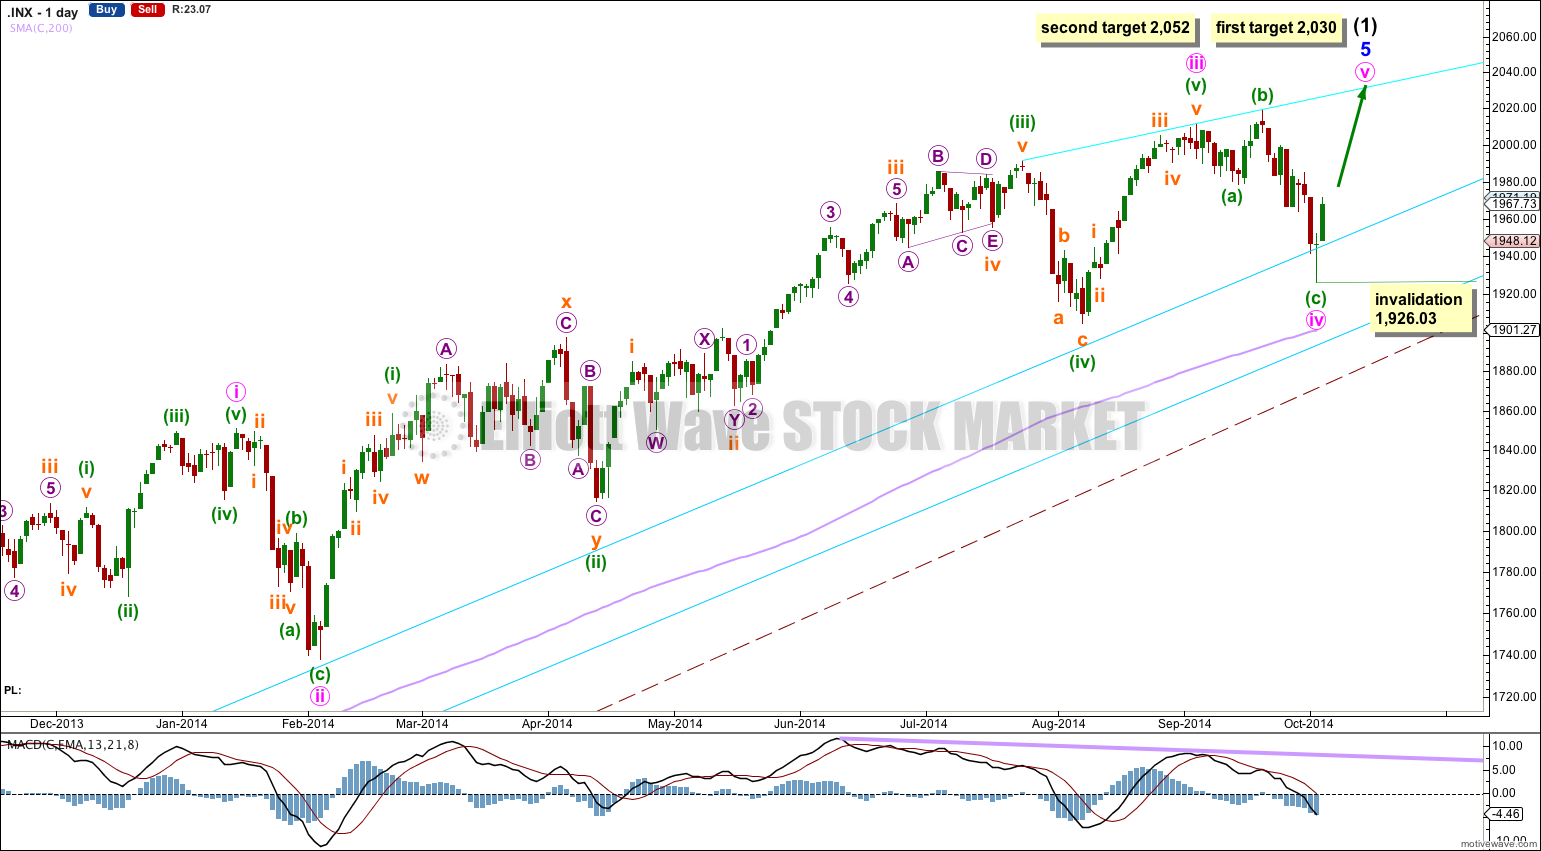
The aqua blue trend lines are critical. Draw the first trend line from the low of 1,158.66 on 25th November, 2011, to the next swing low at 1,266.74 on 4th June, 2012. Create a parallel copy and place it on the low at 1,560.33 on 24th June, 2013. While price remains above the lower of these two aqua blue trend lines we must assume the trend remains upwards. This is the main reason for the bullish wave count being my main wave count.
There are a couple of things about this wave count of which I am confident. I see minor wave 3 within intermediate wave (1) as over at 1,729.86 (19th September, 2013). It has the strongest upwards momentum and is just 0.76 longer than 2.618 the length of minor wave 1. At 455 days duration this is a remarkably close Fibonacci ratio. The subdivisions within it are perfect. If this is correct then minor wave 4 ends at 1,646.47 and this is where minor wave 5 begins.
Within minor wave 5 there is no Fibonacci ratio between minute wave i and iii. This makes it more likely that minute wave v will exhibit a Fibonacci ratio to either of i or iii. Within minor wave 5 minute waves i and iii are both extended. This means that minute wave v may not extend and should be relatively short and brief. At 2,030 minute wave v would reach 0.382 the length of minute wave iii. If price keeps rising through this first target, or if when it gets there the structure is incomplete, then I would use the second target. At 2,052 minute wave v would reach 0.618 the length of minute wave i.
I would expect to see more divergence between price and MACD develop over coming weeks as minute wave v unfolds.
Minute wave i has no Fibonacci duration, lasting 67 sessions. Minute wave ii lasted 14 sessions, one longer than a Fibonacci 13. Minute wave iii lasted 146 sessions, two longer than a Fibonacci 144. Minute wave iv lasted 20 sessions, one short of a Fibonacci 21. Minute wave v may complete in a total Fibonacci 13 or 21.
The large maroon – – – channel is copied over from the weekly chart. It is drawn in exactly the same way on bull and bear wave counts. For the bull wave count this channel is termed a base channel about primary waves 1 and 2. A lower degree second wave should not breach the lower edge of a base channel drawn about a first and second wave one or more degrees higher. The lower maroon – – – trend line differentiates the bull and bear wave counts at cycle degree and monthly chart level.
Although this wave count does not fit with MACD in that the third wave is not the strongest, the fifth wave is, the subdivisions are perfect and it has a typical look. I am finally satisfied now that I have this piece of movement correctly labeled.
Minuette wave (c) has no Fibonacci ratio to minuette wave (a).
Ratios within minuette wave (c) are: subminuette wave iii is 0.67 longer than equality in length with subminuette wave i, and subminuette wave v is 2.07 short of 1.618 the length of subminuette wave iii.
There is perfect alternation and proportion between subminuette waves ii and iv: subminuette wave ii is an expanded flat lasting a Fibonacci 13 hours, subminuette wave iv is a running contracting triangle lasting a Fibonacci 21 hours.
Within minute wave iv no second wave correction may move beyond the start of its first wave below 1,926.03.
I am not publishing a five minute chart today in order to try and have the analysis ready for you before markets close.
Bearish Wave Count
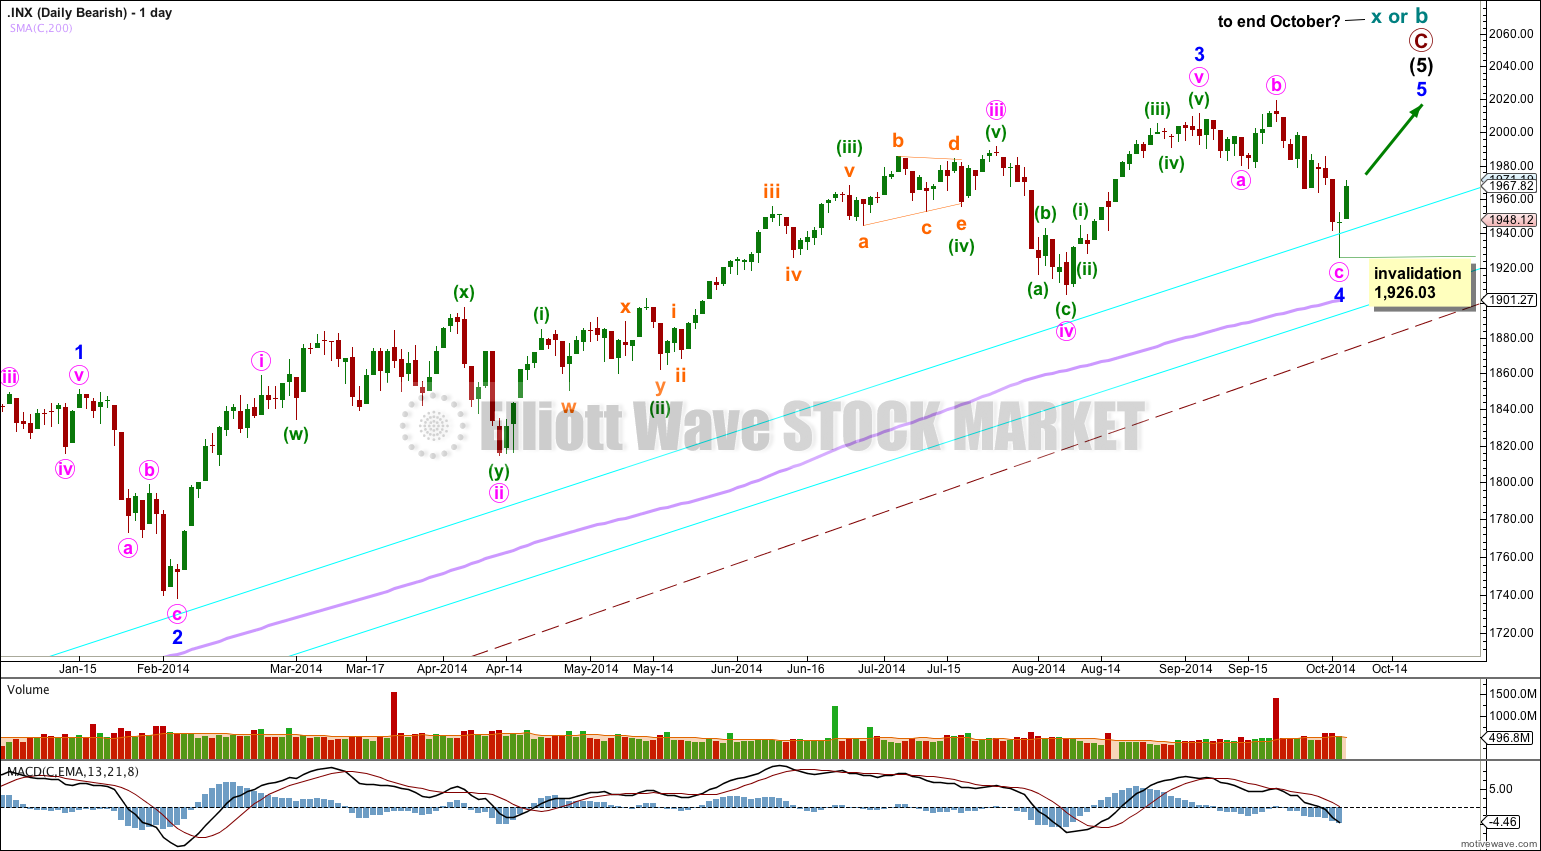
To see the difference between bull and bear wave counts they must be viewed on monthly charts here and video here.
The differentiation between the bull and bear wave count is the maroon – – – channel. For the bear wave count this channel is a corrective channel about cycle wave b or x zigzag. When a channel drawn about a zigzag is breached that provides trend channel confirmation that the zigzag is over and the next wave is underway.
If this trend line is breached by a full weekly candlestick below it and not touching it then this bear wave count would be my main wave count and I would then calculate downwards targets.
We should always assume the trend remains the same until proven otherwise; the trend is your friend. While price remains above the lower maroon – – – trend line I will assume that the S&P 500 remains within a bull market.
This analysis is published about 04:26 p.m. EST.