
The upper aqua blue trend line has been breached for the first time since June 2013. I have two Elliott wave counts for you today for each of the bullish and bearish scenarios.
Summary: The short term outlook looks a little clearer today. Downwards movement should continue to about 1,902 to touch the lower aqua blue trend line and the 200 SMA. This will be either a shakeout bottom before a slight new high, or the end of a first wave before a second wave correction which may not make a new high.
Click on charts to enlarge.
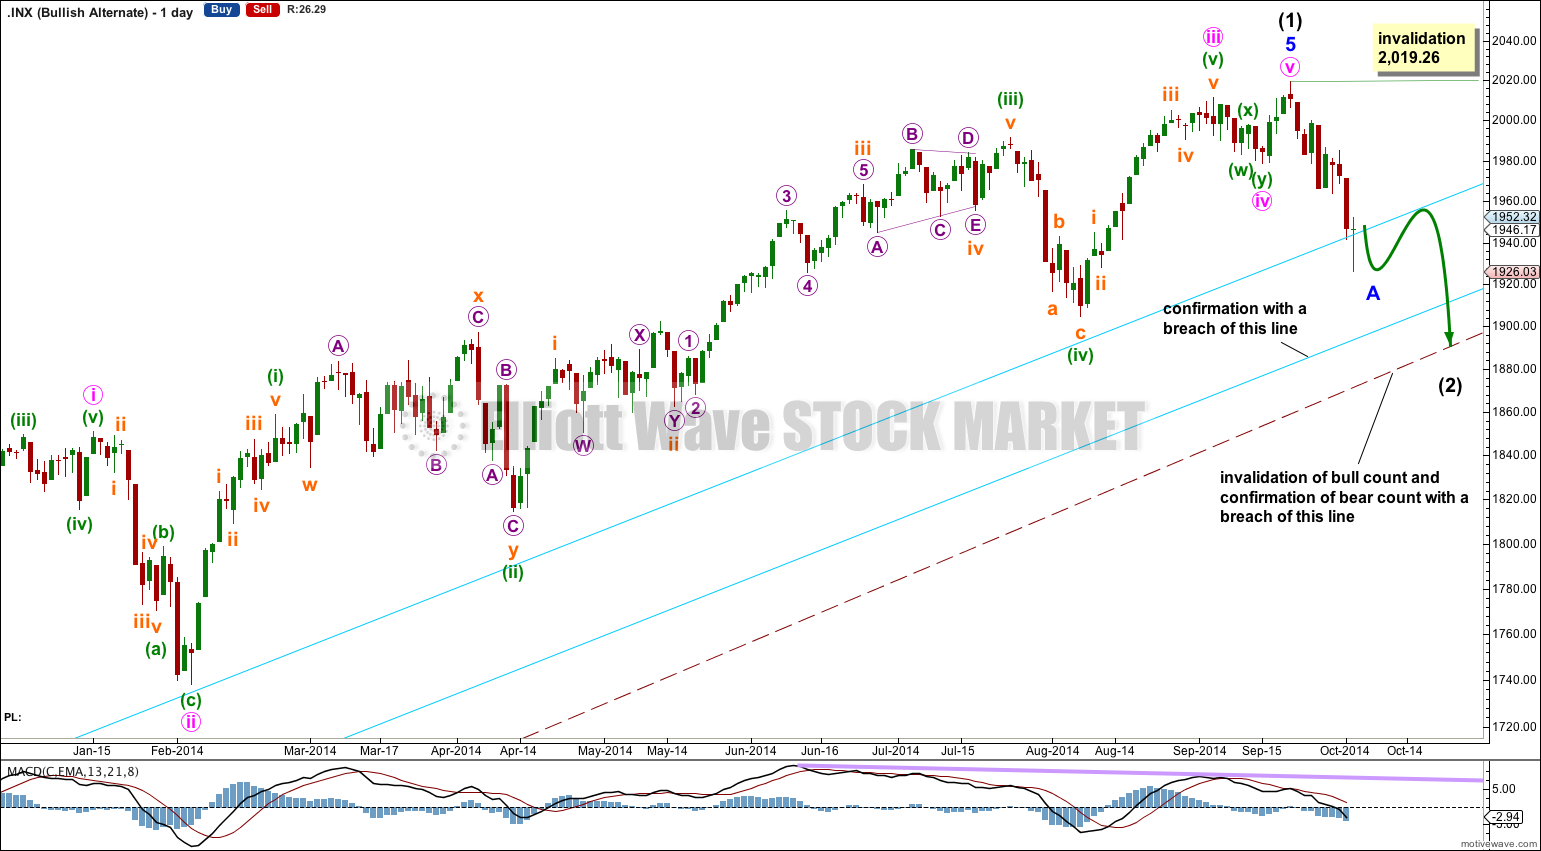
Bullish Wave Count
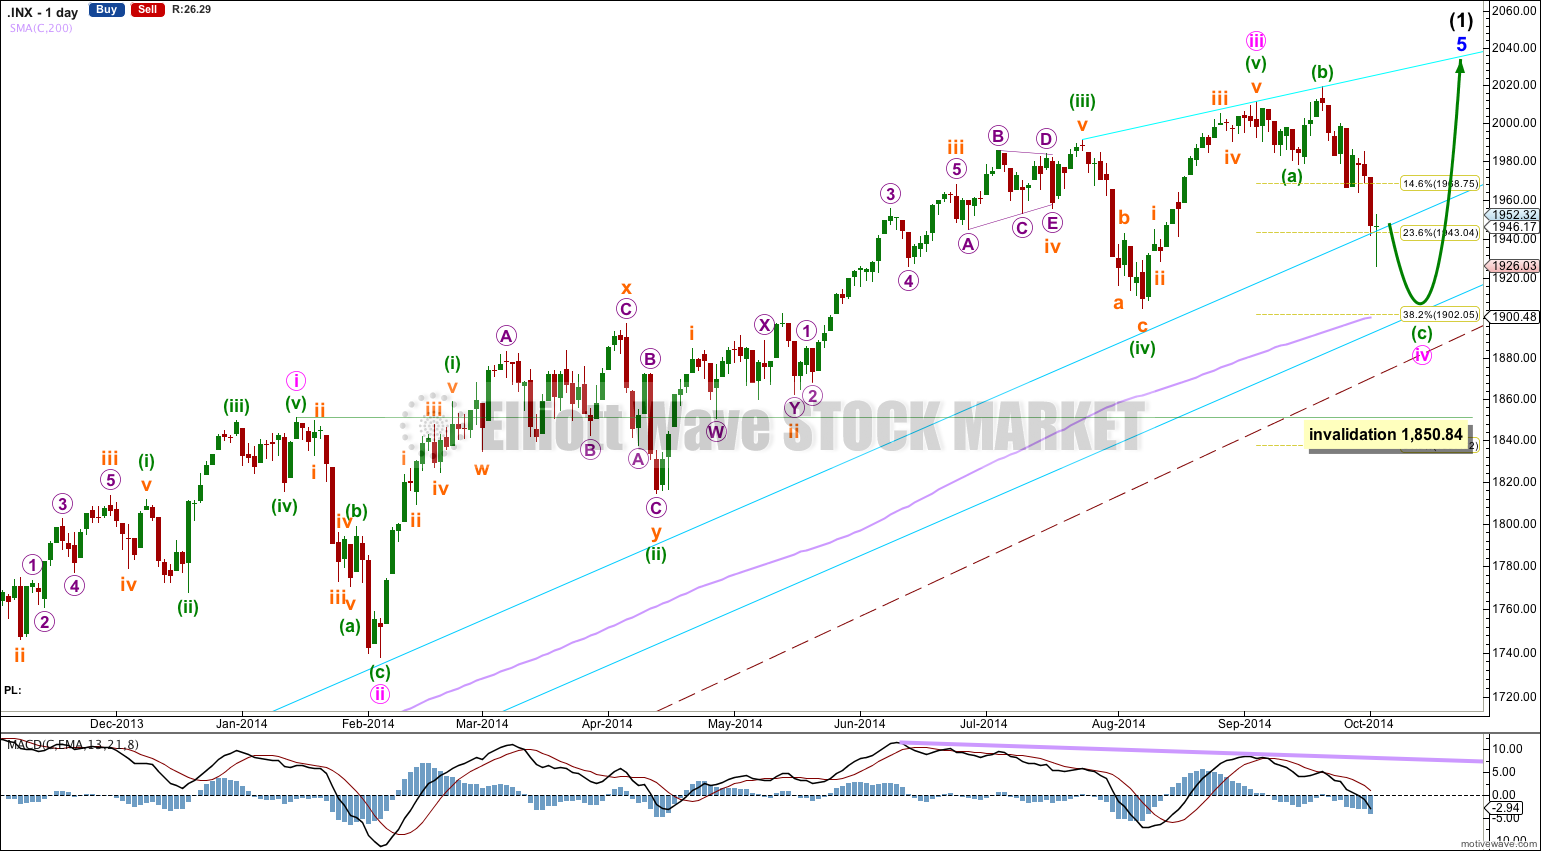
The aqua blue trend lines are critical. Draw the first trend line from the low of 1,158.66 on 25th November, 2011, to the next swing low at 1,266.74 on 4th June, 2012. Create a parallel copy and place it on the low at 1,560.33 on 24th June, 2013. While price remains above the lower of these two aqua blue trend lines we must assume the trend remains upwards. This is the main reason for the bullish wave count being my main wave count.
There are a couple of things about this wave count of which I am confident. I see minor wave 3 within intermediate wave (1) as over at 1,729.86 (19th September, 2013). It has the strongest upwards momentum and is just 0.76 longer than 2.618 the length of minor wave 1. At 455 days duration this is a remarkably close Fibonacci ratio. The subdivisions within it are perfect. If this is correct then minor wave 4 ends at 1,646.47 and this is where minor wave 5 begins.
Within minor wave 5 there is no Fibonacci ratio between minute wave i and iii. This makes it more likely that minute wave v will exhibit a Fibonacci ratio to either of i or iii. Within minor wave 5 minute waves i and iii are both extended. This means that minute wave v may not extend and should be relatively short and brief. When minute wave iv is over I would expect minute wave v to most likely be only about 126 points in length, and to make only a slight new high above 2,019. Minute wave v should also be relatively brief in duration.
I would expect to see more divergence between price and MACD develop over coming weeks as minute wave v unfolds.
Minute wave ii lasted 14 sessions and was a relatively deep 55% zigzag correction. Minute wave iv is showing alternation as a shallow flat correction. If it ends about the 0.382 Fibonacci ratio of minute wave iii at 1,902 it may touch the lower aqua blue trend line and may end when price comes to touch the 200 simple moving average.
The large maroon – – – channel is copied over from the weekly chart. It is drawn in exactly the same way on bull and bear wave counts. For the bull wave count this channel is termed a base channel about primary waves 1 and 2. A lower degree second wave should not breach the lower edge of a base channel drawn about a first and second wave one or more degrees higher. The lower maroon – – – trend line differentiates the bull and bear wave counts at cycle degree and monthly chart level.
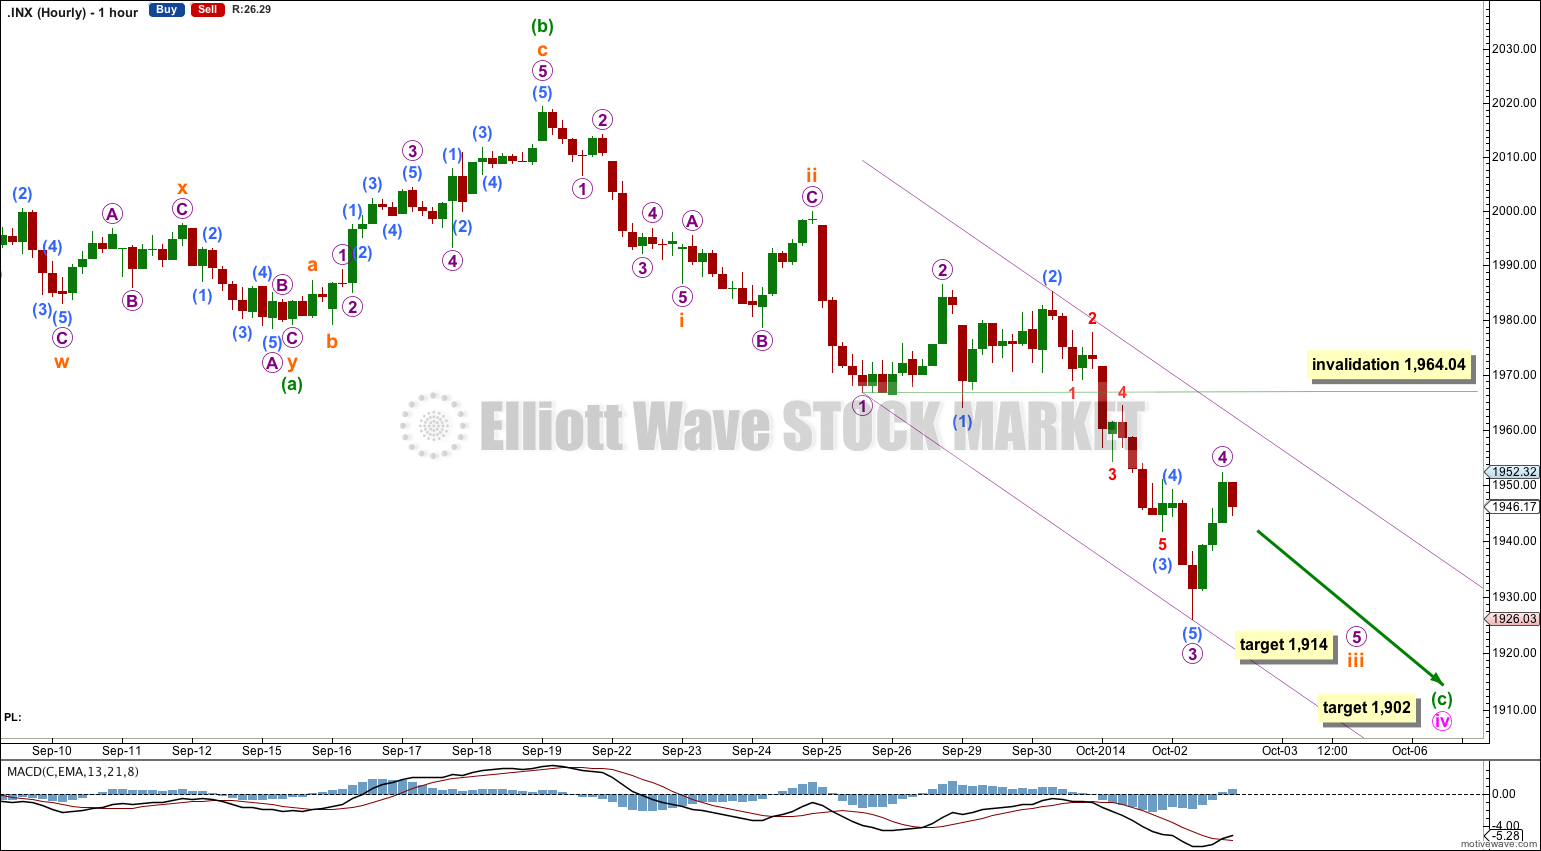
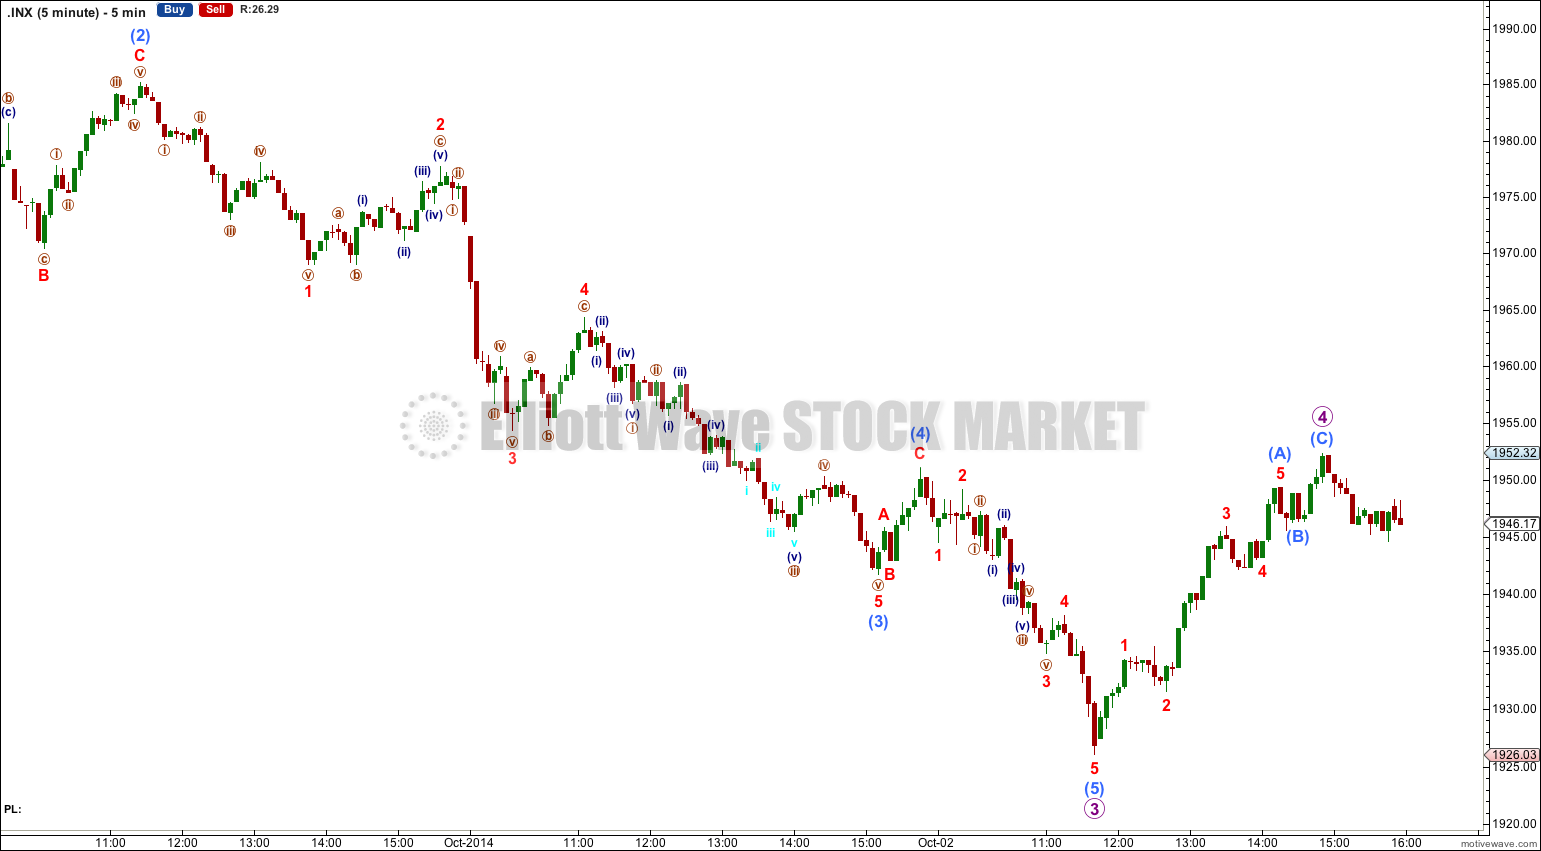
Downwards movement has increased in momentum. This is not a fifth wave and must be a third wave which is incomplete. At 1,914 subminuette wave iii would reach 2.618 the length of subminuette wave i.
At 1,902 minute wave iv should end about the 0.382 Fibonacci ratio of minute wave iii to show alternation in depth and structure.
Minute wave iv should not breach the lower aqua blue trend line, and it definitely should not breach the lower edge of the maroon — base channel on the daily chart. If these trend lines are breached then the alternate wave count would be correct.
Within subminuette wave iii micro wave 4 may not move into micro wave 1 price territory above 1,964.04.
Minute wave iv may be expected to continue for about another two to three days.
This wave count now expects minute wave iv to continue lower to complete a shakeout bottom, before price turns up for the final fifth wave. This shakeout bottom and subsequent new all time high could result in an overwhelmingly bullish sentiment, which in Elliott wave terms should precede a major market turn.
Bearish Wave Count
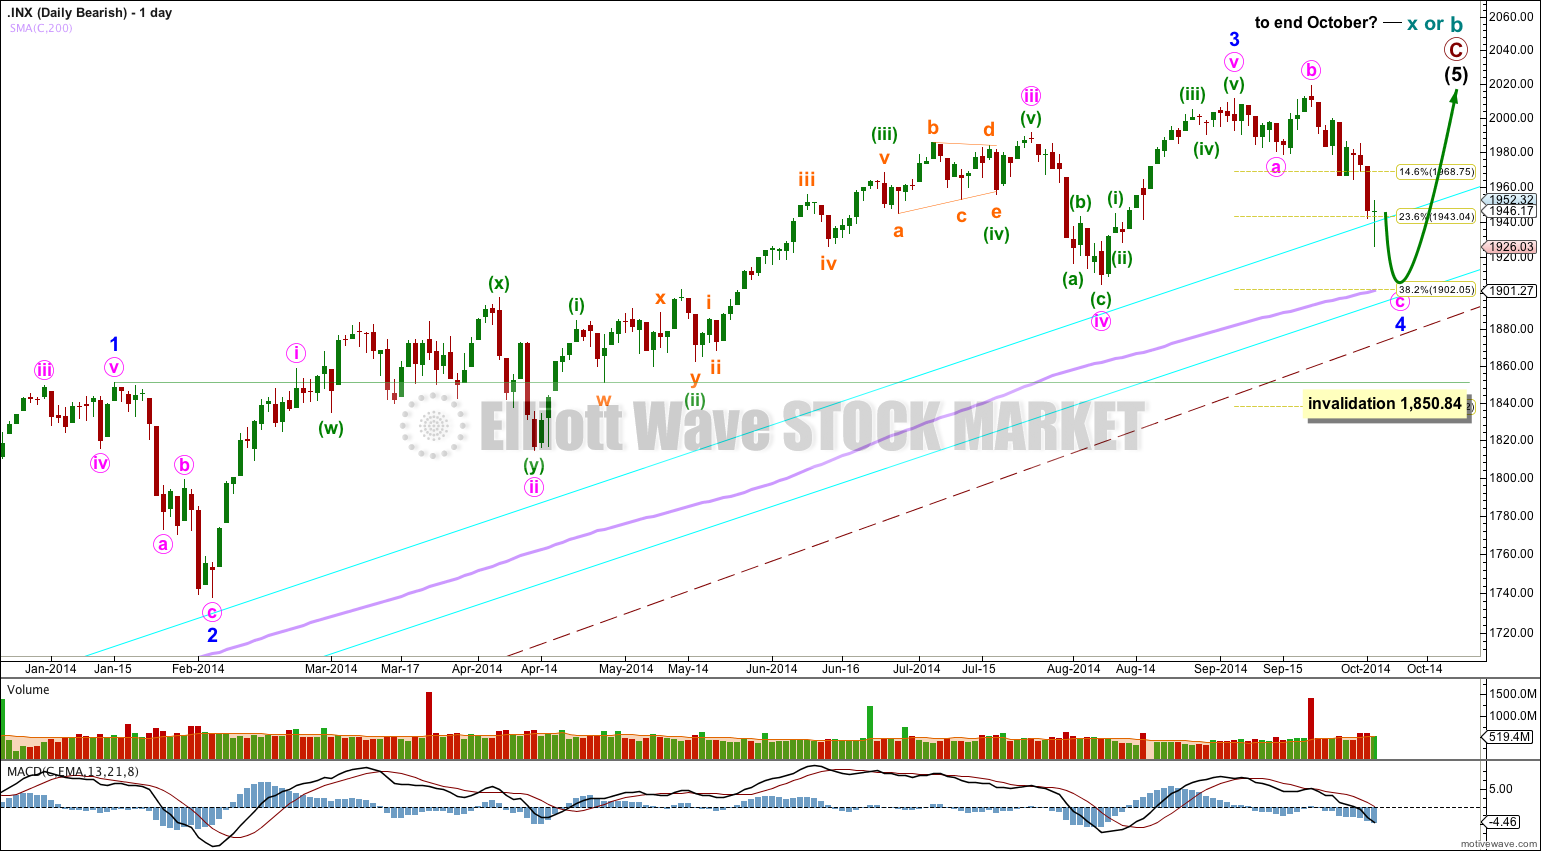
To see the difference between bull and bear wave counts they must be viewed on monthly charts here and video here.
The differentiation between the bull and bear wave count is the maroon – – – channel. For the bear wave count this channel is a corrective channel about cycle wave b or x zigzag. When a channel drawn about a zigzag is breached that provides trend channel confirmation that the zigzag is over and the next wave is underway.
If this trend line is breached by a full weekly candlestick below it and not touching it then this bear wave count would be my main wave count and I would then calculate downwards targets.
We should always assume the trend remains the same until proven otherwise; the trend is your friend. While price remains above the lower maroon – – – trend line I will assume that the S&P 500 remains within a bull market.
Alternate Wave Counts For Both Bull And Bear
It is possible that the upwards impulse of intermediate wave (1) is over.
However, this alternate has a low probability from an Elliott wave perspective for two reasons:
1. Minute wave iv is very brief at only 7 sessions compared to minute wave ii at 14 sessions. The lack of proportion looks odd.
2. Minute wave iv has little structural alternation with minute wave ii; minute wave ii is a single zigzag and minute wave iv is a double zigzag.
The first wave down for intermediate wave (2) is subdividing clearly as a five on the hourly chart, so this structure would be a zigzag. Within a zigzag minor wave B may not move beyond the start of minor wave A above 2,019.26.
Intermediate wave (2) should not breach the lower edge of a base channel drawn about primary waves 1 and 2.
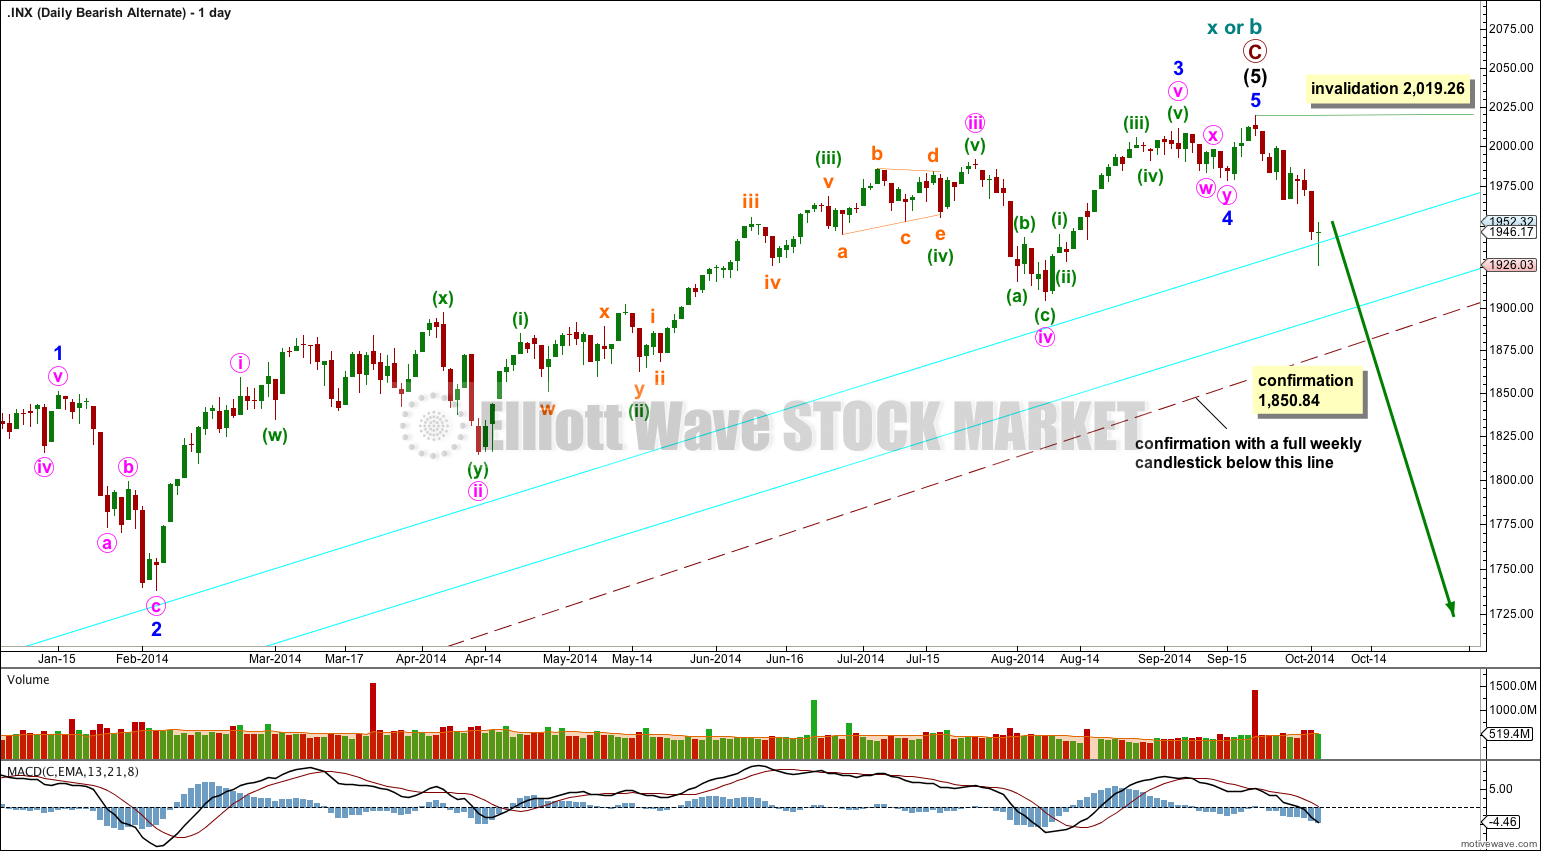
For the bearish wave count this idea expects that a major market turn at cycle degree may have occurred recently. However, here too the problem of a lack of proportion and adequate alternation between minor waves 4 and 2 reduces the probability of this alternate wave count.
Movement below 1,850.84 would be expected for this wave count. At that stage a trend change at cycle degree would probably be confirmed with a breach of the lower edge of the maroon – – – channel.
I would fully discard the bullish wave count only with a full weekly candlestick below the maroon – – – channel.
This analysis is published about 08:34 p.m. EST.