
The short term target for Wednesday’s session was 2009. This was reached and exceeded by 1.74 points.
Summary: Tomorrow should see more downwards movement and a red candlestick. This may be either wave C of a flat correction or wave C of a triangle. Overall, this fourth wave correction is not over.
Click on charts to enlarge.
Bullish Wave Count
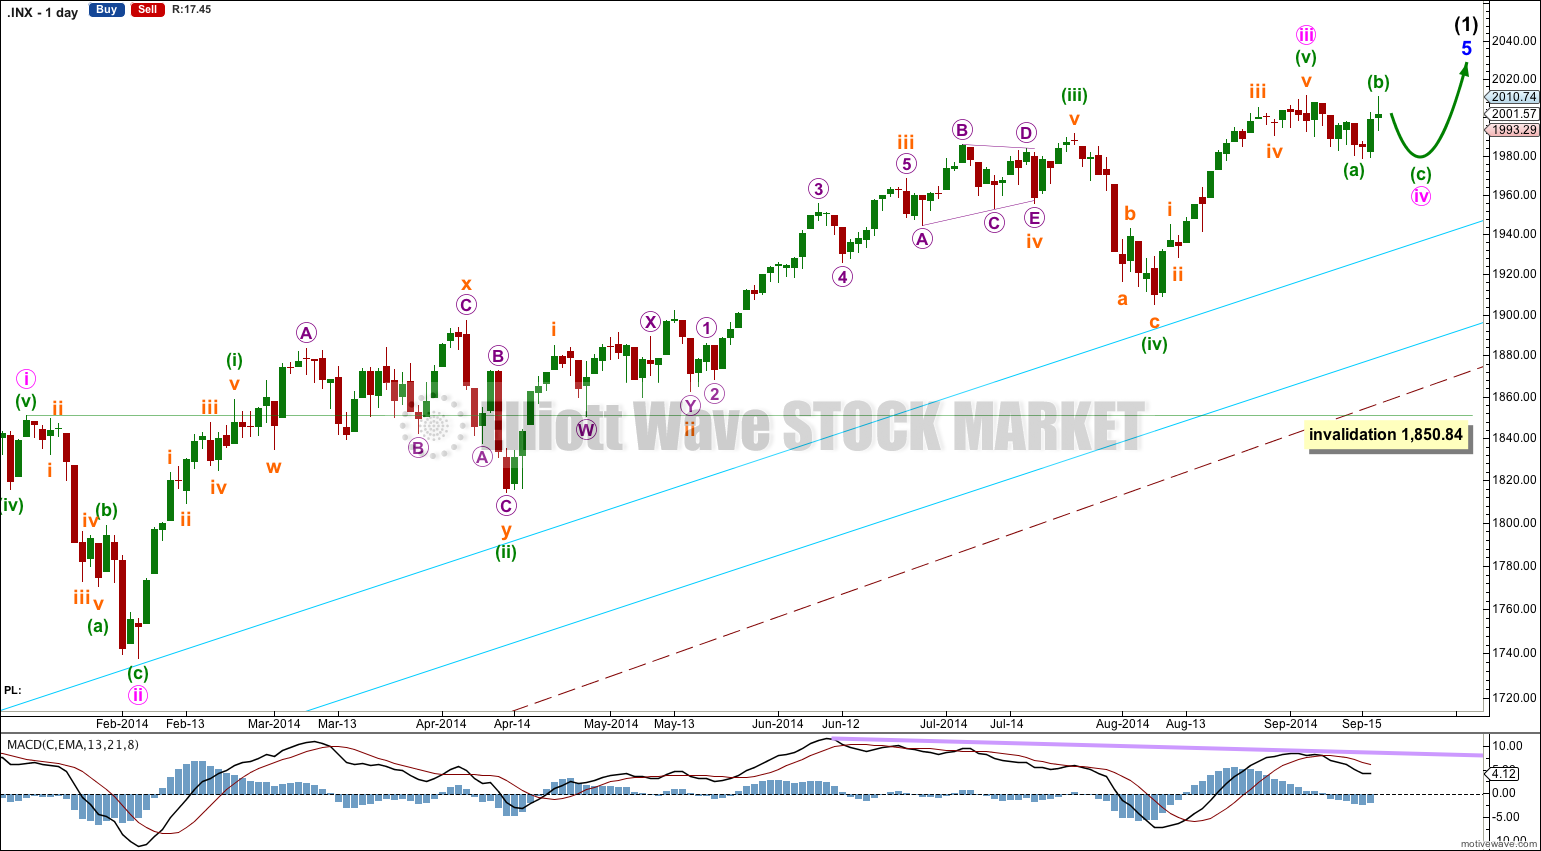
The aqua blue trend lines are critical. Draw the first trend line from the low of 1,158.66 on 25th November, 2011, to the next swing low at 1,266.74 on 4th June, 2012. Create a parallel copy and place it on the low at 1,560.33 on 24th June, 2013. While price remains above the lower of these two aqua blue trend lines we must assume the trend remains upwards. This is the main reason for the bullish wave count being my main wave count.
There are a couple of things about this wave count of which I am confident. I see minor wave 3 within intermediate wave (1) as over at 1,729.86 (19th September, 2013). It has the strongest upwards momentum and is just 0.76 longer than 2.618 the length of minor wave 1. At 455 days duration this is a remarkably close Fibonacci ratio. The subdivisions within it are perfect. If this is correct then minor wave 4 ends at 1,646.47 and this is where minor wave 5 begins.
Because there is already a very close Fibonacci ratio between minor waves 1 and 3 I would not actually expect to see a Fibonacci ratio between minor wave 5 to either of 1 or 3. This means that the target for intermediate wave (1) to end would best be calculated at minute wave degree, within minor wave 5. I will not be able to do that until minute wave iv has ended.
Minor wave 5 is unfolding as an impulse. If minor wave 5 has passed its middle then I would expect to see more divergence between price and MACD develop over coming weeks.
There is no Fibonacci ratio between minute waves iii and i. This makes it more likely we shall see a Fibonacci ratio between minute wave v and either of iii or i, so when minute wave iv is complete I should be able to calculate a target with a reasonably good probability.
Minute wave ii lasted 14 sessions and was a relatively deep 55% zigzag correction. Given the guideline of alternation I would expect minute wave iv to be a more shallow sideways correction. It is most likely to be a flat, double flat, combination or triangle. These structures tend to be long lasting, so I would expect it may take longer than three weeks.
Combinations, expanded flat corrections and running triangles may all include new price extremes beyond their starts. Minute wave iv may include a new high above 2,011.17, should be very choppy and overlapping, and will be difficult to analyse (alternate wave counts will be necessary). While it is unfolding the wave count will change. There are more than thirteen possible structures it may take.
I would expect minute wave iv to end short of the upper aqua blue trend line, continuing a pattern the S&P has shown now for over a year.
The large maroon – – – channel is copied over from the weekly chart. It is drawn in exactly the same way on bull and bear wave counts. For the bull wave count this channel is termed a base channel about primary waves 1 and 2. A lower degree second wave should not breach the lower edge of a base channel drawn about a first and second wave one or more degrees higher. The lower maroon – – – trend line differentiates the bull and bear wave counts at cycle degree and monthly chart level.
Main Hourly Wave Count
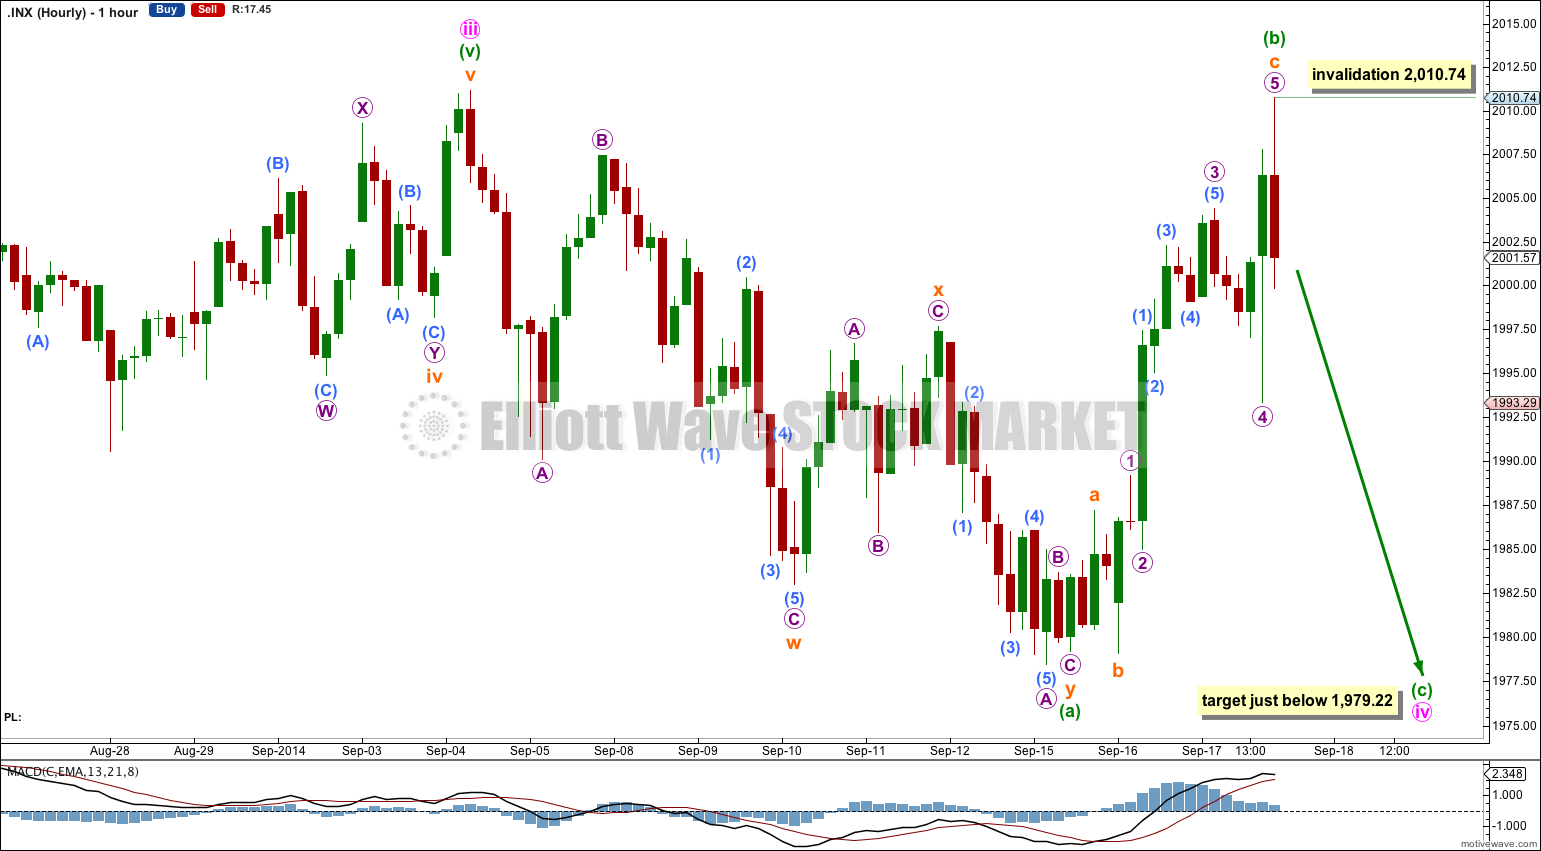
If minute wave iv is unfolding as a flat correction it may be a regular flat. So far minuette wave (b) is a 99% correction of minuette wave (a).
This wave count, and the invalidation point, are reliant on me having the upwards movement of minuette wave (b) right. If my analysis of this movement is wrong (and it is very difficult to analyse on the five minute chart) then it is possible we may see a new all time high tomorrow.
Either way, minuette wave (b) is most likely over here. If it did continue higher it should not be by much.
A regular flat correction expects minuette wave (c) to end just below the end of minuette wave (a) at 1,979.22 to avoid a truncation and a rare running flat. Minuette wave (c) must subdivide as a five wave structure.
Within minuette wave (c) no second wave correction may move beyond the start of its first wave above 2,010.74.
Alternate Hourly Wave Count
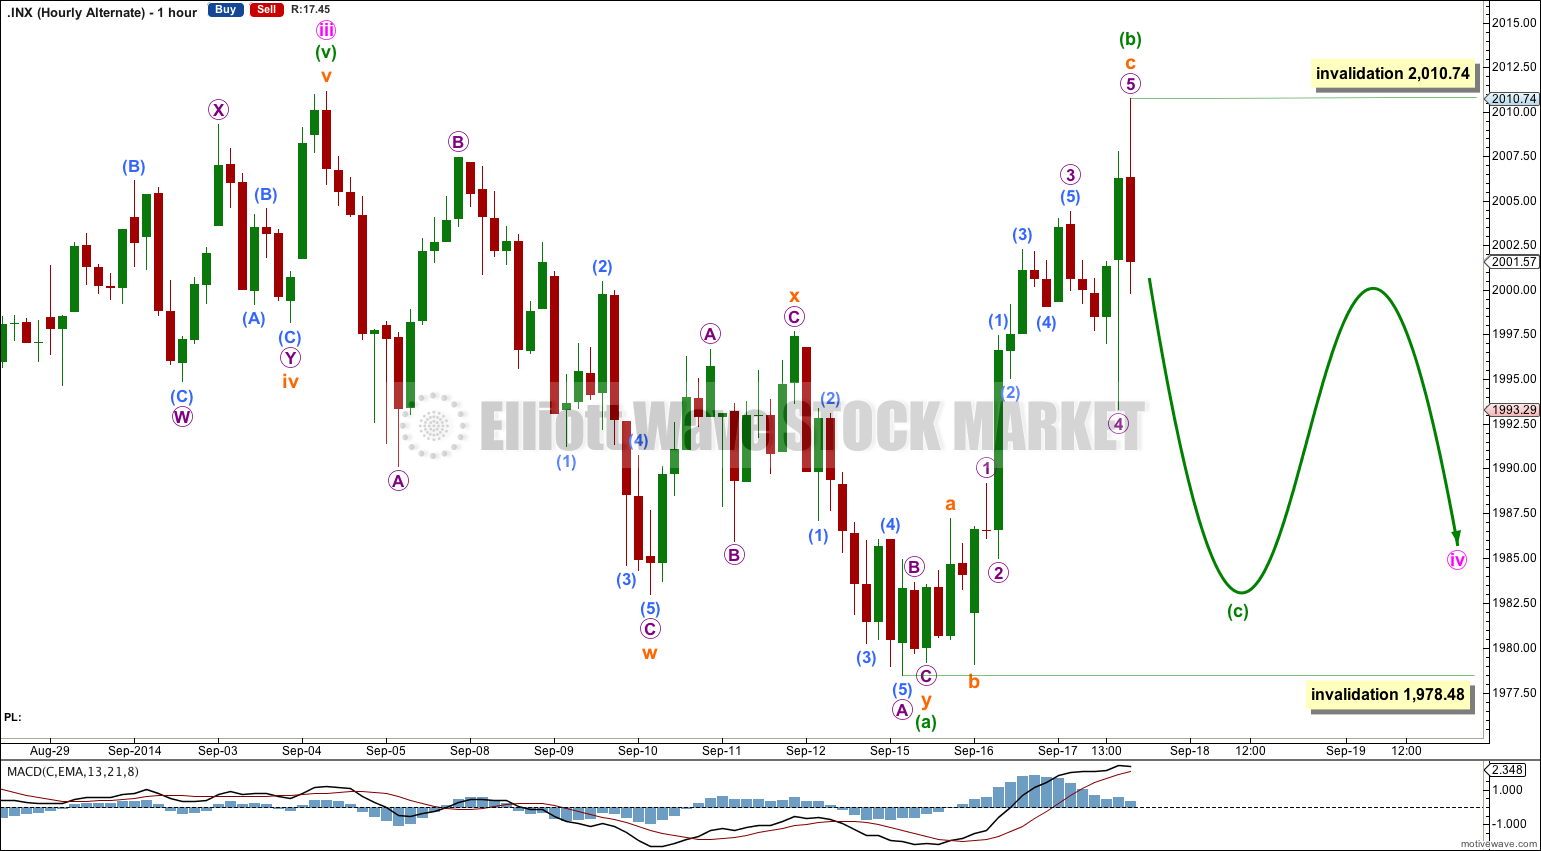
If minute wave iv is unfolding as a triangle then within it minuette wave (c) downwards tomorrow must subdivide as a single zigzag.
Minuette wave (c) may not move beyond the end of minuette wave (a). I am placing this lower invalidation point at the price low though, at 1,978.48, to allow for the possibility that my analysis of the end of minuette wave (a) and the start of minuette wave (b) contains some errors.
This second idea for minute wave iv expects choppy overlapping sideways movement for a few days yet, in an ever decreasing range.
Bearish Alternate Wave Count
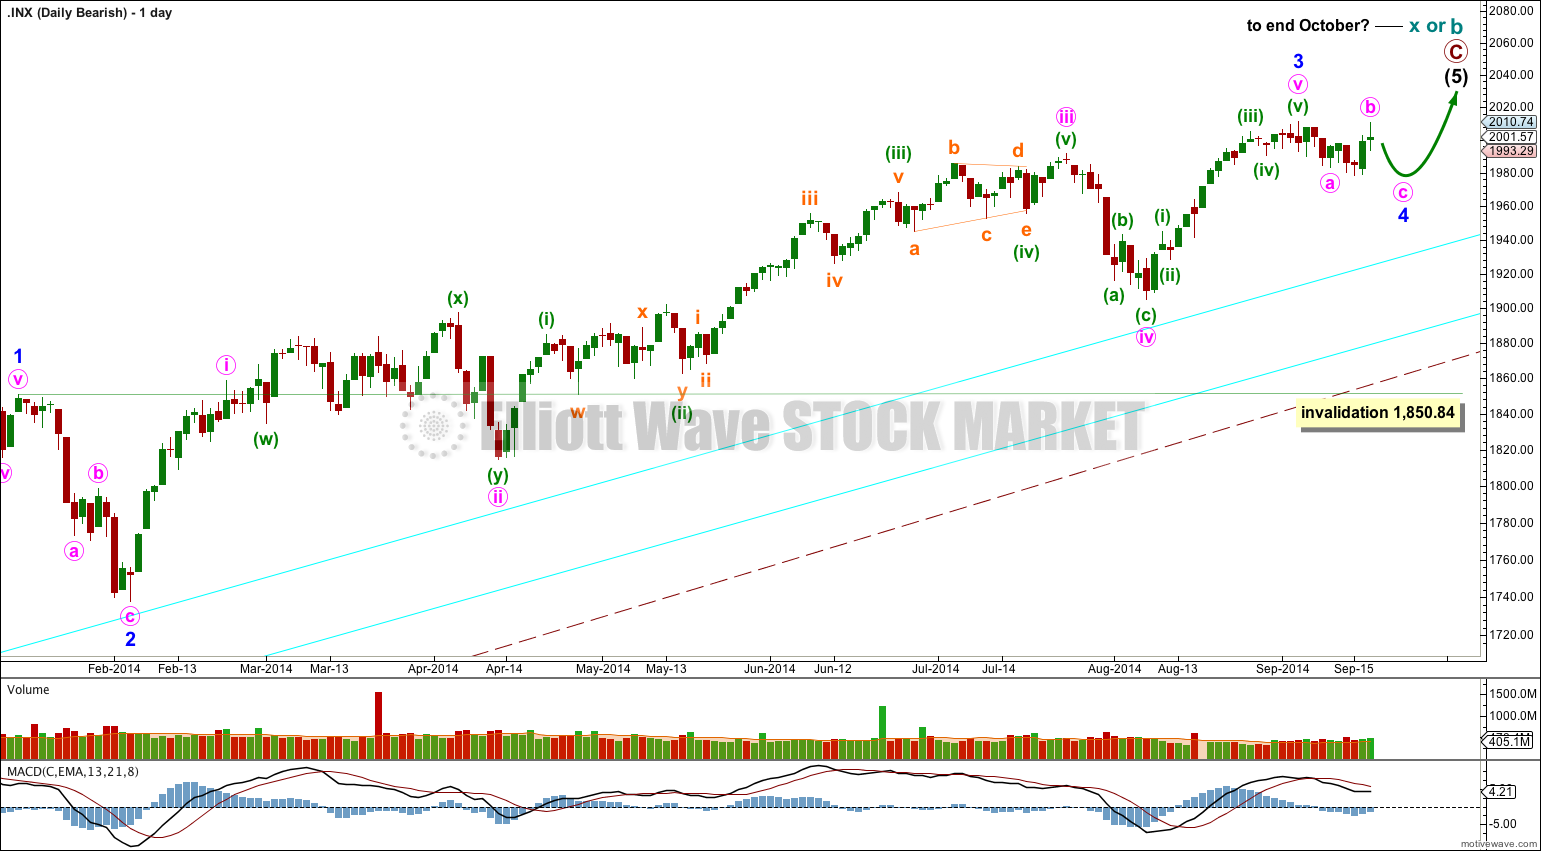
This bearish alternate wave count expects that the correction is not over. The flat correction which ended at 666.79 was only cycle wave a (or w) of a larger super cycle second wave correction.
The structure and subdivisions within primary wave C for the bear wave count are the same as for intermediate wave (1) for the bull wave count. Thus the short to mid term outlook is identical.
The differentiation between the bull and bear wave count is the maroon – – – channel. The bull wave count should see price remain above the lower maroon – – – trend line. The bear wave count requires a clear breach of this trend line. If this trend line is breached by a full weekly candlestick below it and not touching it then this bear wave count would be my main wave count and I would then calculate downwards targets.
We should always assume the trend remains the same until proven otherwise; the trend is your friend. While price remains above the lower maroon – – – trend line I will assume that the S&P 500 remains within a bull market.
This analysis is published about 08:01 p.m. EST.