
Price moved lower during Friday’s session to complete a very small red candlestick. This was one of the two fourth wave corrections I was expecting, which turned a few days earlier than expected.
Summary: I expect the resumption of the upwards trend on Monday. When price reaches the upper green trend line on the daily chart, about 2,025, there may be another reasonably sized fourth wave correction, or a quicker second wave correction. If it does not begin there the next target is 2,069 – 2,082.
Click on charts to enlarge.
The aqua blue trend lines are critical. Draw the first trend line from the low of 1,158.66 on 25th November, 2011, to the next swing low at 1,266.74 on 4th June, 2012. Create a parallel copy and place it on the low at 1,560.33 on 24th June, 2013. While price remains above the lower of these two aqua blue trend lines we must assume the trend remains upwards. This is the main reason for the bullish wave count being my main wave count.
Bullish Wave Count.
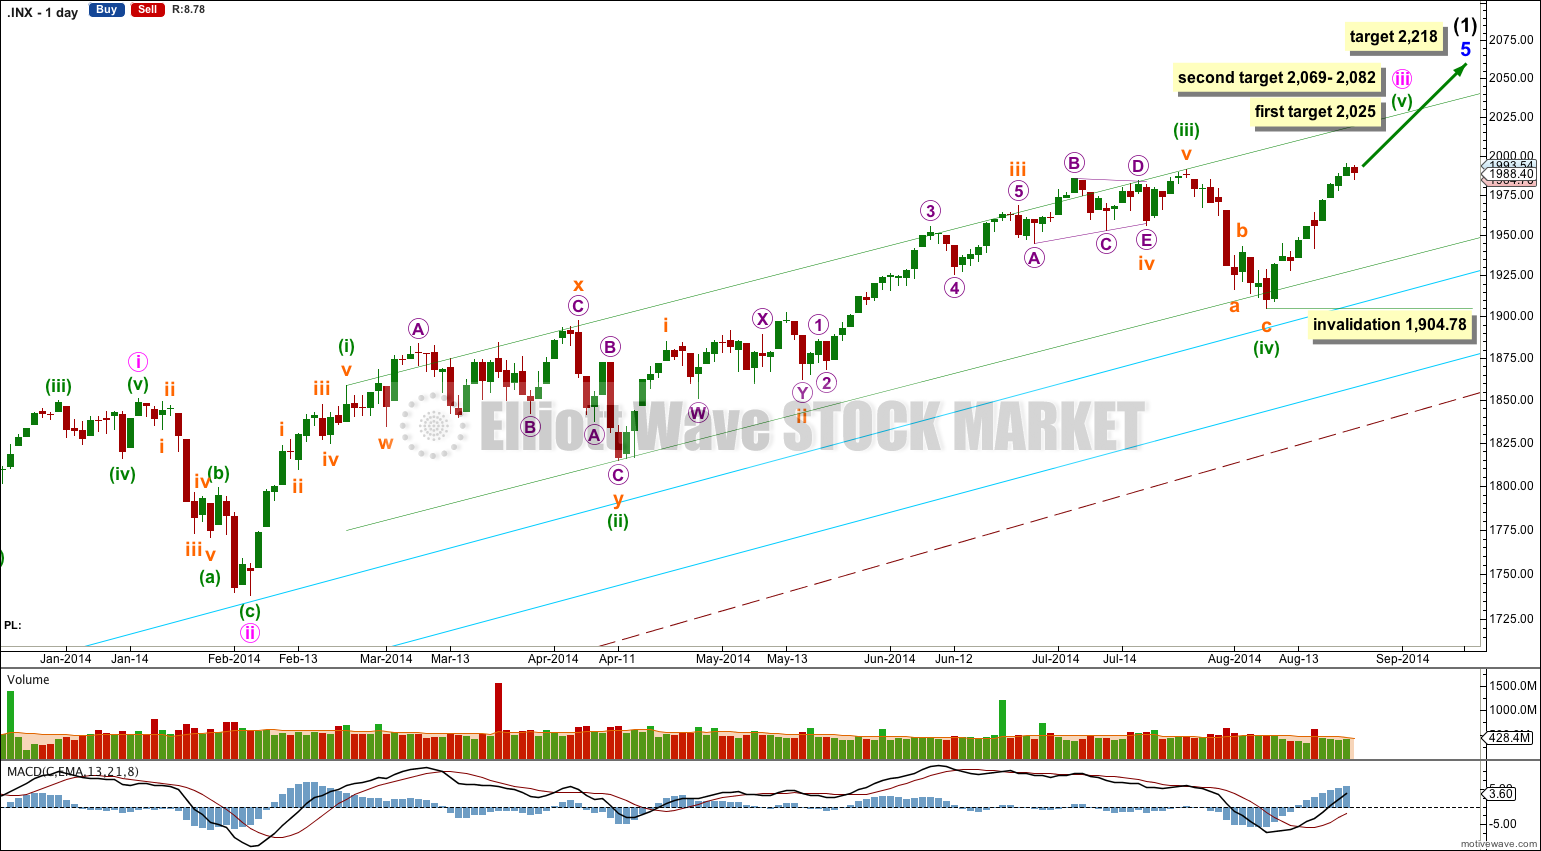
There are a couple of things about this wave count of which I am confident. I see minor wave 3 within intermediate wave (1) as over at 1,729.86 (19th September, 2013). It has the strongest upwards momentum and is just 0.76 longer than 2.618 the length of minor wave 1. At 455 days duration this is a remarkably close Fibonacci ratio. The subdivisions within it are perfect. If this is correct then minor wave 4 ends at 1,646.47 and this is where minor wave 5 begins.
Minor wave 5 is unfolding as an impulse. If minor wave 5 has passed its middle then I would expect to see more divergence between price and MACD develop over coming weeks.
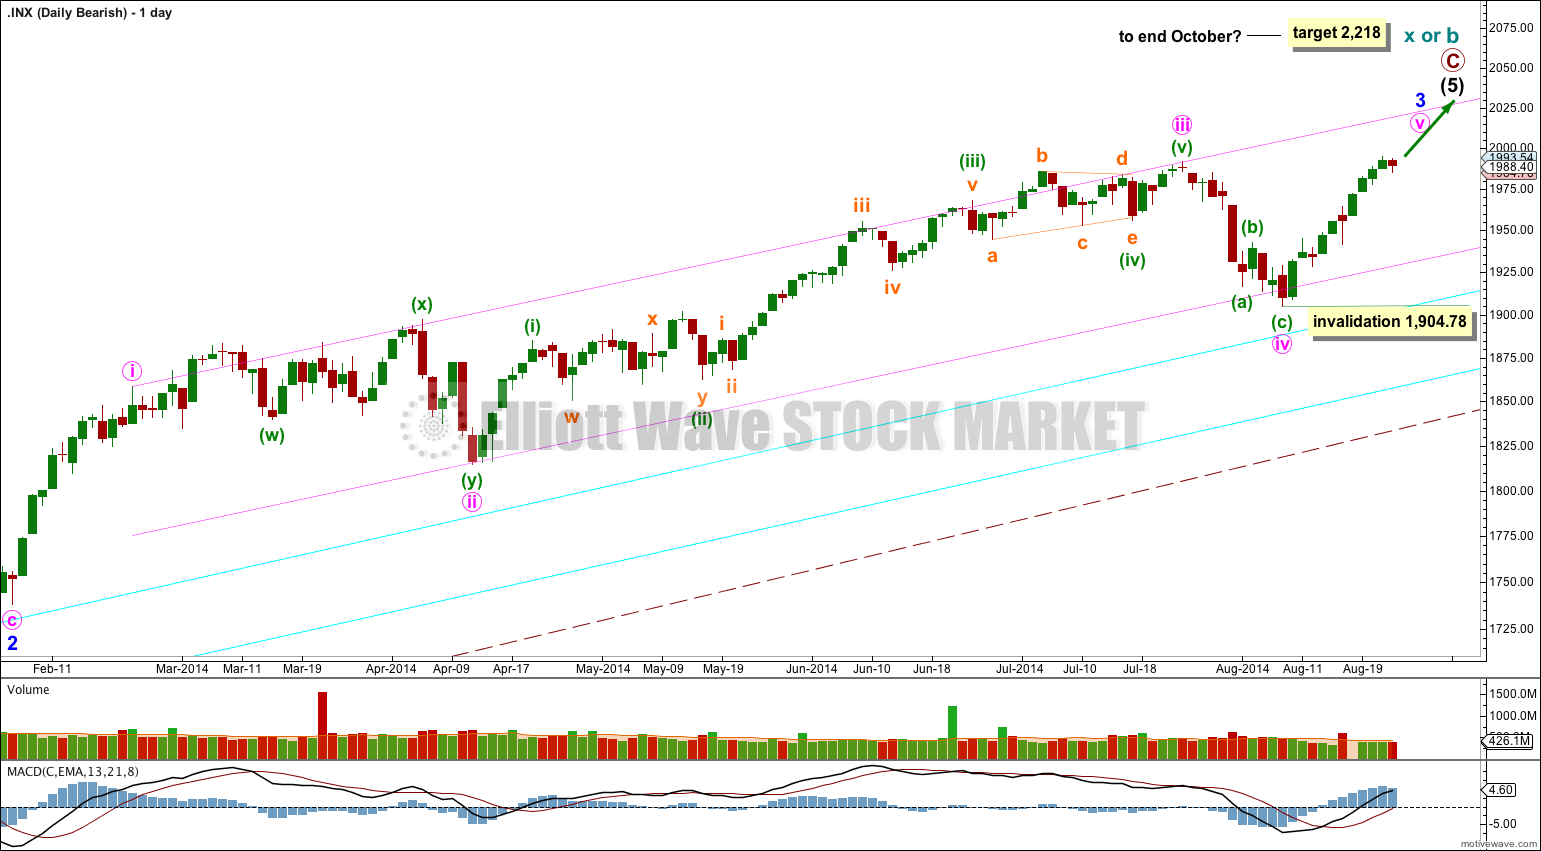
Along the way up towards the final target I would expect one more correction complete for minute wave iv.
Within minuette wave (v) no second wave correction may move beyond the start of its first wave below 1,904.78.
Within minute wave iii there is no adequate Fibonacci ratio between minuette waves (iii) and (i). This makes it more likely that minuette wave (v) would exhibit a Fiboancci ratio to either of minuette waves (i) or (iii). At 2,025 minuette wave (v) would reach equality in length with minuette wave (i). As this is the most common relationship between first and fifth waves this should be the first expectation.
If price keeps rising through the first target, or it gets there and the structure is incomplete, then I will move the expectation to the next target.
At 2,069 minute wave iii would reach 1.618 the length of minute wave i. At 2,082 minuette wave (v) would reach equality in length with minuette wave (iii). This gives a 13 point target zone which can be narrowed when it can be calculated at a third wave degree towards the end of the movement.
At 2,218 minor wave 5 would reach equality in length with minor wave 3. This target may be met in October.
I have drawn a parallel channel about minute wave iii using Elliott’s first technique: draw the first trend line from the highs of minuette waves (i) to (iii), then place a parallel copy on the low of minuette wave (ii). Minuette wave (iv) slightly breaches the lower edge of this channel, and fits within the channel. Minuette wave (v) may end about the upper edge of this channel.
The large maroon – – – channel is copied over from the weekly chart. It is drawn in exactly the same way on bull and bear wave counts. For the bull wave count this channel is termed a base channel about primary waves 1 and 2. A lower degree second wave should not breach the lower edge of a base channel drawn about a first and second wave one or more degrees higher. The lower maroon – – – trend line differentiates the bull and bear wave counts at cycle degree and monthly chart level.
Main Hourly Wave Count.
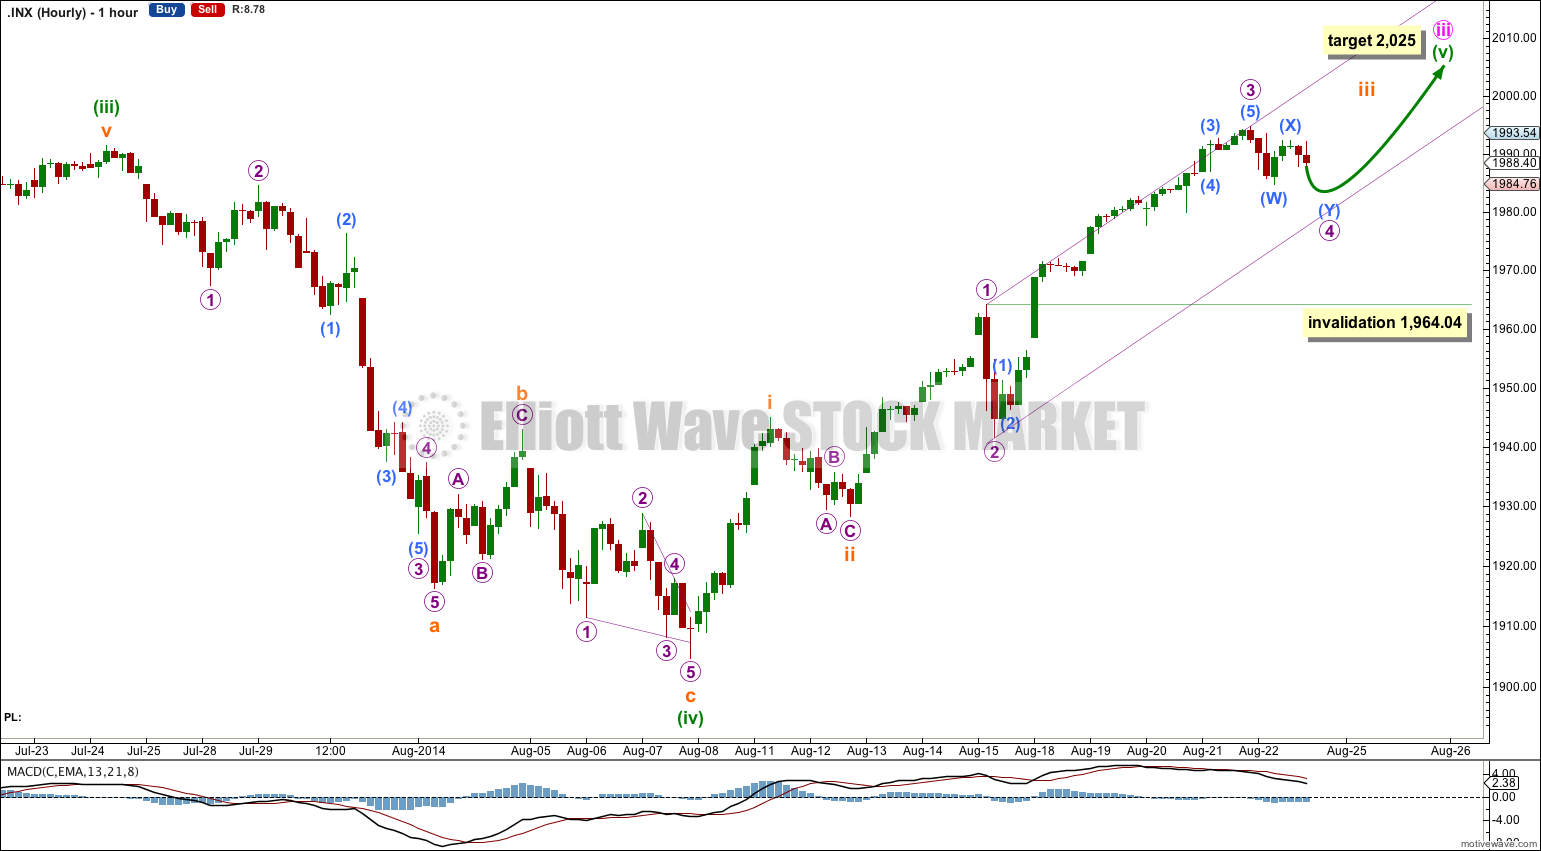
A small fourth wave correction arrived on Friday, earlier than expected. It is most likely incomplete, and should end early on Monday. I would expect a green candlestick for Monday’s session.
Micro wave 3 is 4.58 short of 1.618 the length of micro wave 1.
Micro wave 2 was a relatively deep 63% zigzag, and micro wave 4 is showing alternation as a double combination. The second structure in the double is almost complete and should move slightly lower to begin Monday’s session. Thereafter, upwards movement should resume.
I have drawn a channel about micro wave 3 using Elliott’s first technique: draw the first trend line from the highs of micro waves 1 to 3, then place a parallel copy on the low labeled micro wave 2. I would expect micro wave 4 to find support if it reached down that far.
Micro wave 4 may not move into micro wave 1 price territory below 1,964.04.
This degree of labeling is moved down one degree from last analysis. This degree of labeling would see minuette wave (v) in its entirety close to an end with the target at 2,025.
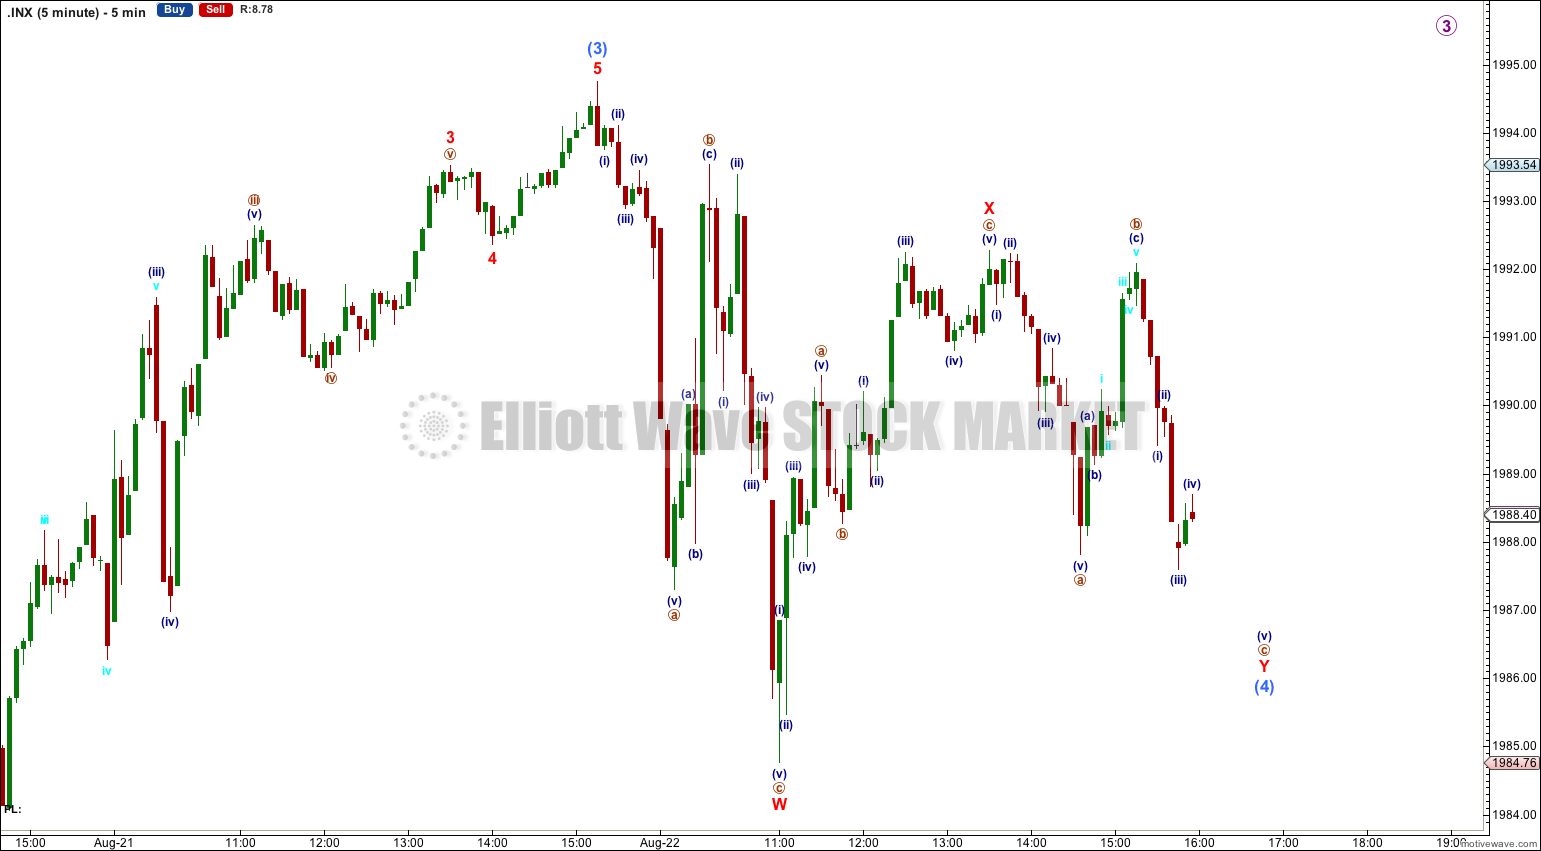
* The labeling on the five minute chart also fits the alternate below.
Alternate Hourly Wave Count.
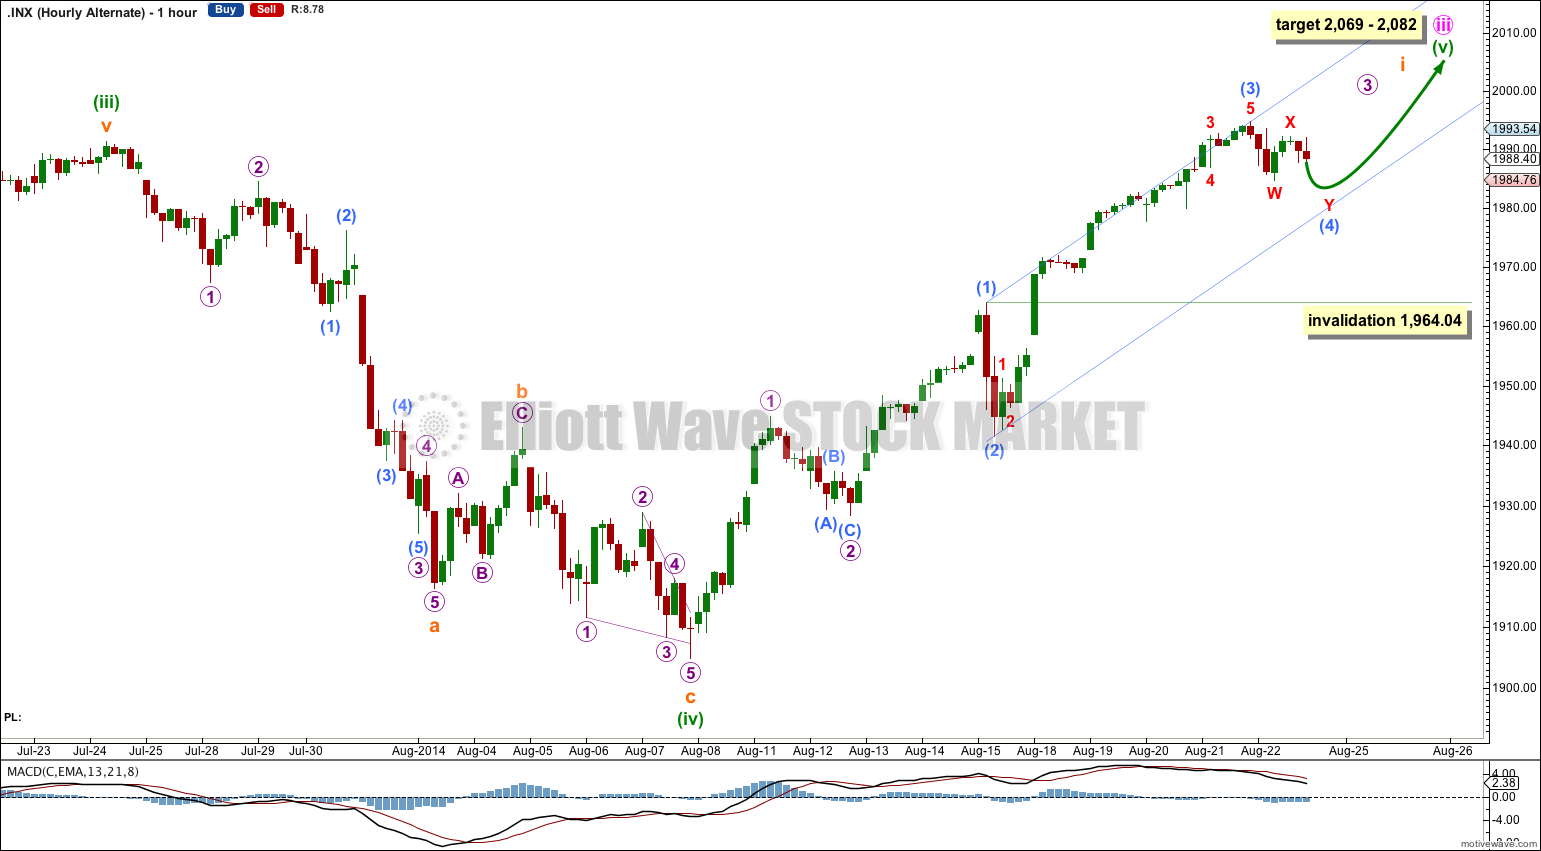
This hourly alternate chart follows on directly from last analysis, and is identical to the main hourly wave count except here the degree of labeling is moved down one degree.
This alternate labeling fits the second target better, and expects that minuette wave (v) will be extended reaching equality (about) with the extended minuette wave (iii).
Both degrees of labeling are equally valid.
Bearish Alternate Wave Count
This bearish alternate wave count expects that the correction is not over. The flat correction which ended at 666.79 was only cycle wave a (or w) of a larger super cycle second wave correction.
The structure and subdivisions within primary wave C for the bear wave count are the same as for intermediate wave (1) for the bull wave count. Thus the short to mid term outlook is identical.
The differentiation between the bull and bear wave count is the maroon – – – channel. The bull wave count should see price remain above the lower maroon – – – trend line. The bear wave count requires a clear breach of this trend line. If this trend line is breached by a full weekly candlestick below it and not touching it then this bear wave count would be my main wave count and I would then calculate downwards targets.
We should always assume the trend remains the same until proven otherwise; the trend is your friend. While price remains above the lower maroon – – – trend line I will assume that the S&P 500 remains within a bull market.
This analysis is published about 10:33 p.m. EST.