
Price moved higher fitting yesterday’s alternate wave count better, but not quite enough for confirmation.
When looking at the daily charts for the “right look” and trend lines, I decided to swap over the main and alternate Elliott wave counts.
Summary: We may not have clarity for another couple of days. Tomorrow may see a little downwards movement for a small fourth wave correction. Once that is done I expect to see new highs.
Click on charts to enlarge.
The aqua blue trend lines are critical. Draw the first trend line from the low of 1,158.66 on 25th November, 2011, to the next swing low at 1,266.74 on 4th June, 2012. Create a parallel copy and place it on the low at 1,560.33 on 24th June, 2013. While price remains above the lower of these two aqua blue trend lines we must assume the trend remains upwards. This is the main reason for the bullish wave count being my main wave count.
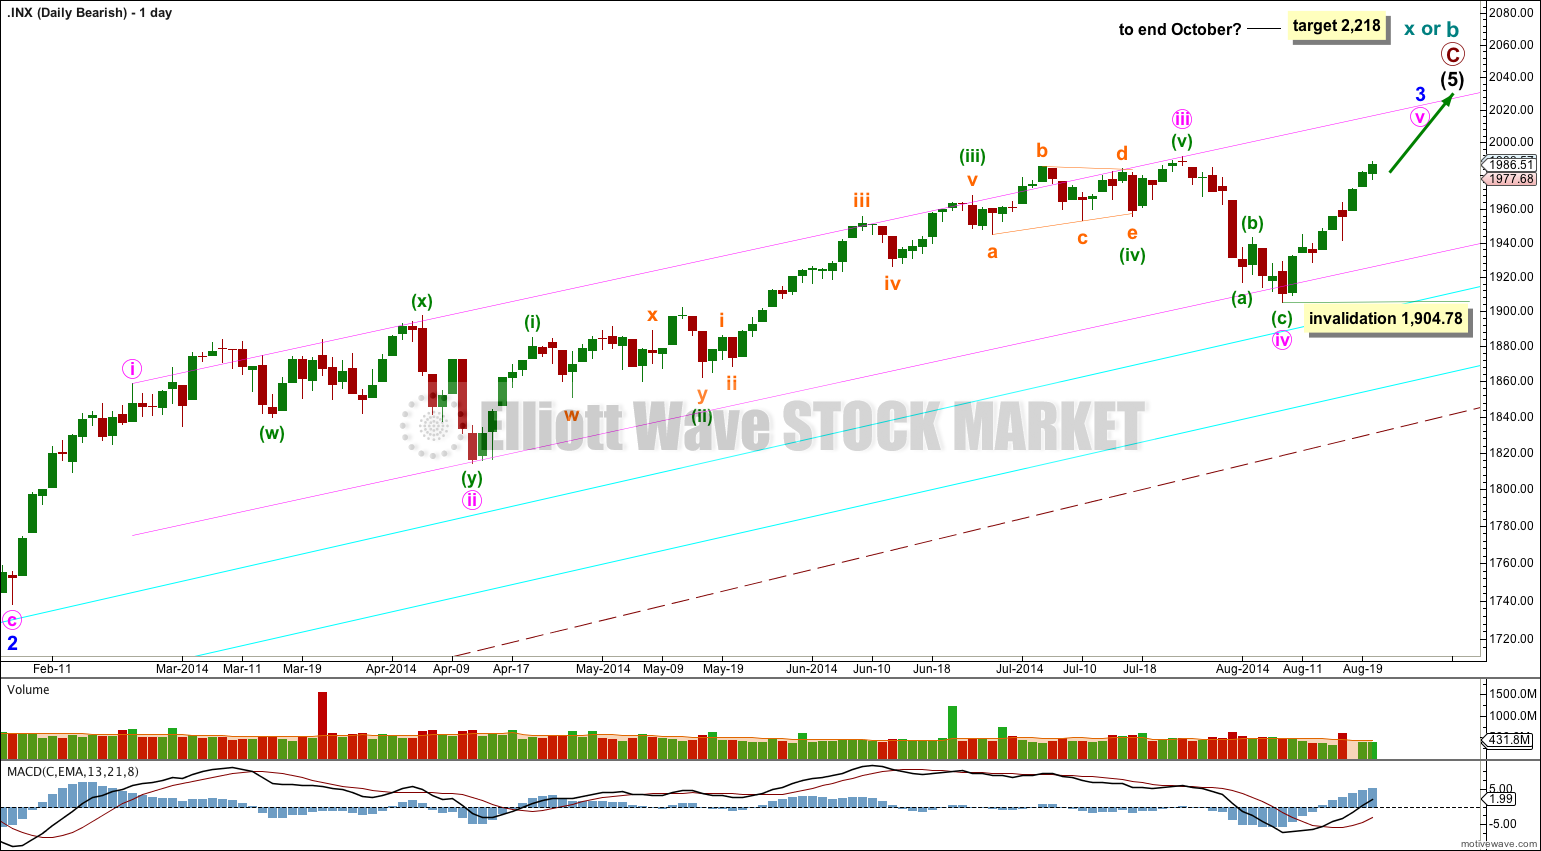
Bullish Wave Count.
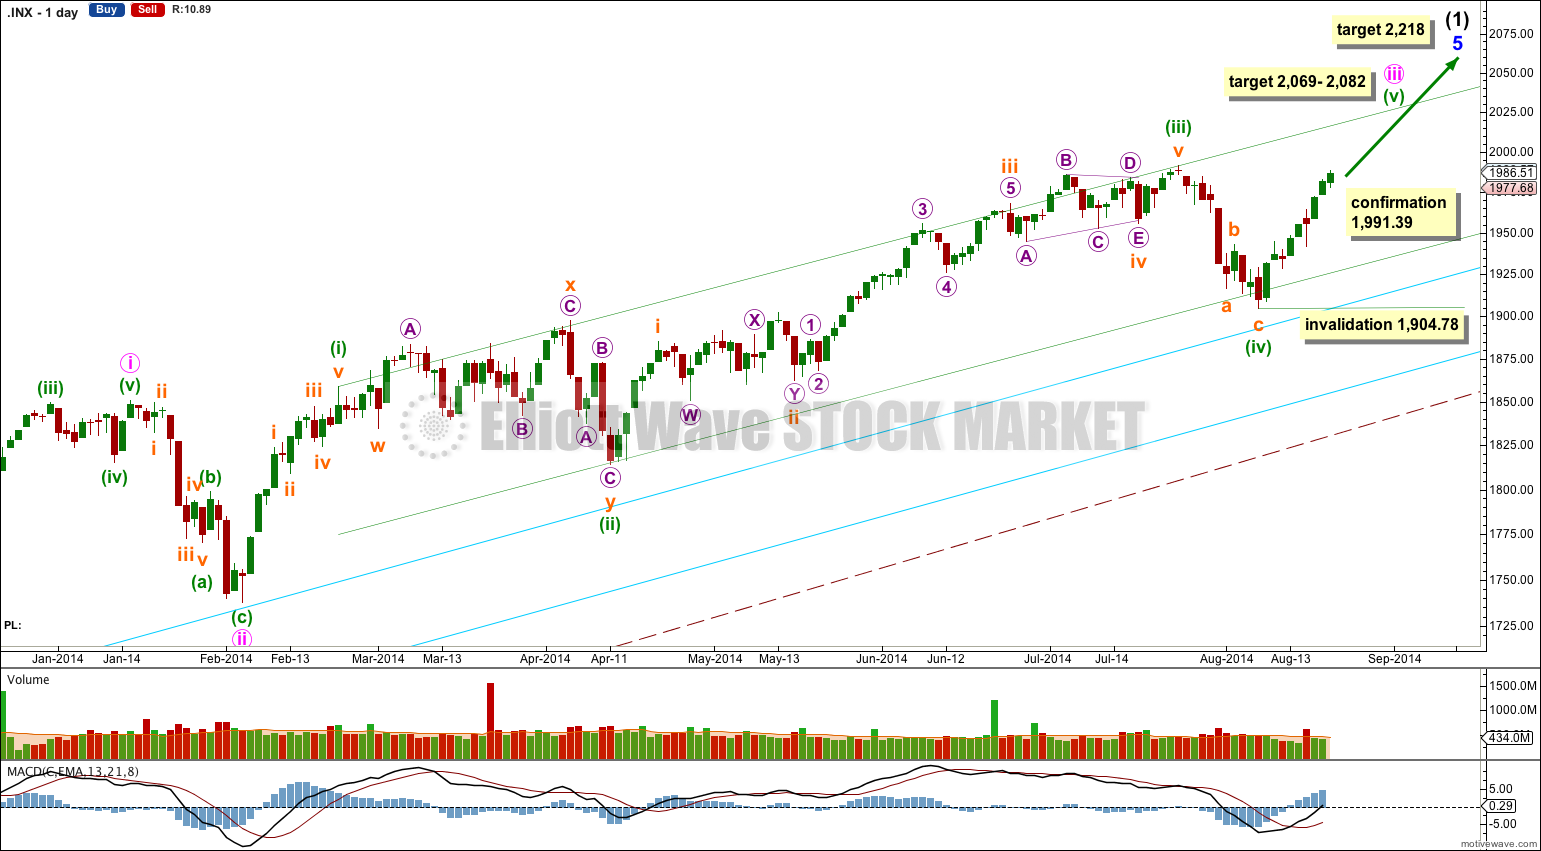
There are a couple of things about this wave count of which I am confident. I see minor wave 3 within intermediate wave (1) as over at 1,729.86 (19th September, 2013). It has the strongest upwards momentum and is just 0.76 longer than 2.618 the length of minor wave 1. At 455 days duration this is a remarkably close Fibonacci ratio. The subdivisions within it are perfect. If this is correct then minor wave 4 ends at 1,646.47 and this is where minor wave 5 begins.
Minor wave 5 is unfolding as an impulse. If minor wave 5 has passed its middle then I would expect to see more divergence between price and MACD develop over coming weeks.
Along the way up towards the final target I would expect one more correction complete for minute wave iv.
Within minuette wave (v) no second wave correction may move beyond the start of its first wave below 1,904.78.
Within minor wave 5 at 2,069 minute wave iii would reach 1.618 the length of minute wave i. At 2,082 minuette wave (v) would reach equality in length with minuette wave (iii). This gives a 13 point target zone which can be narrowed when it can be calculated at a third wave degree towards the end of the movement.
At 2,218 minor wave 5 would reach equality in length with minor wave 3. This target may be met in October.
I have drawn a parallel channel about minute wave iii using Elliott’s first technique: draw the first trend line from the highs of minuette waves (i) to (iii), then place a parallel copy on the low of minuette wave (ii). Minuette wave (iv) slightly breaches the lower edge of this channel, and fits within the channel. Minuette wave (v) may end about the upper edge of this channel.
The large maroon – – – channel is copied over from the weekly chart. It is drawn in exactly the same way on bull and bear wave counts. For the bull wave count this channel is termed a base channel about primary waves 1 and 2. A lower degree second wave should not breach the lower edge of a base channel drawn about a first and second wave one or more degrees higher. The lower maroon – – – trend line differentiates the bull and bear wave counts at cycle degree and monthly chart level.
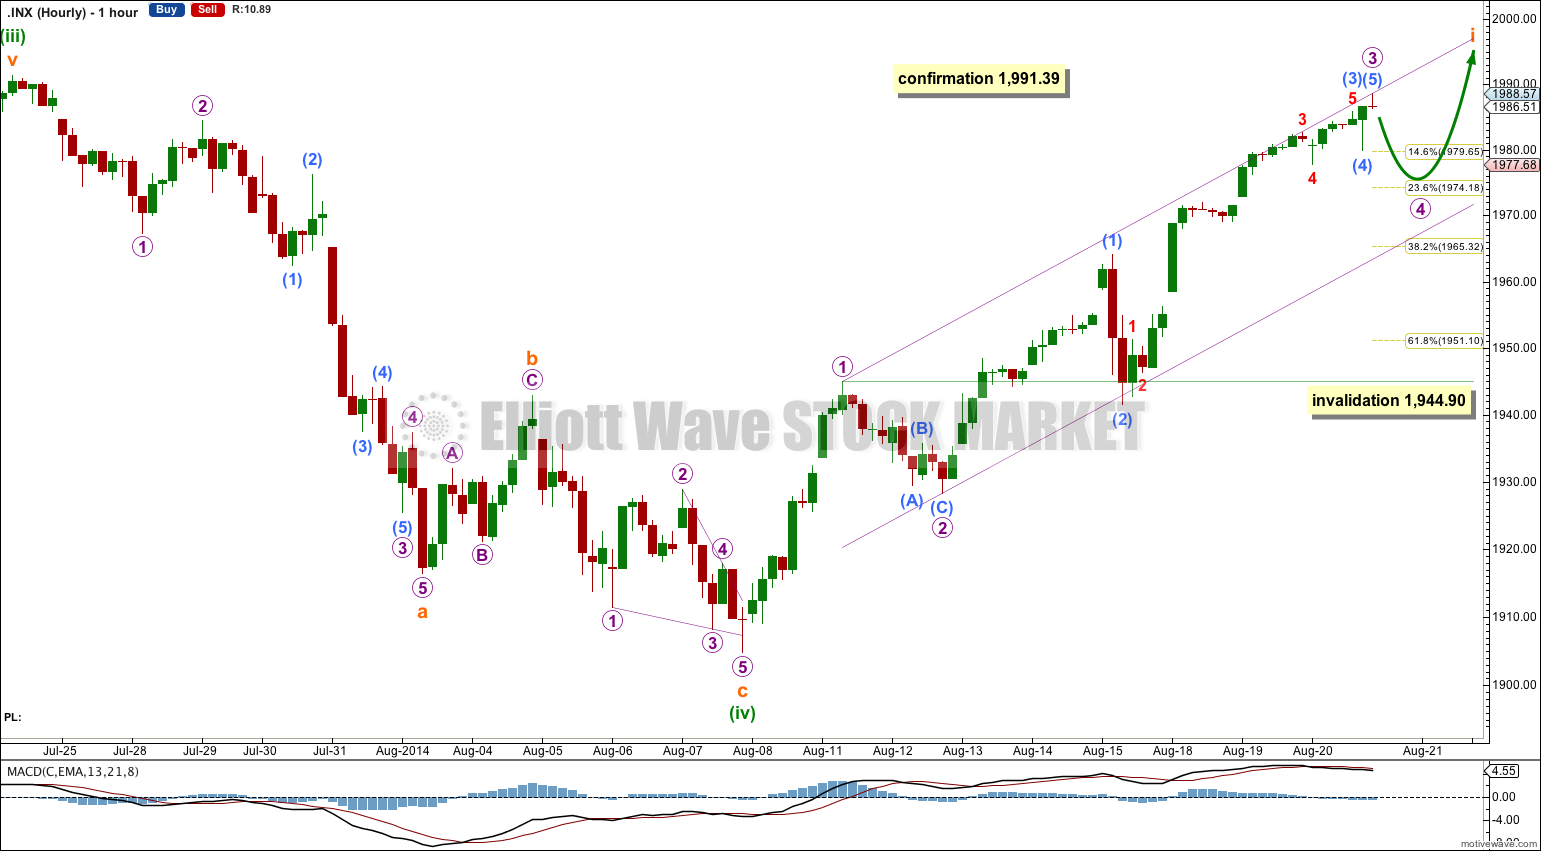
Within minuette wave (v) I would expect to see subminuette wave ii show up on the daily chart. Because it has not yet shown, I expect subminuette wave i is incomplete.
Within subminuette wave i micro wave 3 may have ended on Wednesday. Micro wave 4 may be a very shallow sideways moving flat, combination or triangle. It may show on the daily chart as a red candlestick because micro wave 2 shows clearly on the daily chart. Micro wave 2 was a relatively shallow 41% zigzag.
Micro wave 4 may not move into micro wave 1 price territory below 1,944.90.
If it moves down low enough it may find support at the lower edge of the channel drawn here using Elliott’s first technique.
Alternate Wave Count.
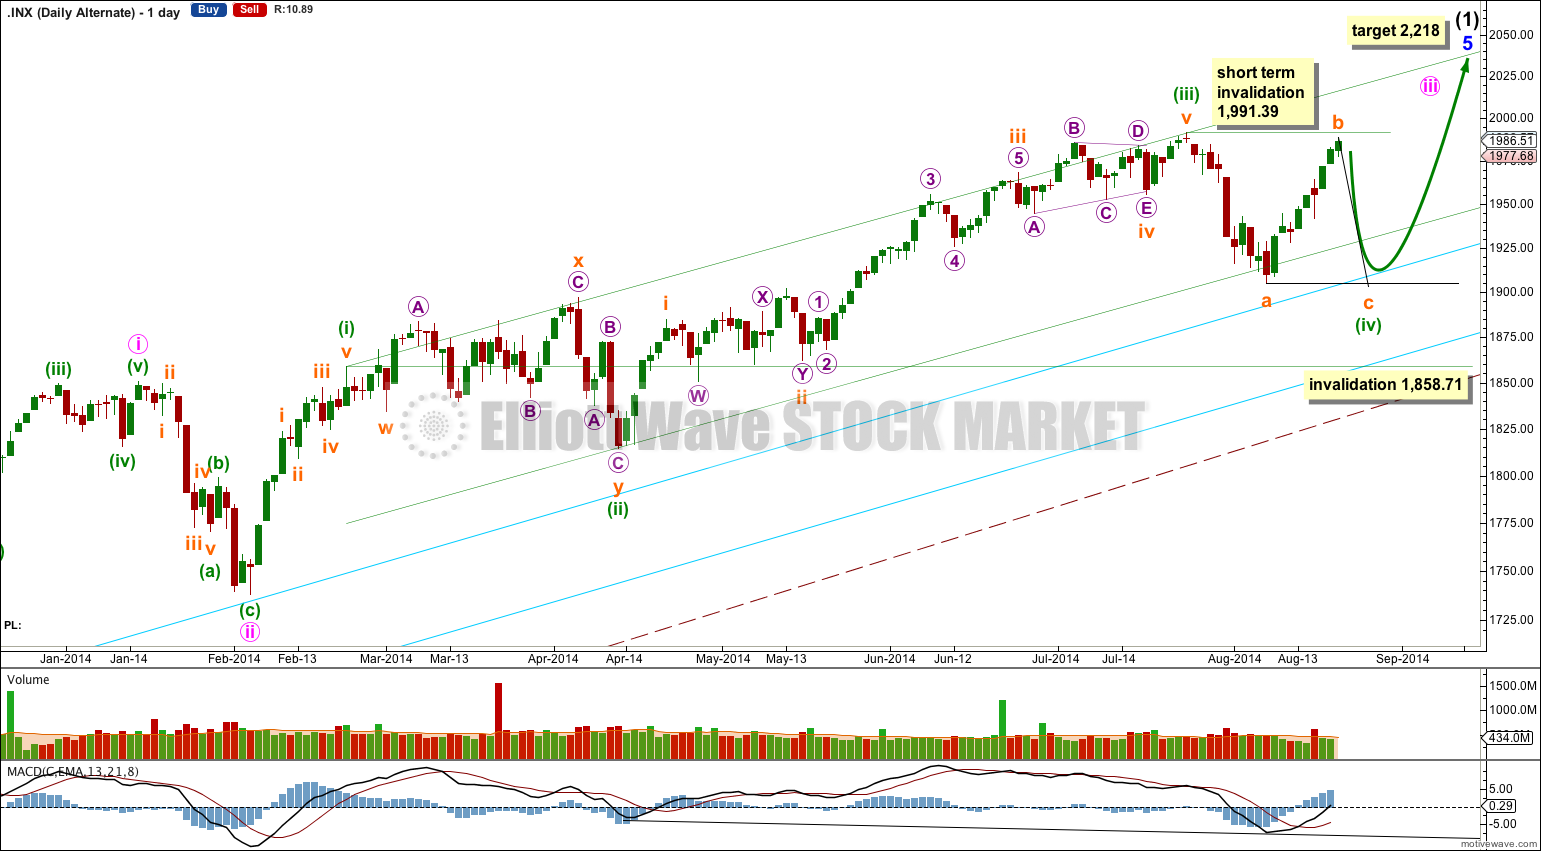
For the following reasons I am reducing the probability of this wave count to an alternate today:
– Subminuette wave b is so slow moving it has taken price sideways enough to mean that subminuette wave c cannot easily move below the end of subminuette wave a to avoid a truncation, and at the same time not breach the upper aqua blue trend line.
– If subminuette wave c is to move below 1,904.78 to avoid a truncation then it must begin tomorrow, must be very swift and sharp, and can only last a total of three days.
– This would still see the upper aqua blue trend line slightly breached, and because it has not been breached at all in over a year I do not expect it to be breached until we see a major trend change.
Minuette wave (ii) was a shallow sideways combination lasting a Fibonacci 34 days. I would expect minuette wave (iv) to show structural alternation and be a zigzag. A flat correction would still technically be possible, but because that would too require a clear breach of the upper aqua blue trend line I will not consider it. Also, a flat correction would not show enough structural alternation.
Only if price exhibits extremely swift downwards movement tomorrow and then breaks below 1,944.90 would I at this stage consider this alternate wave count as very likely again.
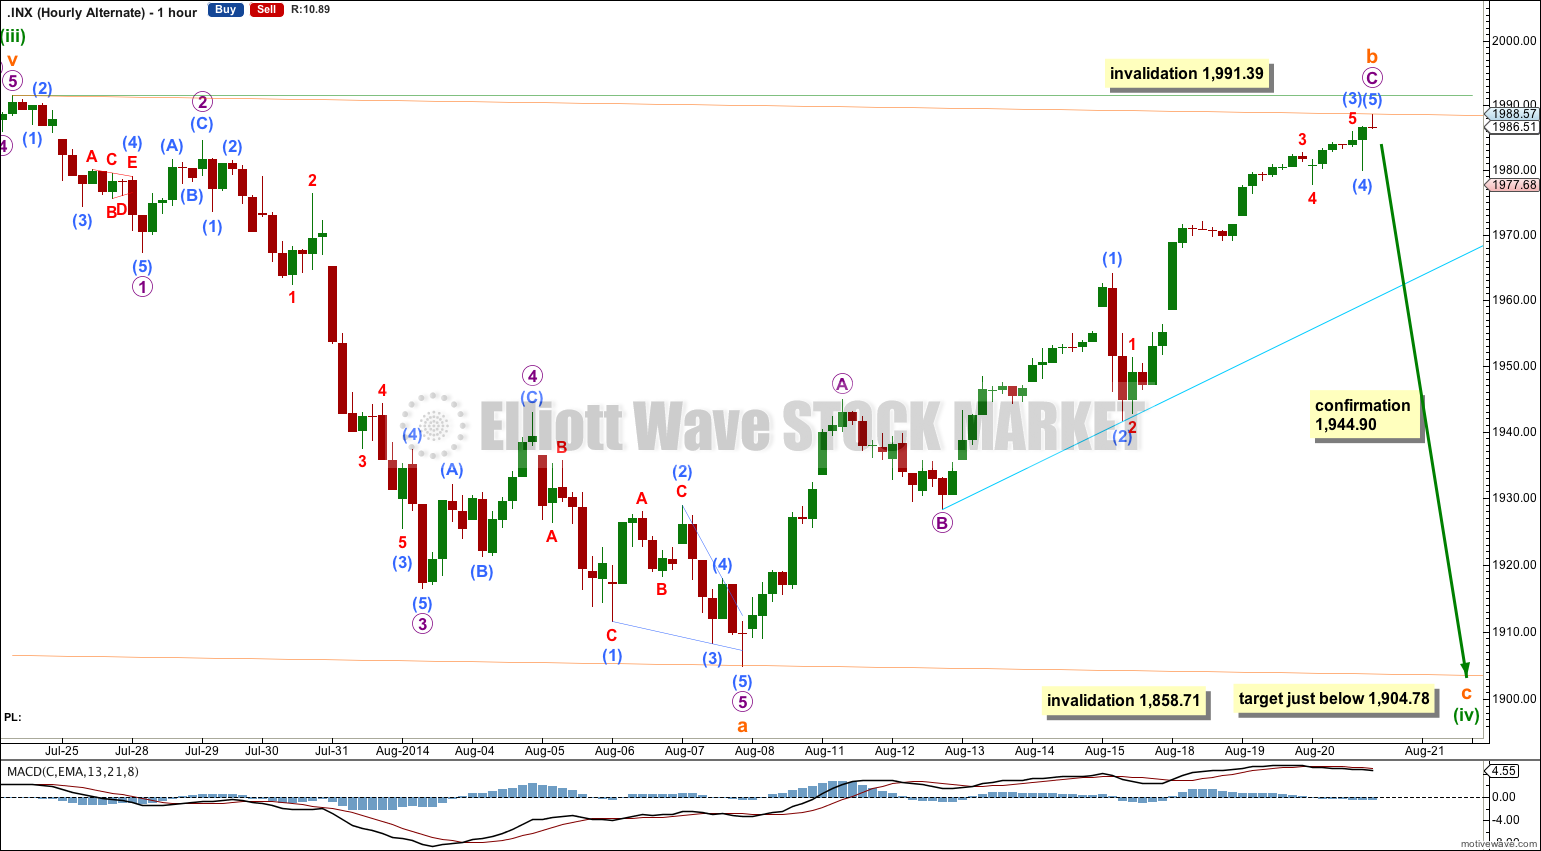
Subminuette wave b cannot move much higher at all. It may not move beyond the start of subminuette wave a above 1,991.39.
This wave count requires the aqua blue trend line on this hourly chart to be breached tomorrow for it to remain a possibility. Thereafter, a new low below 1,944.90 would confirm it.
Minuette wave (iv) may not move into minuette wave (i) price territory below 1,858.71.
Subminuette wave c should move at least slightly below the end of subminuette wave a at 1,904.78 to avoid a truncation.
Bearish Alternate Wave Count
This bearish alternate wave count expects that the correction is not over. The flat correction which ended at 666.79 was only cycle wave a (or w) of a larger super cycle second wave correction.
The structure and subdivisions within primary wave C for the bear wave count are the same as for intermediate wave (1) for the bull wave count. Thus the short to mid term outlook is identical.
The differentiation between the bull and bear wave count is the maroon – – – channel. The bull wave count should see price remain above the lower maroon – – – trend line. The bear wave count requires a clear breach of this trend line. If this trend line is breached by a full weekly candlestick below it and not touching it then this bear wave count would be my main wave count and I would then calculate downwards targets.
We should always assume the trend remains the same until proven otherwise; the trend is your friend. While price remains above the lower maroon – – – trend line I will assume that the S&P 500 remains within a bull market.
This analysis is published about 10:38 p.m. EST.