
Yesterday’s Elliott wave analysis expected downwards movement for Tuesday’s session which is exactly what happened. Tuesday has closed with a small red candlestick on the daily chart.
Summary: I expect downwards movement for another two days. Look for downwards movement to find strong support at the upper of the two aqua blue trend lines on the daily chart, and this trend line may be where downwards movement ends. The upper aqua blue trend line may be a better guide to when and where downwards movement may end than the target. If the target at 1,895 is met the upper aqua blue trend line would be slightly overshot, but I think that is unlikely.
Click on charts to enlarge.
The aqua blue trend lines are critical. Draw the first trend line from the low of 1,158.66 on 25th November, 2011 to the next swing low at 1,266.74 on 4th June, 2012. Create a parallel copy and place it on the low at 1,560.33 on 24th June, 2013. While price remains above the lower of these two aqua blue trend lines we must assume the trend remains upwards. This is the main reason for the bullish wave count being my main wave count.
Bullish Wave Count.
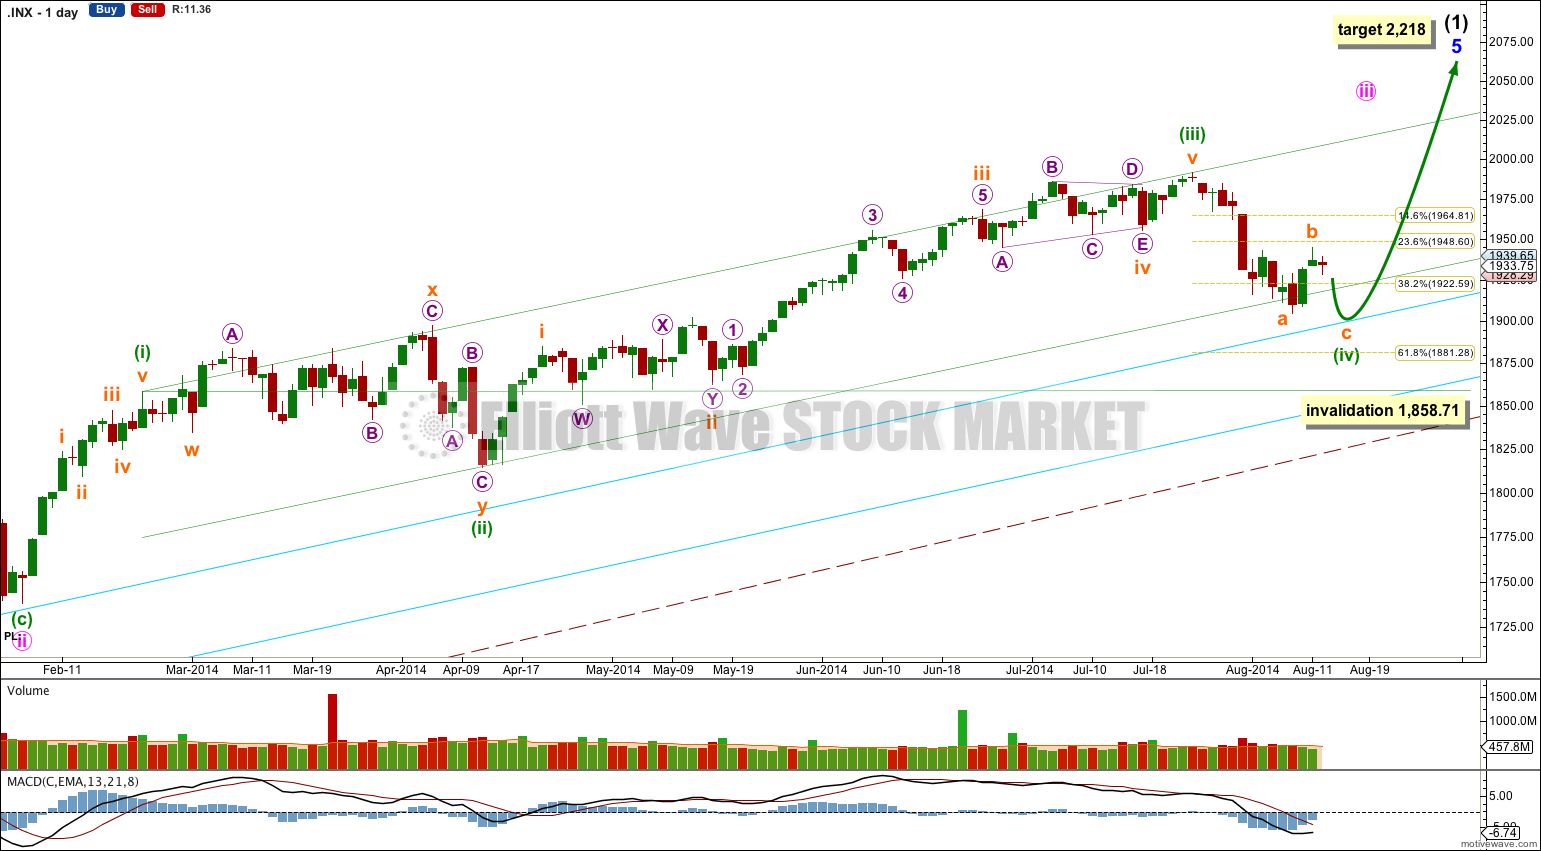
There are a couple of things about this wave count of which I am confident. I see minor wave 3 within intermediate wave (1) as over at 1,729.86 (19th September, 2013). It has the strongest upwards momentum and is just 0.76 longer than 2.618 the length of minor wave 1. At 455 days duration this is a remarkably close Fibonacci ratio. The subdivisions within it are perfect. If this is correct then minor wave 4 ends at 1,646.47 and this is where minor wave 5 begins.
Minor wave 5 is unfolding as an impulse. If minor wave 5 has passed its middle then I would expect to see more divergence between price and MACD develop over coming weeks.
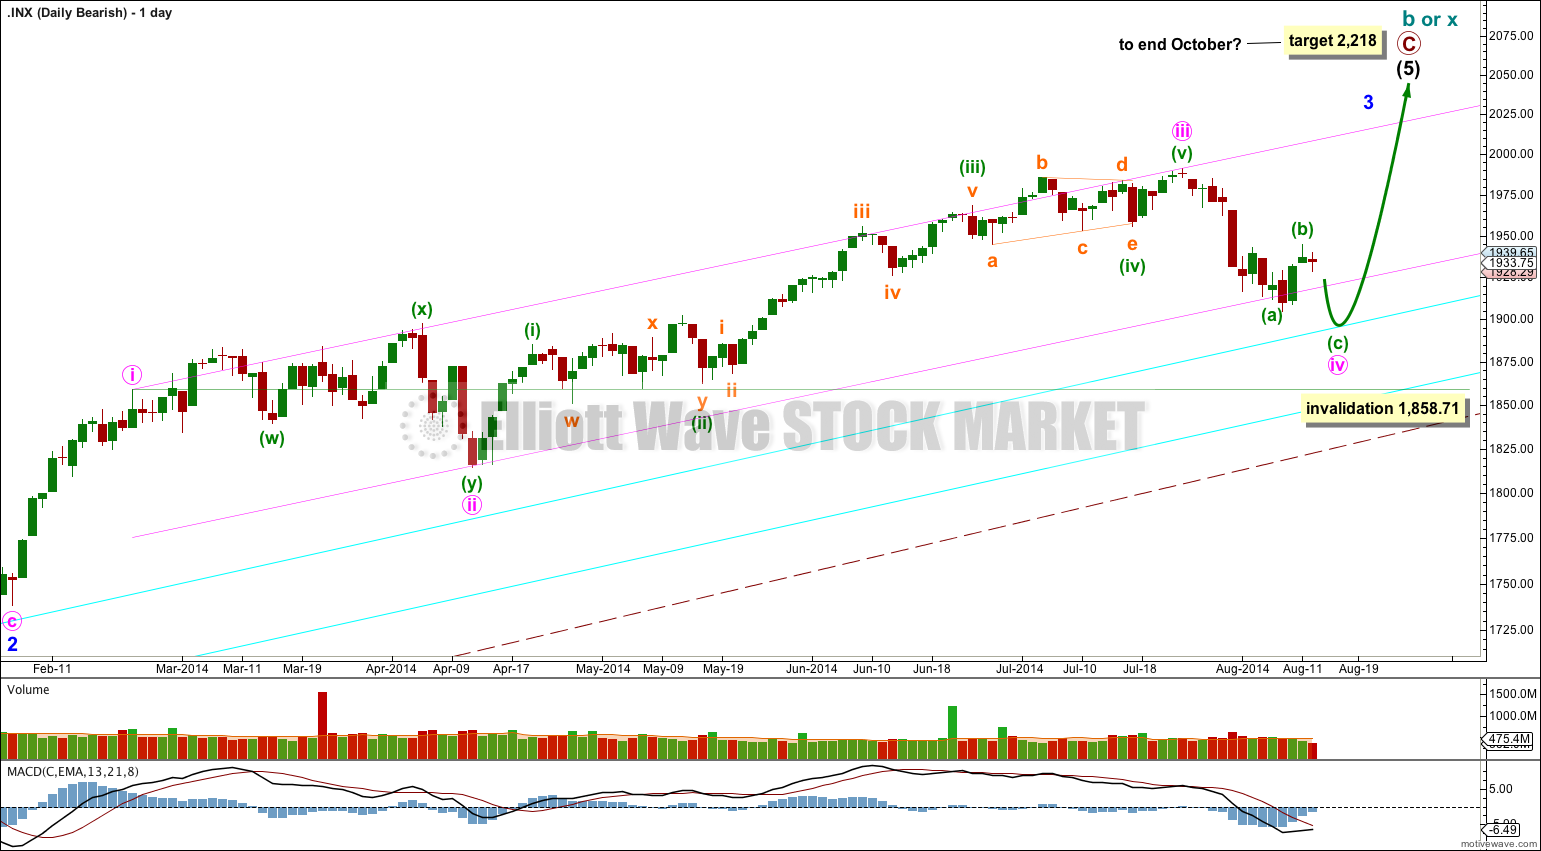
Along the way up towards the final target I would expect to see two more corrections complete: the current correction for minuette wave (iv) and one more for minute wave iv.
Minuette wave (iv) may not move into minuette wave (i) price territory below 1,858.71.
At 2,218 minor wave 5 would reach equality in length with minor wave 3. This target may be met in October.
I have drawn a parallel channel about minute wave iii using Elliott’s first technique: draw the first trend line from the highs of minuette waves (i) to (iii), then place a parallel copy on the low of minuette wave (ii). Minuette wave (iv) so far slightly breaches the lower edge of this channel, and at its end I expect another small breach. This may indicate an overthrow of the channel on the opposite side for the upcoming fifth wave.
Minuette wave (iv) may reach as low as the 0.618 Fibonacci ratio of minuette wave (iii) at 1,881.28, which would provide alternation in depth of correction between minuette waves (ii) and (iv), (minuette wave (ii) was a shallow 37% correction). Downwards movement may find final support about the upper aqua blue trend line, continuing a pattern which has lasted about a year now. If the upper aqua blue trend line is overshot by downwards movement then I would expect price to find support at the lower aqua blue trend line, although it may not get that low.
The large maroon – – – channel is copied over from the weekly chart. It is drawn in exactly the same way on bull and bear wave counts. For the bull wave count this channel is termed a base channel about primary waves 1 and 2. A lower degree second wave should not breach the lower edge of a base channel drawn about a first and second wave one or more degrees higher. The lower maroon – – – trend line differentiates the bull and bear wave counts at cycle degree and monthly chart level.
Main Hourly Wave Count.
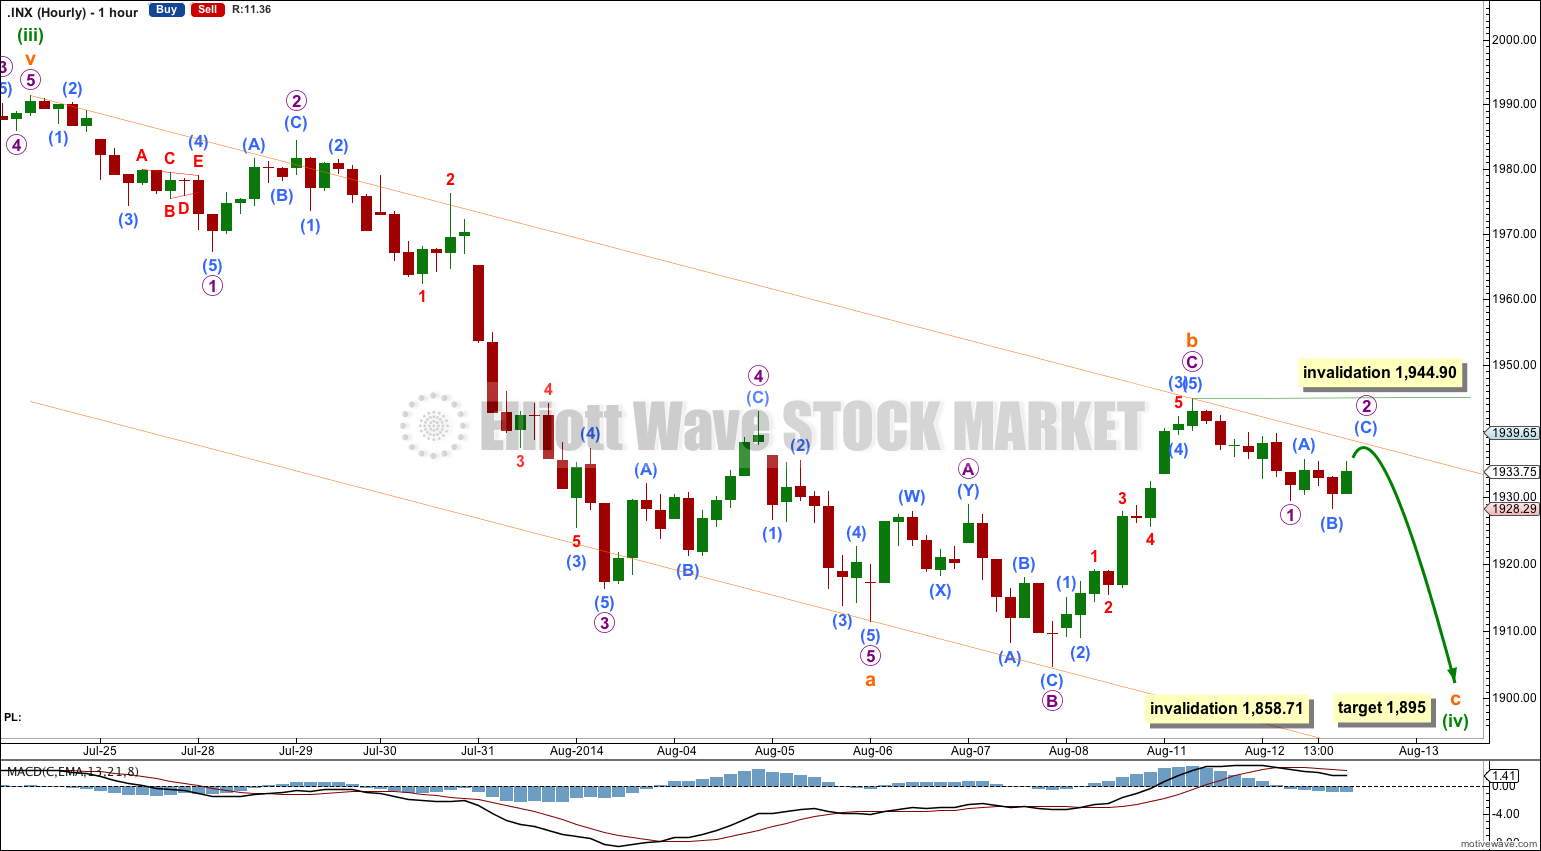
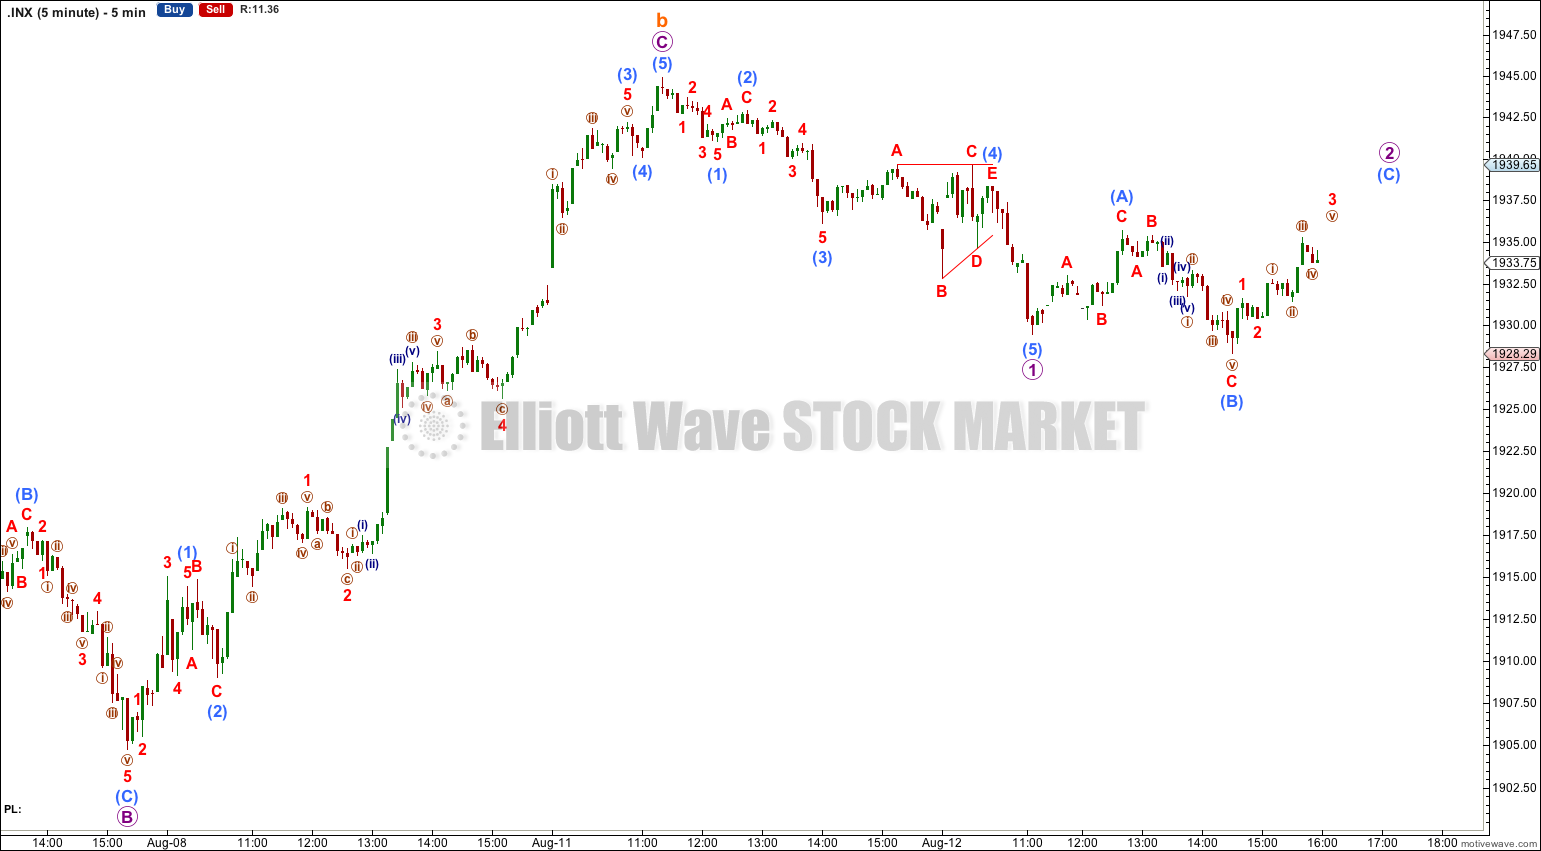
Downwards movement for Tuesday’s session may be micro wave 1 within subminuette wave c complete. Micro wave 2 looks like an incomplete expanded flat correction. Micro wave 2 should find resistance at the upper edge of the channel drawn about this zigzag of minuette wave (iv).
Draw the channel from the start of subminuette wave a to the end of subminuette wave b, then place a parallel copy on the end of subminuette wave a. Subminuette wave c may end midway within this channel.
At 1,895 subminuette wave c would reach 0.382 the length of subminuette wave a. However, this target would see the upper aqua blue trend line on the daily chart slightly overshot. The target may be too low because in the first instance I would expect the upper aqua blue trend line to provide enough support for minuette wave (iv) to end when price touches it. Subminuette wave c may not exhibit a Fibonacci ratio to subminuette wave a.
Minuette wave (iv) may not move into minuette wave (i) price territory below 1,858.71.
Alternate Hourly Wave Count.
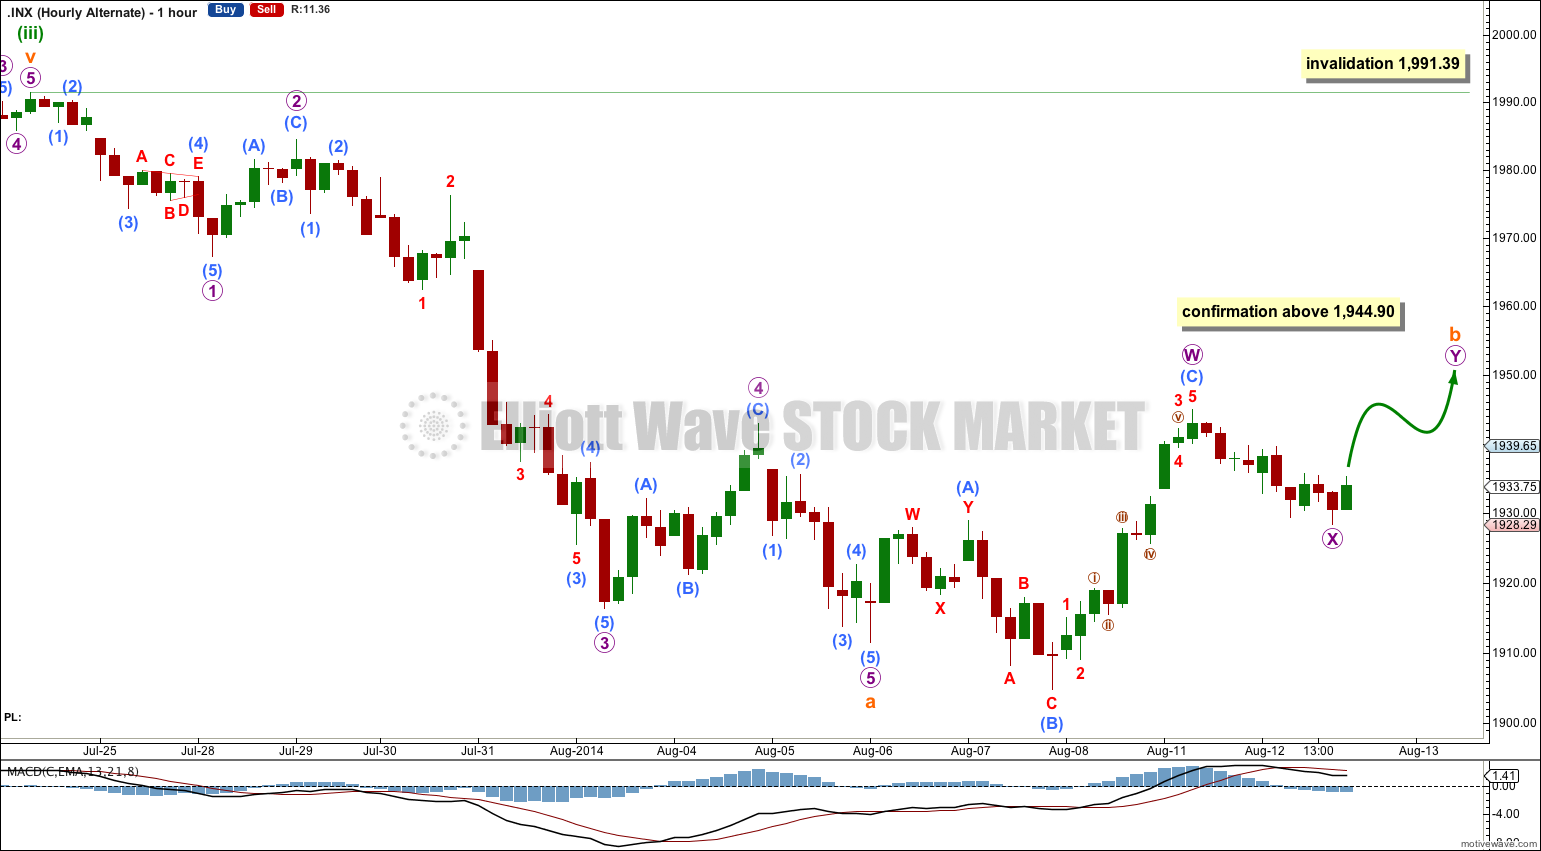
By simply moving the degree of labeling within subminuette wave b all down one degree it is possible that it is not over and could continue further sideways as a double flat or double combination.
If the main wave count is invalidated with movement above 1,944.90 this is the alternate wave count I would use. This could see minuette wave (iv) be longer lasting, and maybe it could last as long as a Fibonacci 21 days total. That would see minuette wave (iv) continue for a further eight days.
This alternate has a very low probability, maybe as low as 10%. I would only seriously consider it if it is confirmed with movement above 1,944.90.
If subminuette wave b continues then it may be either a double flat or double combination. The second structure in the double labeled minuette wave (y) may subdivide as either a flat, zigzag or triangle. A flat would be most likely.
Double combinations and double flats both have a sideways look. This alternate wave count would not expect any significant upwards movement and expects only another few days of sideways overlapping movement.
Subminuette wave b may not move beyond the start of subminuette wave a above 1,991.39.
Bearish Alternate Wave Count
This bearish alternate wave count expects that the correction is not over. The flat correction which ended at 666.79 was only cycle wave a (or w) of a larger super cycle second wave correction.
The structure and subdivisions within primary wave C for the bear wave count are the same as for intermediate wave (1) for the bull wave count. Thus the short to mid term outlook is identical.
The differentiation between the bull and bear wave count is the maroon – – – channel. The bull wave count should see price remain above the lower maroon – – – trend line. The bear wave count requires a clear breach of this trend line. If this trend line is breached by a full weekly candlestick below it and not touching it then this bear wave count would be my main wave count and I would then calculate downwards targets.
We should always assume the trend remains the same until proven otherwise; the trend is your friend. While price remains above the lower maroon – – – trend line I will assume that the S&P 500 remains within a bull market.
This analysis is published about 06:42 p.m. EST.