
The main hourly Elliott wave count was correct. This fourth wave correction may end in another one to three days. I can now calculate a target for it to end.
The Elliott wave structure remains the same.
Summary: I expect downwards movement for one to three days to 1,895. Look for downwards movement to find strong support at the upper of the two aqua blue trend lines on the daily chart.
Click on charts to enlarge.
The aqua blue trend lines are critical. Draw the first trend line from the low of 1,158.66 on 25th November, 2011 to the next swing low at 1,266.74 on 4th June, 2012. Create a parallel copy and place it on the low at 1,560.33 on 24th June, 2013. While price remains above the lower of these two aqua blue trend lines we must assume the trend remains upwards. This is the main reason for the bullish wave count being my main wave count.
Bullish Wave Count.
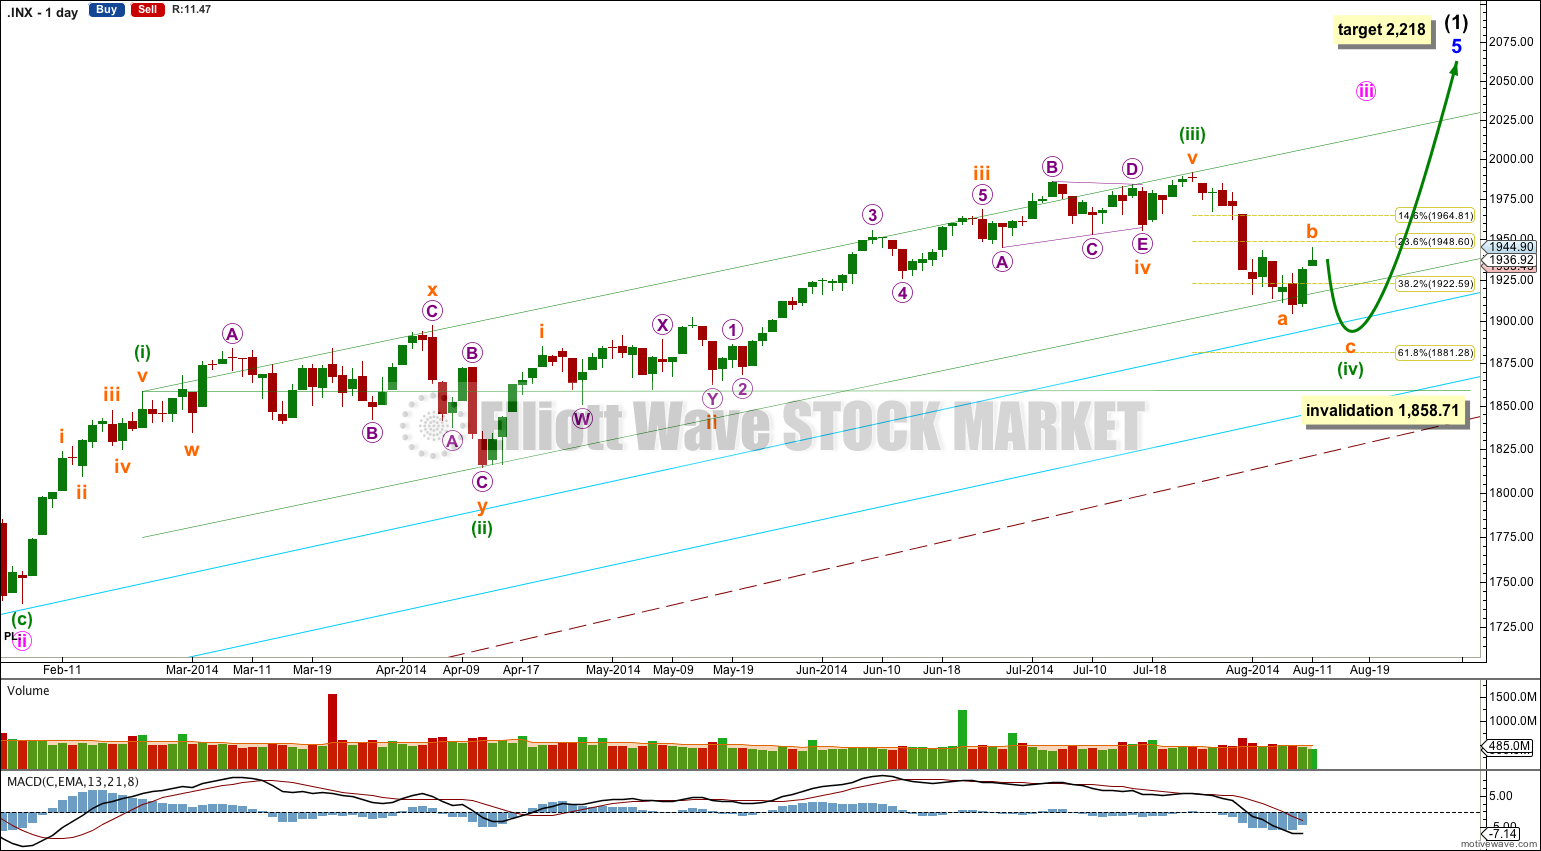
There are a couple of things about this wave count of which I am confident. I see minor wave 3 within intermediate wave (1) as over at 1,729.86 (19th September, 2013). It has the strongest upwards momentum and is just 0.76 longer than 2.618 the length of minor wave 1. At 455 days duration this is a remarkably close Fibonacci ratio. The subdivisions within it are perfect. If this is correct then minor wave 4 ends at 1,646.47 and this is where minor wave 5 begins.
Minor wave 5 is unfolding as an impulse. If minor wave 5 has passed its middle then I would expect to see more divergence between price and MACD develop over coming weeks.
Along the way up towards the final target I would expect to see two more corrections complete: the current correction for minuette wave (iv) and one more for minute wave iv.
Minuette wave (iv) may not move into minuette wave (i) price territory below 1,858.71.
At 2,218 minor wave 5 would reach equality in length with minor wave 3. This target may be met in October.
I have drawn a parallel channel about minute wave iii using Elliott’s first technique: draw the first trend line from the highs of minuette waves (i) to (iii), then place a parallel copy on the low of minuette wave (ii). Minuette wave (iv) so far slightly breaches the lower edge of this channel, and at its end I expect another small breach. This may indicate an overthrow of the channel on the opposite side for the upcoming fifth wave.
Minuette wave (iv) may reach as low as the 0.618 Fibonacci ratio of minuette wave (iii) at 1,881.28, which would provide alternation in depth of correction between minuette waves (ii) and (iv), (minuette wave (ii) was a shallow 37% correction). Downwards movement may find final support about or just above the upper aqua blue trend line, continuing a pattern which has lasted about a year now.
The large maroon – – – channel is copied over from the weekly chart. It is drawn in exactly the same way on bull and bear wave counts. For the bull wave count this channel is termed a base channel about primary waves 1 and 2. A lower degree second wave should not breach the lower edge of a base channel drawn about a first and second wave one or more degrees higher. The lower maroon – – – trend line differentiates the bull and bear wave counts at cycle degree and monthly chart level.
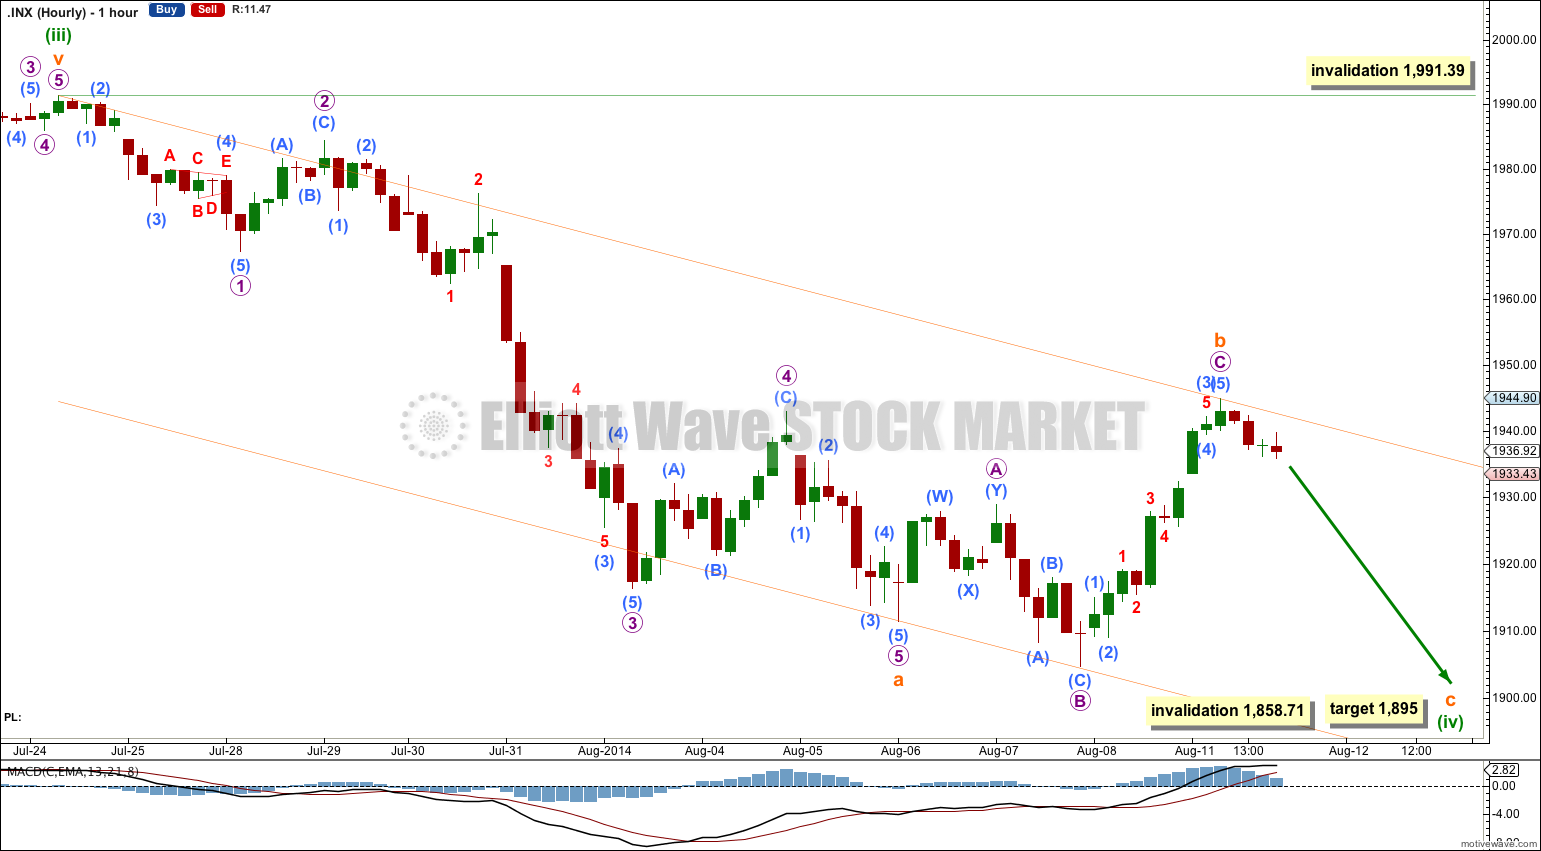
Subminuette wave b now looks to be nicely in proportion to subminuette wave a. The structure of subminuette wave b is now complete and very likely to be over.
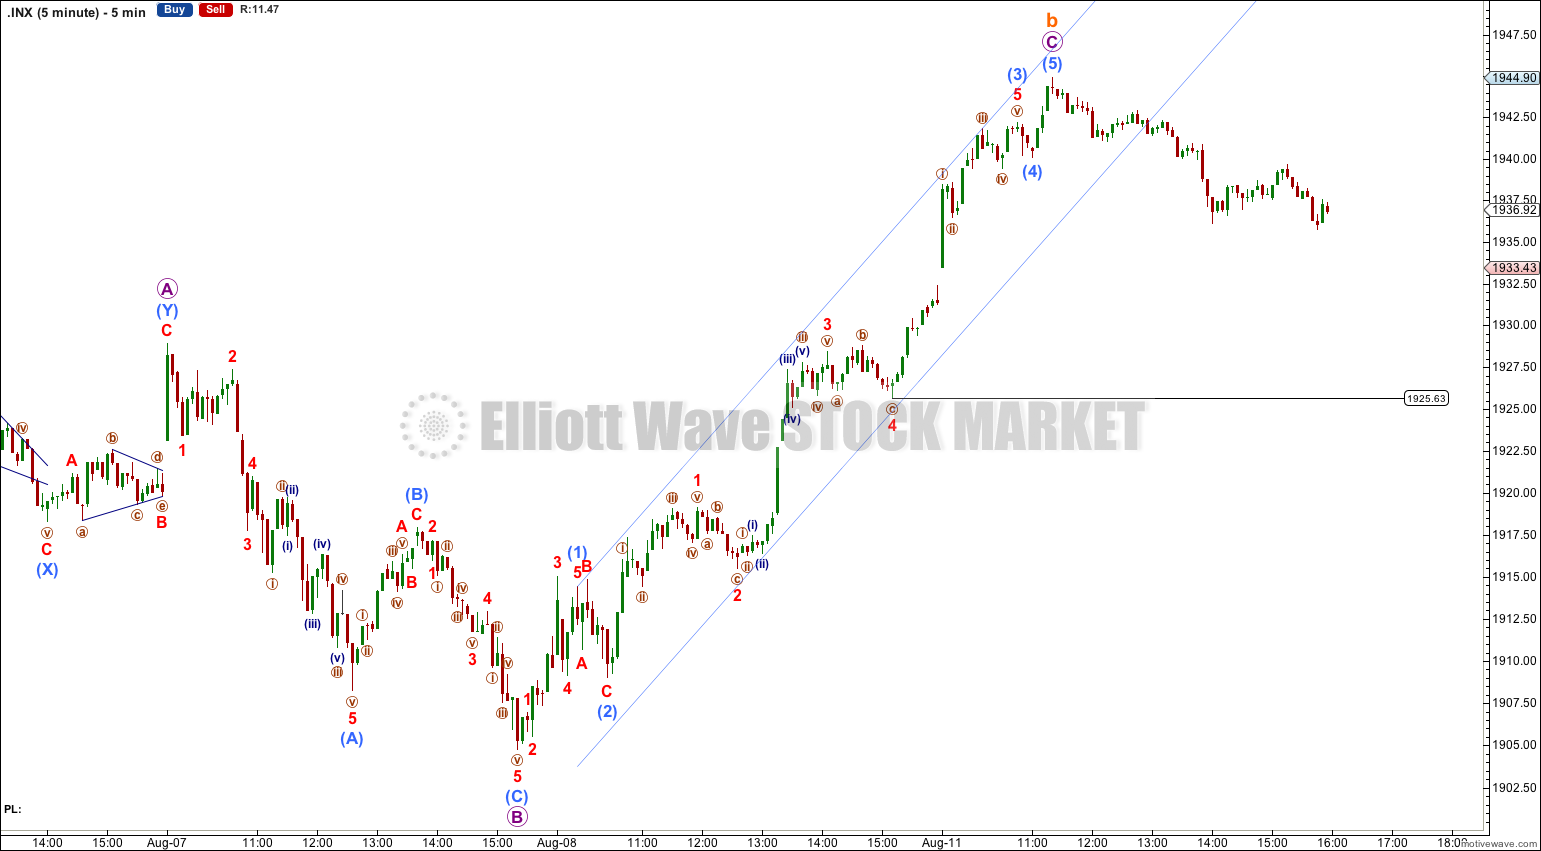
Subminuette wave b subdivides as a very common expanded flat correction: within it micro wave A is a three wave structure (a double zigzag) and micro wave B is a three and a 138% correction of micro wave A. There is no Fibonacci ratio between micro waves A and C.
Unfortunately, expanded flat corrections do not fit into parallel channels. A channel drawn about micro wave C (on the five minute chart) is clearly breached with downwards movement. This provides an indication that micro wave C is over, and so subminuette wave b is most likely over.
At 1,895 subminuette wave c would reach 0.618 the length of subminuette wave a. If this brings price down to touch the upper aqua blue trend line then this fourth wave correction is extremely likely to be over there.
Draw a channel about minuette wave (iv) zigzag using Elliott’s technique for a correction: draw the first trend line from the start of subminuette wave a to the end of subminuette wave b, then place a parallel copy on the end of subminuette wave a. I would expect subminuette wave c to end midway within this channel. When this channel is breached by subsequent upwards movement that shall be trend channel confirmation that minuette wave (iv) would be over and the upward trend would have resumed.
At this stage I am reasonably confident that subminuette wave b is over and will not move higher, but this is not 100% certain. If it does move higher it may not move beyond the start of subminuette wave a above 1,991.39. Movement below 1,925.63 would reduce the possibility that subminuette wave b could move higher and at that stage I would move the invalidation point down to its end.
Minuette wave (iv) may not move into minuette wave (i) price territory below 1,858.71.
Bearish Alternate Wave Count
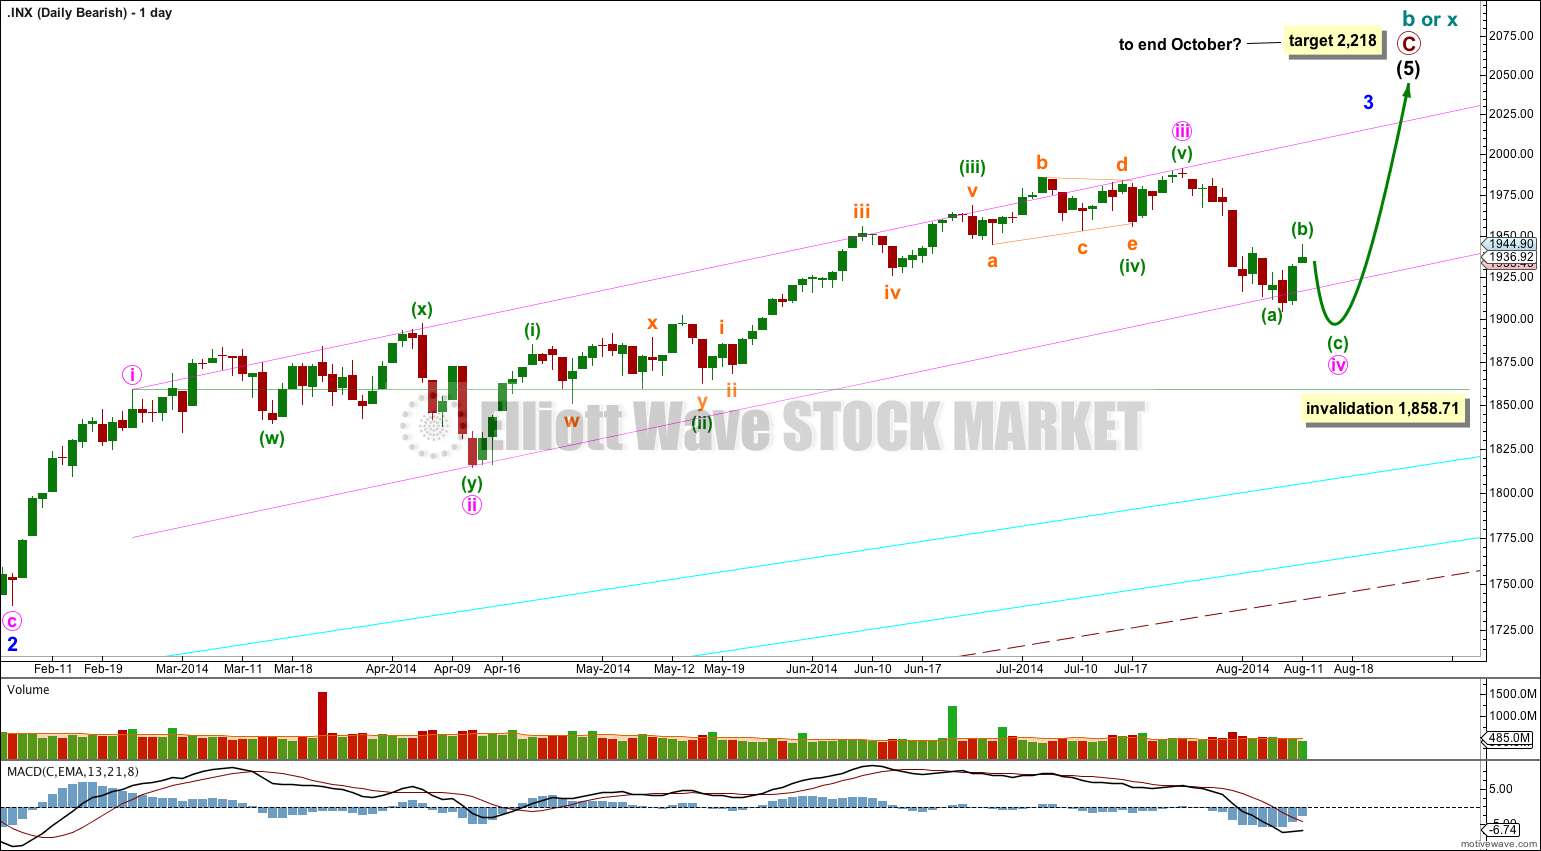
This bearish alternate wave count expects that the correction is not over. The flat correction which ended at 666.79 was only cycle wave a (or w) of a larger super cycle second wave correction.
The structure and subdivisions within primary wave C for the bear wave count are the same as for intermediate wave (1) for the bull wave count. Thus the short to mid term outlook is identical.
The differentiation between the bull and bear wave count is the maroon – – – channel. The bull wave count should see price remain above the lower maroon – – – trend line. The bear wave count requires a clear breach of this trend line. If this trend line is breached by a full weekly candlestick below it and not touching it then this bear wave count would be my main wave count and I would then calculate downwards targets.
We should always assume the trend remains the same until proven otherwise; the trend is your friend. While price remains above the lower maroon – – – trend line I will assume that the S&P 500 remains within a bull market.
This analysis is published about 06:31 p.m. EST.